Dufferin—Caledon (provincial electoral district)
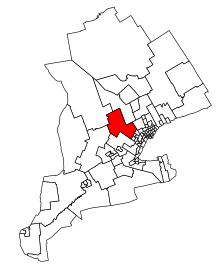 Dufferin—Caledon in relation to other central Ontario electoral districts | |||
| Provincial electoral district | |||
| Legislature | Legislative Assembly of Ontario | ||
| MPP |
Progressive Conservative | ||
| District created | 2005 | ||
| First contested | 2007 | ||
| Last contested | 2018 | ||
| Demographics | |||
| Population (2011) | 116,341 | ||
| Electors (2007) | 73,263 | ||
| Area (km²) | 2,293 | ||
| Pop. density (per km²) | 50.7 | ||
| Census divisions | Dufferin County, Peel | ||
| Census subdivisions | Caledon, Orangeville, Mono, Shelburne, Amaranth, Mulmur, Melancthon, East Luther Grand Valley, East Garafraxa | ||
Dufferin—Caledon is a provincial electoral district in southwestern Ontario, Canada. It was created for the 2007 provincial election. The entire riding was carved from Dufferin—Peel—Wellington—Grey, and includes all of Dufferin County plus the town of Caledon in Peel Region.
The riding also existed from 1987 until 1999 with the same borders, but was known as Dufferin—Peel.
Members of Provincial Parliament
| Assembly | Years | Member | Party | |
|---|---|---|---|---|
| Dufferin—Peel Riding created |
||||
| 34th | 1987–1990 | Mavis Wilson | Liberal | |
| 35th | 1990–1995 | David Tilson | Progressive Conservative | |
| 36th | 1995–1999 | |||
| Riding dissolved | ||||
| Dufferin—Caledon Riding re-created from Dufferin—Peel—Wellington—Grey |
||||
| 39th | 2007–2011 | Sylvia Jones | Progressive Conservative | |
| 40th | 2011–2014 | |||
| 41st | 2014–2018 | |||
| 42nd | 2018–Present | |||
Election results
| Ontario general election, 2018 | ||||||||
|---|---|---|---|---|---|---|---|---|
| Party | Candidate | Votes | % | ±% | ||||
| Progressive Conservative | Sylvia Jones | 29,701 | 53.08% | +13.22 | ||||
| New Democratic | Andrea Mullarkey | 11,381 | 20.34% | +8.68 | ||||
| Green | Laura Campbell | 7,011 | 12.53% | -4.10 | ||||
| Liberal | Bob Gordanier | 6,971 | 12.46% | -18.20 | ||||
| Libertarian | Jeff Harris | 436 | 0.78% | -0.41 | ||||
| Consensus Ontario | Stephen McKendrick | 301 | 0.54% | +0.54 | ||||
| Trillium | Andrew Nowell | 157 | 0.28% | +0.28 | ||||
| Total valid votes | 55,958 | 100% | ||||||
| Turnout | 55,958 | 58.55% | ||||||
| Eligible voters | 95,569 | |||||||
| Progressive Conservative hold | Swing | +13.22 | ||||||
| Source: Elections Ontario[1] | ||||||||
| Ontario general election, 2014 | ||||||||
|---|---|---|---|---|---|---|---|---|
| Party | Candidate | Votes | % | ±% | ||||
| Progressive Conservative | Sylvia Jones | 18,017 | 39.86 | -7.09 | ||||
| Liberal | Bobbie Daid | 13,861 | 30.66 | +3.91 | ||||
| Green | Karren Wallace | 7,518 | 16.63 | +2.05 | ||||
| New Democratic | Rehya Yazbek | 5,269 | 11.66 | +0.60 | ||||
| Libertarian | Daniel Kowalewski | 538 | 1.19 | +0.53 | ||||
| Total valid votes | 45,203 | 100.00 | ||||||
| Progressive Conservative hold | Swing | -5.50 | ||||||
| Source: Elections Ontario[2] | ||||||||
| Ontario general election, 2011 | ||||||||
|---|---|---|---|---|---|---|---|---|
| Party | Candidate | Votes | % | ±% | ||||
| Progressive Conservative | Sylvia Jones | 17,833 | 46.95 | +5.12 | ||||
| Liberal | Lori Holloway | 10,162 | 26.75 | -5.27 | ||||
| Green | Rob Strang | 5,540 | 14.58 | -1.71 | ||||
| New Democratic | Karen Gventer | 4,200 | 11.06 | +1.20 | ||||
| Libertarian | Daniel Kowalewski | 250 | 0.66 | |||||
| Total valid votes | 37,985 | 100.00 | ||||||
| Total rejected, unmarked and declined ballots | 166 | 0.44 | ||||||
| Turnout | 38,151 | 47.74 | ||||||
| Eligible voters | 79,918 | |||||||
| Progressive Conservative hold | Swing | +5.20 | ||||||
| Source: Elections Ontario[3] | ||||||||
| Ontario general election, 2007 | ||||||||
|---|---|---|---|---|---|---|---|---|
| Party | Candidate | Votes | % | ±% | ||||
| Progressive Conservative | Sylvia Jones | 16,508 | 41.83 | −22.93 | ||||
| Liberal | Betsy Hall | 12,636 | 32.02 | +3.19 | ||||
| Green | Rob Strang | 6,429 | 16.29 | +13.84 | ||||
| New Democratic | Lynda McDougall | 3,891 | 9.86 | +5.89 | ||||
| Total valid votes | 39,464 | 100.0 | ||||||
Dufferin—Peel—Wellington—Grey
| Ontario general election, 1999 | ||||||||
|---|---|---|---|---|---|---|---|---|
| Party | Candidate | Votes | % | ±% | ||||
| Progressive Conservative | David Tilson | 30,532 | 64.76 | -1.24 | ||||
| Liberal | Steve White | 13,591 | 28.83 | +4.69 | ||||
| New Democratic | Noel Duignan | 1,871 | 3.97 | -5.88 | ||||
| Green | Richard Procter | 1,156 | 2.45 | |||||
| Total valid votes/ | 47,150 | 100.00 | ||||||
| Total rejected ballots | 342 | – | ||||||
| Turnout | 49,492 | 58.6 | ||||||
| Eligible voters | 81,020 | |||||||
| Progressive Conservative hold | Swing | – | ||||||
Dufferin—Peel
| Ontario general election, 1995 | ||||||||
|---|---|---|---|---|---|---|---|---|
| Party | Candidate | Votes | % | ±% | ||||
| Progressive Conservative | David Tilson | 23,239 | 66.00 | +31.30 | ||||
| Liberal | Mavis Wilson | 8,501 | 24.14 | -8.66 | ||||
| New Democratic | Sandra Crane | 3,470 | 9.85 | -17.55 | ||||
| Total valid votes/ | 35,210 | 100.00 | ||||||
| Total rejected ballots | 204 | – | ||||||
| Turnout | 35,414 | 65.2 | ||||||
| Eligible voters | 54,176 | |||||||
| Progressive Conservative hold | Swing | +19.98 | ||||||
| Ontario general election, 1990 | ||||||||
|---|---|---|---|---|---|---|---|---|
| Party | Candidate | Votes | % | ±% | ||||
| Progressive Conservative | David Tilson | 10,899 | 34.70 | +3.41 | ||||
| Liberal | Mavis Wilson | 10,327 | 32.80 | -20.26 | ||||
| New Democratic | Sandra Crane | 8,627 | 27.40 | +11.76 | ||||
| Libertarian | Bob Shapton | 1,594 | 5.10 | – | ||||
| Total valid votes/ | 35,210 | 100.00 | ||||||
| Total rejected ballots | 204 | – | ||||||
| Turnout | 35,414 | |||||||
| Progressive Conservative gain from Liberal | Swing | +11.84 | ||||||
2007 electoral reform referendum
| Ontario electoral reform referendum, 2007 | |||
|---|---|---|---|
| Side | Votes | % | |
| First Past the Post | 24,736 | 64.1 | |
| Mixed member proportional | 13,867 | 35.9 | |
| Total valid votes | 38,603 | 100.0 | |
Sources
- ↑ "Dufferin—Caledon Election Night Results 2018". Elections Ontario. Retrieved 8 June 2018.
- ↑ Elections Ontario (2014). "Official result from the records, Dufferin-Caledon" (PDF). Archived from the original (PDF) on 2 June 2015. Retrieved 17 June 2015.
- ↑ Elections Ontario (2011). "Official return from the records / Rapport des registres officiels - Dufferin—Caledon" (PDF). Retrieved 2 June 2014.
This article is issued from
Wikipedia.
The text is licensed under Creative Commons - Attribution - Sharealike.
Additional terms may apply for the media files.