Climate of Los Angeles
The Climate of Los Angeles is a year-round mild-to-hot and mostly dry climate for the LA metropolitan area in California. The climate is classified as a Mediterranean climate, which is a type of dry subtropical climate. It is characterized by seasonal changes in rainfall—with a dry summer and a winter rainy season. Under the modified Köppen climate classification, the coastal areas are classified as Csb, and the inland areas as Csa.
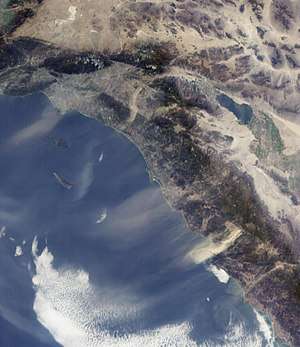
The Los Angeles area contains microclimates, where daytime temperatures can vary as much as 36 °F (20 °C) between inland areas such as the San Fernando Valley or San Gabriel Valley, and the coastal Los Angeles Basin.
Temperatures and seasons
The primary weather station for Los Angeles is located near downtown at the University of Southern California campus, and this article refers primarily to climate data generated by this station as representative of the Los Angeles metropolitan area as a whole.
Los Angeles is a hot-summer mediterranean climate (Köppen Csa), with hot, dry summers, and cooler wetter winters. While the typical dry-summer and wet-winter pattern typical of most Mediterranean climates is part of the climate of Los Angeles, precipitation annually is lower than in many typical Mediterranean climates.
The summer dry season normally runs from June through October, when clear skies, hot temperatures, and very little change in sensible weather occur from day to day. Average high temperatures are in the lower 80's F (26-28 C) with overnight lows in the lower 60's F (15-17 C). During this season, there is essentially no rainfall, and both July and August average less than 0.05 of a inches (1.27 mm) of monthly precipitation.
The winter wet season normally runs from November through early May. Precipitation episodes in Los Angeles, with a few notable exceptions, are largely caused by extratropical disturbances approaching California from the west or northwest during the winter season. The normal seasonal rainfall measured at downtown Los Angeles is 14.77 inches, of which 92% falls between November 1st and April 30th. [1] While there is a great increase in rainfall in the winter months, the winter months in Los Angeles are still frequently sunny and pleasant with mild temperatures. The average highs range from the upper 60's F to 70 F (17-21 C) with cooler overnight lows in the upper 40's and lower 50's F (8-12 C).
| Month | Jan | Feb | Mar | Apr | May | Jun | Jul | Aug | Sep | Oct | Nov | Dec | Year |
|---|---|---|---|---|---|---|---|---|---|---|---|---|---|
| Record high °F (°C) | 95 (35) |
95 (35) |
99 (37) |
106 (41) |
103 (39) |
112 (44) |
109 (43) |
106 (41) |
113 (45) |
108 (42) |
100 (38) |
92 (33) |
113 (45) |
| Average high °F (°C) | 68.2 (20.1) |
68.6 (20.3) |
70.2 (21.2) |
72.7 (22.6) |
74.5 (23.6) |
78.1 (25.6) |
83.1 (28.4) |
84.4 (29.1) |
83.1 (28.4) |
78.5 (25.8) |
72.8 (22.7) |
67.7 (19.8) |
75.2 (24) |
| Daily mean °F (°C) | 58.0 (14.4) |
58.9 (14.9) |
60.6 (15.9) |
63.1 (17.3) |
65.8 (18.8) |
69.2 (20.7) |
73.3 (22.9) |
74.3 (23.5) |
73.1 (22.8) |
68.6 (20.3) |
62.4 (16.9) |
57.6 (14.2) |
65.4 (18.6) |
| Average low °F (°C) | 47.8 (8.8) |
49.3 (9.6) |
51.0 (10.6) |
53.5 (11.9) |
57.1 (13.9) |
60.3 (15.7) |
63.6 (17.6) |
64.1 (17.8) |
63.1 (17.3) |
58.7 (14.8) |
52.0 (11.1) |
47.5 (8.6) |
55.7 (13.2) |
| Record low °F (°C) | 28 (−2) |
28 (−2) |
31 (−1) |
36 (2) |
40 (4) |
46 (8) |
49 (9) |
49 (9) |
44 (7) |
40 (4) |
34 (1) |
30 (−1) |
28 (−2) |
| Average rainfall inches (mm) | 3.12 (79.2) |
3.80 (96.5) |
2.43 (61.7) |
0.91 (23.1) |
0.26 (6.6) |
0.09 (2.3) |
0.01 (0.3) |
0.04 (1) |
0.24 (6.1) |
0.66 (16.8) |
1.04 (26.4) |
2.33 (59.2) |
14.93 (379.2) |
| Average rainy days (≥ 0.01 in) | 6.1 | 6.4 | 5.5 | 3.2 | 1.3 | 0.6 | 0.3 | 0.3 | 1.0 | 2.5 | 3.3 | 5.2 | 35.7 |
| Mean monthly sunshine hours | 225.3 | 222.5 | 267.0 | 303.5 | 276.2 | 275.8 | 364.1 | 349.5 | 278.5 | 255.1 | 217.3 | 219.4 | 3,254.2 |
| Percent possible sunshine | 71 | 72 | 72 | 78 | 64 | 64 | 83 | 84 | 75 | 73 | 70 | 71 | 73 |
| Source: NOAA (sun 1961–1977)[2][3][4] | |||||||||||||
Summer

Summers are warm to hot, and nearly completely dry. The summer temperature pattern usually begins in late June or early July, and lasts through September or October, although it may start as early as late May. In August, the average high/low at the University of Southern California downtown campus are 84.8 °F (29.3 °C) and 65.6 °F (18.7 °C). The same figures at the LAX airport, approximately 12 miles (19 km) to the southwest and near the ocean, are 76.6 °F (24.8 °C) and 64.2 °F (17.9 °C). However, temperatures across the region sometimes exceed 90 °F (32 °C) during the summer. This happens when an atmospheric high-pressure area becomes dominant over the Great Basin of Nevada and Utah (a frequent occurrence), and the resulting offshore flow of the atmospheric air mass shuts off the normal coastal sea breeze in Los Angeles. July, August and September are the hottest months, with September holding the all-time record of 113 °F (45 °C). Skies are nearly constantly sunny, unless interrupted in late spring and early summer by the June Gloom pattern, which is unpredictable year-to-year. The North American Monsoon can bring occasional thunderstorms and high humidity to Los Angeles in the summer and early fall.
Winter
Winters are mildly cool to warm, with average high temperatures at the Downtown/USC weather station of 68 °F (20 °C) and lows of 48 °F (9 °C), with occasional heavy rainfall. Temperatures across the coastal basin rarely drop below 40 °F (4 °C), although light frost does occasionally form during cooler nights, at least in areas removed from the direct influence of the coastal air (approximately 5 miles (8 km) inland from the beach). The last severe cold outbreak in the Los Angeles area occurred in December 1990, when temperatures dropped below freezing across a major portion of the coastal plain, and into the low to mid 20s F over inland valleys. Temperatures stayed below freezing for up to eight hours at some valley locations, resulting in significant damage to plants and commercial agriculture. [5]
In the winter months, high pressure systems over the deserts often bring Santa Ana winds, resulting in dry, and dusty days. On rare occasion, temperatures can reach into the 85 to 95 °F (29 to 35 °C) range during Santa Ana Winds even in December or January. Sunny skies characteristically dominate the weather pattern in the winter season, mixed in with the occasional rain producing weather system.
Spring and Autumn
Spring and autumn hardly exist as such in this climate. Summer temperature patterns of 75 to 90 °F (24 to 32 °C) highs and 60 to 70 °F (16 to 21 °C) lows usually persist until early-November. Likewise, the "winter-season" temperature pattern of 65 to 75 °F (18 to 24 °C) highs and 45 to 60 °F (7 to 16 °C) lows may last through April or May, periodically interrupted by hot Santa Ana wind events for up to a week at a time. The rainy season always ends by mid-May. June is normally a transitional month of less-volatile temperatures between 60 and 80 °F (16 and 27 °C), with increased cloudy days and the disappearance of the Santa Ana winds.
Rainfall
Rainfall, on average, is frequently below average. Most rain occurs during the winter and early to mid spring, typical of a Mediterranean climate. However, the amount received is usually lower than in other Mediterranean climates. The first sporadic rainfall of the rainy season usually occurs in October or November, with heavy rain becoming more common December through early April. Usually the Pineapple Express storms from November to January. February, on average, is the wettest month. The rains then taper off in April or by May, usually see only two to three light rain showers. However, the timing and volume of rains in the winter is far from predictable. After a significant rain, the region's air is cleared of the usual atmospheric haze as well as man-made smog, giving exceptionally clear views across the giant metropolis.

Most cold fronts and depressions spun off by the polar low, the strong winter seasonal low-pressure area in the Gulf of Alaska, fail to carry significant precipitable moisture as far south as Los Angeles, resulting in the region's relatively low average rainfall amount of 12–15 inches (300–380 mm) even in normal years. However, a "normal" year rarely occurs, since rainfall in Los Angeles is subject to the position and strength of the jet stream, and the strength of the Gulf of Alaska low. Some years, a well-developed series of cold fronts moves into the area with relatively short separation between each, bringing intermittently rainy periods to Los Angeles for several weeks at a time. If this pattern persists in a rainy season, significantly above-average precipitation will be received. Other years, especially in the drought years of 2012–2016, a blocking region of atmospheric high pressure over the eastern Pacific Ocean, between Alaska and the Pacific Northwest, diverts the jet stream and its flow of cold fronts far to the north through Canada and down into the U.S. Midwest, leaving the U.S. west coast and especially Los Angeles under warm and dry conditions for weeks to months at a time.
Because the rainy season begins in late fall and ends in early to mid spring, precipitation is measured using the water year instead of the calendar year, to give an accurate picture of each rainy season's precipitation amounts. Each water year begins October 1 and ends the following September 30, during the driest part of the year.
Sometimes rainfall can occur in the summer from westward-straying monsoon thunderstorms, but this is unusual. Even less common is rain from remnants of dissipating eastern Pacific hurricanes. Los Angeles averages only 15.1 inches (384 mm) of precipitation per year, and this is lower at the coast and higher in the mountains and foothill cities. Rain is typically brought with when High Pressure systems in the summer which move east in a clockwise across the western United States bringing motion bringing in Monsoonal Moisture to the area. This will usually occur during the summer months (usually in July–September). Snow is extremely rare in the Greater Los Angeles area and basin, but the nearby San Gabriel Mountains and San Bernardino Mountains typically receive a heavy amount of snow every winter season. The greatest snowfall recorded in downtown Los Angeles was 2 inches (5 cm) on January 15, 1932.[6][7]
El Niño–Southern Oscillation
Historically-speaking, the warm-phase of an El Niño–Southern Oscillation (ENSO) regime typically coincides with above average precipitation across Southern California.[8] The above average sea-surface temperatures in the equatorial Pacific Ocean are largely responsible for this as the ocean acts as a rich moisture source for tropical moisture to advect towards the North American continent in atmospheric river events. Prior to the strong El Nino of 2015–2016, the previous two strong El Niño events[9] in 1982–83 and 1997–98 coincided with well-above average precipitation across Southern California.[10] While some measurements suggest the 2015-2016 El Niño was the strongest on record since 1950,[9] Southern California received below average precipitation contrary to what the Climate Prediction Center predicted leading up to the winter months.[11] While scientists have long agreed the intensity and timing of the winter precipitation pattern in Los Angeles is more complex than just analyzing the warm/cool phase of ENSO, the fact that Los Angeles received below average precipitation during the strong El Niño event of 2015–2016 will be the subject of numerous research studies among climate scientists.
.jpg)
Surrounding areas in the region
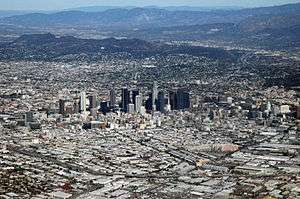
Coastal Basin
The Los Angeles Basin, composed of the coastal plain surrounded by mountains, is generally the coolest in summer and mildest in winter. Overall, it receives less rainfall than the surrounding valleys and mountains.
LAX
LAX airport and its surroundings (Westchester and El Segundo, as well as Santa Monica, Venice, and the immediately surrounding neighborhoods) are generally the coolest part of the region in the summer, as they receive a near-constant sea breeze. Santa Monica and its environs may be 10 to 15 °F (6 to 8 °C) cooler than areas only 5 miles (8.0 km) further inland. Under the Köppen climate classification LAX has a semi-arid climate due to its modest winter rainfall and mild mean temperatures.
| Climate data for Los Angeles (LAX), 1981–2010 normals, extremes 1944–present | |||||||||||||
|---|---|---|---|---|---|---|---|---|---|---|---|---|---|
| Month | Jan | Feb | Mar | Apr | May | Jun | Jul | Aug | Sep | Oct | Nov | Dec | Year |
| Record high °F (°C) | 91 (33) |
92 (33) |
95 (35) |
95 (35) |
91 (33) |
94 (34) |
93 (34) |
98 (37) |
106 (41) |
101 (38) |
101 (38) |
94 (34) |
106 (41) |
| Average high °F (°C) | 64.6 (18.1) |
64.3 (17.9) |
64.4 (18) |
66.4 (19.1) |
68.1 (20.1) |
70.6 (21.4) |
73.8 (23.2) |
74.9 (23.8) |
74.6 (23.7) |
72.5 (22.5) |
68.9 (20.5) |
64.6 (18.1) |
69.0 (20.6) |
| Daily mean °F (°C) | 56.7 (13.7) |
57.1 (13.9) |
58.0 (14.4) |
60.1 (15.6) |
62.7 (17.1) |
65.5 (18.6) |
68.8 (20.4) |
69.6 (20.9) |
68.9 (20.5) |
65.9 (18.8) |
61.1 (16.2) |
56.6 (13.7) |
62.6 (17) |
| Average low °F (°C) | 48.8 (9.3) |
50.0 (10) |
51.7 (10.9) |
53.8 (12.1) |
57.3 (14.1) |
60.5 (15.8) |
63.7 (17.6) |
64.3 (17.9) |
63.2 (17.3) |
59.3 (15.2) |
53.2 (11.8) |
48.7 (9.3) |
56.2 (13.4) |
| Record low °F (°C) | 27 (−3) |
34 (1) |
35 (2) |
42 (6) |
45 (7) |
48 (9) |
52 (11) |
51 (11) |
47 (8) |
43 (6) |
38 (3) |
32 (0) |
27 (−3) |
| Average rainfall inches (mm) | 2.71 (68.8) |
3.25 (82.6) |
1.85 (47) |
0.70 (17.8) |
0.22 (5.6) |
0.08 (2) |
0.03 (0.8) |
0.05 (1.3) |
0.21 (5.3) |
0.56 (14.2) |
1.11 (28.2) |
2.05 (52.1) |
12.82 (325.7) |
| Average rainy days (≥ 0.01 in) | 6.0 | 6.6 | 5.8 | 2.8 | 1.2 | 0.6 | 0.5 | 0.3 | 1.0 | 2.3 | 3.4 | 5.2 | 35.7 |
| Average relative humidity (%) | 63.4 | 67.9 | 70.5 | 71.0 | 74.0 | 75.9 | 76.6 | 76.6 | 74.2 | 70.5 | 65.5 | 62.9 | 70.8 |
| Source: NOAA (relative humidity 1961–1990)[2][12][13] | |||||||||||||
Santa Monica
Santa Monica has mean temperatures low enough for its precipitation numbers to still retain a cool-summer mediterranean climate (csb).
| Climate data for Santa Monica Pier, California (on the beach) | |||||||||||||
|---|---|---|---|---|---|---|---|---|---|---|---|---|---|
| Month | Jan | Feb | Mar | Apr | May | Jun | Jul | Aug | Sep | Oct | Nov | Dec | Year |
| Average high °F (°C) | 63.7 (17.6) |
63.4 (17.4) |
62.1 (16.7) |
63.4 (17.4) |
63.6 (17.6) |
65.9 (18.8) |
68.8 (20.4) |
70.3 (21.3) |
70.5 (21.4) |
69.6 (20.9) |
67.3 (19.6) |
64.8 (18.2) |
66.1 (18.9) |
| Average low °F (°C) | 50.2 (10.1) |
51.3 (10.7) |
52.1 (11.2) |
53.9 (12.2) |
56.5 (13.6) |
59.4 (15.2) |
62.1 (16.7) |
63.1 (17.3) |
62.6 (17) |
59.4 (15.2) |
54.3 (12.4) |
50.5 (10.3) |
56.3 (13.5) |
| Average rainfall inches (mm) | 3.06 (77.7) |
3.29 (83.6) |
2.56 (65) |
0.53 (13.5) |
0.25 (6.4) |
0.04 (1) |
0.01 (0.3) |
0.13 (3.3) |
0.17 (4.3) |
0.36 (9.1) |
1.02 (25.9) |
1.85 (47) |
13.27 (337.1) |
| Average rainy days | 6.0 | 5.9 | 5.1 | 2.4 | 1.0 | 0.4 | 0.2 | 0.5 | 1.0 | 1.8 | 2.5 | 4.0 | 30.8 |
| Source: NOAA [14] | |||||||||||||
Culver City, Inglewood and Palms Area
Culver City, Inglewood, Palms, and surrounding areas are only a few miles inland from Santa Monica and the beach, but reach temperatures up to 10 degrees (F) warmer on average in the summer. Culver City has a semi-arid climate that is still significantly moderated by the Pacific trade winds keeping averages mild compared to areas farther inland.
| Climate data for Culver City, California | |||||||||||||
|---|---|---|---|---|---|---|---|---|---|---|---|---|---|
| Month | Jan | Feb | Mar | Apr | May | Jun | Jul | Aug | Sep | Oct | Nov | Dec | Year |
| Average high °F (°C) | 67.3 (19.6) |
68.6 (20.3) |
69.3 (20.7) |
72.6 (22.6) |
73.5 (23.1) |
77.1 (25.1) |
80.0 (26.7) |
81.1 (27.3) |
80.2 (26.8) |
77.0 (25) |
71.6 (22) |
67.7 (19.8) |
73.8 (23.2) |
| Daily mean °F (°C) | 56.7 (13.7) |
57.9 (14.4) |
59.2 (15.1) |
62.3 (16.8) |
64.6 (18.1) |
68.0 (20) |
70.8 (21.6) |
71.7 (22.1) |
70.8 (21.6) |
67.1 (19.5) |
61.2 (16.2) |
57.0 (13.9) |
63.9 (17.7) |
| Average low °F (°C) | 46.1 (7.8) |
47.2 (8.4) |
49.1 (9.5) |
52.0 (11.1) |
55.7 (13.2) |
58.8 (14.9) |
61.5 (16.4) |
62.2 (16.8) |
61.3 (16.3) |
57.2 (14) |
50.8 (10.4) |
46.3 (7.9) |
54.0 (12.2) |
| Average rainfall inches (mm) | 3.19 (81) |
3.25 (82.6) |
2.66 (67.6) |
0.58 (14.7) |
0.26 (6.6) |
0.04 (1) |
0.02 (0.5) |
0.07 (1.8) |
0.08 (2) |
0.33 (8.4) |
0.94 (23.9) |
1.90 (48.3) |
13.32 (338.3) |
| Average rainy days (≥ 0.01 inch) | 5.7 | 5.3 | 5.8 | 1.7 | 0.7 | 0.2 | 0.3 | 0.2 | 0.6 | 1.1 | 1.9 | 4.0 | 27.5 |
| Source: NOAA[15] | |||||||||||||
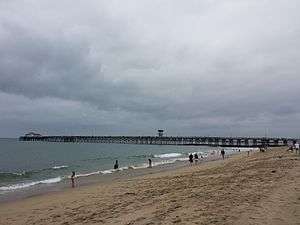
Long Beach
Long Beach, located in the coastal basin about 20 miles (30 km) to the south of downtown Los Angeles, has a coastally-influenced climate, but is not as cool as Santa Monica, or the Westside, or the South Bay during the summer. Long Beach sits on a south-facing section of coast, and does not receive as much sea breeze cooling from the prevailing westerly/south-westerly winds (as these winds may pass over the Palos Verdes Peninsula, San Pedro, and the twin ports first). Long Beach's high temperature can compete with those of downtown Los Angeles. Locations further north in Long Beach, which stretches over 8.5 miles (13.7 km) northward from the water, can be considerably warmer than Long Beach's coast and airport weather station.
| Climate data for Long Beach, California (Long Beach Airport) | |||||||||||||
|---|---|---|---|---|---|---|---|---|---|---|---|---|---|
| Month | Jan | Feb | Mar | Apr | May | Jun | Jul | Aug | Sep | Oct | Nov | Dec | Year |
| Record high °F (°C) | 93 (34) |
91 (33) |
98 (37) |
105 (41) |
104 (40) |
109 (43) |
107 (42) |
105 (41) |
111 (44) |
111 (44) |
101 (38) |
92 (33) |
111 (44) |
| Average high °F (°C) | 67.4 (19.7) |
67.2 (19.6) |
68.6 (20.3) |
71.7 (22.1) |
73.6 (23.1) |
76.7 (24.8) |
81.9 (27.7) |
83.8 (28.8) |
82.1 (27.8) |
77.2 (25.1) |
72.1 (22.3) |
66.8 (19.3) |
74.1 (23.4) |
| Daily mean °F (°C) | 56.7 (13.7) |
57.6 (14.2) |
59.6 (15.3) |
62.4 (16.9) |
65.6 (18.7) |
68.9 (20.5) |
73.2 (22.9) |
74.3 (23.5) |
72.7 (22.6) |
67.7 (19.8) |
61.4 (16.3) |
56.3 (13.5) |
64.7 (18.2) |
| Average low °F (°C) | 46.1 (7.8) |
48.0 (8.9) |
50.5 (10.3) |
53.2 (11.8) |
57.6 (14.2) |
61.0 (16.1) |
64.5 (18.1) |
64.9 (18.3) |
63.2 (17.3) |
58.3 (14.6) |
50.8 (10.4) |
45.8 (7.7) |
55.3 (12.9) |
| Record low °F (°C) | 25 (−4) |
33 (1) |
33 (1) |
38 (3) |
40 (4) |
47 (8) |
51 (11) |
51 (11) |
50 (10) |
39 (4) |
34 (1) |
28 (−2) |
25 (−4) |
| Average rainfall inches (mm) | 2.60 (66) |
3.09 (78.5) |
1.87 (47.5) |
0.60 (15.2) |
0.21 (5.3) |
0.07 (1.8) |
0.03 (0.8) |
0.03 (0.8) |
0.18 (4.6) |
0.63 (16) |
1.00 (25.4) |
1.95 (49.5) |
12.26 (311.4) |
| Average rainy days (≥ 0.01 in) | 5.9 | 6.5 | 5.3 | 3.1 | 1.1 | 0.7 | 0.5 | 0.3 | 0.9 | 2.5 | 3.4 | 5.0 | 35.2 |
| Source: NOAA[16] | |||||||||||||
San Fernando Valley
The San Fernando Valley is known for significantly higher temperatures than the coastal basin. Canoga Park and Woodland Hills, in the south-west end of the valley, typically record the highest temperatures. The all-time high of 116 °F (47 °C) nearly rivals the record high temperatures of Phoenix, Arizona (122 °F (50 °C)) and Palm Springs (123 °F (51 °C)). The city of Burbank, at the eastern end of the Valley, is also known for being significantly hotter than downtown Los Angeles, which is only 9 miles (14 km) to the south. During winter both the Canoga Park and Burbank weather stations are significantly wetter than some coastal stations and thus retain hot-summer mediterranean climates (csa). By comparison, Canoga Park has quite cool summer nights, in contrast to many other interior Southern California areas.
| Climate data for Los Angeles (Canoga Park, in the San Fernando Valley) | |||||||||||||
|---|---|---|---|---|---|---|---|---|---|---|---|---|---|
| Month | Jan | Feb | Mar | Apr | May | Jun | Jul | Aug | Sep | Oct | Nov | Dec | Year |
| Record high °F (°C) | 93 (34) |
94 (34) |
101 (38) |
105 (41) |
113 (45) |
113 (45) |
115 (46) |
116 (47) |
115 (46) |
110 (43) |
99 (37) |
96 (36) |
116 (47) |
| Average high °F (°C) | 67.9 (19.9) |
69.9 (21.1) |
72.0 (22.2) |
77.7 (25.4) |
81.3 (27.4) |
88.8 (31.6) |
95.0 (35) |
96.0 (35.6) |
91.7 (33.2) |
84.4 (29.1) |
74.7 (23.7) |
68.8 (20.4) |
80.7 (27.1) |
| Daily mean °F (°C) | 53.7 (12.1) |
55.4 (13) |
57.2 (14) |
61.3 (16.3) |
65.2 (18.4) |
71.0 (21.7) |
76.0 (24.4) |
76.8 (24.9) |
73.5 (23.1) |
66.8 (19.3) |
58.2 (14.6) |
53.6 (12) |
64.1 (17.8) |
| Average low °F (°C) | 39.5 (4.2) |
40.9 (4.9) |
42.3 (5.7) |
44.8 (7.1) |
49.1 (9.5) |
53.2 (11.8) |
56.9 (13.8) |
57.6 (14.2) |
55.2 (12.9) |
49.2 (9.6) |
41.7 (5.4) |
38.3 (3.5) |
47.4 (8.6) |
| Record low °F (°C) | 19 (−7) |
18 (−8) |
26 (−3) |
30 (−1) |
33 (1) |
36 (2) |
42 (6) |
42 (6) |
38 (3) |
27 (−3) |
23 (−5) |
20 (−7) |
18 (−8) |
| Average rainfall inches (mm) | 3.83 (97.3) |
4.40 (111.8) |
3.60 (91.4) |
0.88 (22.4) |
0.32 (8.1) |
0.07 (1.8) |
0.01 (0.3) |
0.15 (3.8) |
0.24 (6.1) |
0.62 (15.7) |
1.29 (32.8) |
2.38 (60.5) |
17.79 (452) |
| Average rainy days | 6.2 | 5.9 | 6.1 | 3.0 | 1.3 | 0.4 | 0.1 | 0.7 | 1.3 | 2.0 | 3.2 | 4.4 | 34.6 |
| Source: NOAA[17] | |||||||||||||
| Climate data for Burbank, California | |||||||||||||
|---|---|---|---|---|---|---|---|---|---|---|---|---|---|
| Month | Jan | Feb | Mar | Apr | May | Jun | Jul | Aug | Sep | Oct | Nov | Dec | Year |
| Record high °F (°C) | 93 (34) |
92 (33) |
98 (37) |
105 (41) |
107 (42) |
111 (44) |
114 (46) |
111 (44) |
113 (45) |
108 (42) |
101 (38) |
92 (33) |
114 (46) |
| Average high °F (°C) | 70 (21) |
71 (22) |
74 (23) |
77 (25) |
82 (28) |
85 (29) |
90 (32) |
92 (33) |
91 (33) |
83 (28) |
76 (24) |
70 (21) |
80 (27) |
| Average low °F (°C) | 45 (7) |
46 (8) |
47 (8) |
50 (10) |
55 (13) |
61 (16) |
64 (18) |
65 (18) |
63 (17) |
57 (14) |
48 (9) |
45 (7) |
54 (12) |
| Record low °F (°C) | 22 (−6) |
27 (−3) |
22 (−6) |
32 (0) |
39 (4) |
43 (6) |
45 (7) |
46 (8) |
43 (6) |
33 (1) |
29 (−2) |
22 (−6) |
22 (−6) |
| Average rainfall inches (mm) | 3.53 (89.7) |
4.62 (117.3) |
2.97 (75.4) |
1.11 (28.2) |
.35 (8.9) |
.11 (2.8) |
.02 (0.5) |
.07 (1.8) |
.23 (5.8) |
.97 (24.6) |
1.07 (27.2) |
2.40 (61) |
17.45 (443.2) |
| Source: Weather.com[18] | |||||||||||||
Orange County
North/Central Orange County
The climate of Santa Ana, the county seat of Orange County, as well as Anaheim, both in north-central Orange County, are quite similar, and typical of locations on the coastal plain 10 to 15 miles (16 to 24 km) inland from the beach. Whilst Santa Ana sits firmly on the border between the semi-arid and the hot-summer mediterranean climate, Anaheim is firmly a semi-arid climate with very low precipitation for the Los Angeles metropolitan area.
| Climate data for Santa Ana, California | |||||||||||||
|---|---|---|---|---|---|---|---|---|---|---|---|---|---|
| Month | Jan | Feb | Mar | Apr | May | Jun | Jul | Aug | Sep | Oct | Nov | Dec | Year |
| Average high °F (°C) | 69 (21) |
70 (21) |
71 (22) |
74 (23) |
75 (24) |
79 (26) |
83 (28) |
84 (29) |
83 (28) |
80 (27) |
74 (23) |
70 (21) |
76 (24) |
| Average low °F (°C) | 47 (8) |
48 (9) |
50 (10) |
52 (11) |
56 (13) |
60 (16) |
63 (17) |
64 (18) |
63 (17) |
58 (14) |
51 (11) |
46 (8) |
55 (13) |
| Average rainfall inches (mm) | 3.19 (81) |
3.03 (77) |
2.8 (71) |
0.67 (17) |
0.24 (6.1) |
0.12 (3) |
0.04 (1) |
0.12 (3) |
0.35 (8.9) |
0.35 (8.9) |
1.18 (30) |
1.77 (45) |
13.86 (351.9) |
| Source: U.S. Climate Data[19] | |||||||||||||
| Climate data for Anaheim, California | |||||||||||||
|---|---|---|---|---|---|---|---|---|---|---|---|---|---|
| Month | Jan | Feb | Mar | Apr | May | Jun | Jul | Aug | Sep | Oct | Nov | Dec | Year |
| Average high °F (°C) | 69 (21) |
69 (21) |
70 (21) |
73 (23) |
75 (24) |
79 (26) |
84 (29) |
86 (30) |
85 (29) |
80 (27) |
74 (23) |
70 (21) |
76 (24) |
| Average low °F (°C) | 45 (7) |
47 (8) |
48 (9) |
51 (11) |
56 (13) |
60 (16) |
65 (18) |
65 (18) |
63 (17) |
56 (13) |
51 (11) |
44 (7) |
54 (12) |
| Average rainfall inches (mm) | 2.4 (61) |
2.8 (71) |
2.5 (64) |
0.6 (15) |
0.1 (3) |
0.1 (3) |
0.0 (0) |
0.0 (0) |
0.1 (3) |
0.2 (5) |
0.8 (20) |
1.3 (33) |
10.9 (278) |
| Source: U.S. Climate Data[20] | |||||||||||||
Extreme weather
Records
In downtown Los Angeles, weather records began on July 1, 1877. The highest temperature recorded in downtown Los Angeles was 113 °F (45 °C) on September 27, 2010. The lowest temperature was 28 °F (−2 °C) on January 7, 1913 and on January 4, 1949.[21] The wettest “rain year” from July to the following June was 1883/1884 with 38.18 inches (969.8 mm), and the driest 2006/2007 with 3.21 inches (81.5 mm).[22] The greatest rainfall in one month was 15.80 inches (401.3 mm) in December 1889, which also had the most days – twenty – receiving at least 0.01 inches (0.3 mm) of rain. The greatest rainfall in 24 hours was 5.68 inches (144.3 mm) on March 2, 1938.[23]
At the Los Angeles International Airport, the highest recorded temperature was 110 °F (43 °C) on September 26, 1963. The lowest temperature was 27 °F (−3 °C) on January 4, 1949. The wettest year was 1983 with 29.46 inches (748 mm) and the driest year was 1947 with 2.95 inches (74.9 mm). The greatest rainfall in one month was 13.79 inches (350 mm) in February 1998. The greatest rainfall in 24 hours was 5.60 inches (142.2 mm) on November 21, 1967.[24]
In Long Beach, the highest recorded temperature was 111 °F (44 °C) on October 16, 1958, and October 15, 1961, and again on September 27, 2010. The lowest temperature was 21 °F (−6 °C) on January 20, 1922. The wettest year was 1978 with 27.67 inches (703 mm). The driest year was 2002 with 2.63 inches (66.8 mm). The greatest rainfall in one month was 14.50 inches (368 mm) in January 1969, including a record 24-hour rainfall of 6.71 inches (170.4 mm) on January 20 that month. [25][26]
Snowfall inside the city of Los Angeles is rare. The record snowfall occurred on January 19th, 1949, when 3.0 inches (7.6 cm) of snow fell inside city limits, however Burbank reported 4.7 inches. Since official records were first kept in 1877, the downtown Los Angeles weather station observed measurable snowfall three times, in 1882, 1932, and 1949. .[27]
Santa Ana Winds
The Santa Ana winds are strong, extremely dry offshore winds that characteristically sweep across Southern California and northern Baja California during late fall into winter season. They range from hot to cold, depending on the prevailing temperatures in the source region, the Great Basin and upper Mojave Desert. Nevertheless, the winds are notorious for causing hot, dry weather due to compressional heating of the lower atmosphere.
Notable Santa Ana windstorms happen several times a year between fall and spring. Once every several years a strong windstorm causes significant damage, toppling or uprooting large old trees and damaging structures across the region.
Heavy Rains, Landslides, and Debris Flows
While overall precipitation is low, the rain that does fall occasionally comes in brief heavy storms. Combined with steep mountain slopes and recent burn areas from wildfires, these heavy rains often cause landslides and debris flows in foothill areas, damaging structures and blocking roads.
Thunderstorms, Lightning, and Tornadoes
Textbook cumulonimbus-formed summer thunderstorms are fairly rare[28] in Los Angeles, because the atmosphere over the coastal basin is generally too stable and dry, especially during summer, to allow the strong vertical development necessary for mature cumulonimbus clouds. Full, mature thunderstorms can develop in the surrounding deserts and mountains during the summer North American Monsoon, but rarely over the Los Angeles metropolitan region and coastal basin but the moisture is coming off on Gulf of Mexico and Gulf of California. This atmospheric stability is largely due to the cool and persistent marine layer, which is fueled by the constant influx of cold Pacific water via the California Current. Summer thunderstorms that do manage to form on the coastal basin are typically associated with the North American Monsoon and/or tropical cyclones, or downburst winds, which can bring enough tropical heat and moisture to overcome the cool marine layer, destabilizing the atmosphere.
Though still relatively rare, thunderstorms most often occur during warm southerly-flow winter rain storms. These warm storms are different from the typical northwesterly cold fronts that bring most of the region's winter precipitation. Atmospheric instability caused by these warm winter storm systems allows the formation of small, weak, isolated thunderstorms, which tend to move across the area quickly, producing a few rumbles of thunder, and soon dissipate back into the larger rain storm system. Occasionally, these bring impressive displays of lightning, hail, and damaging winds to small localities within the region. Small, weak, isolated tornadoes can occur during these events, but are exceedingly rare. Likewise, weak-to-moderate-strength waterspouts may form over the ocean (typically off the stretch of coast between Long Beach and Huntington Beach) during warm winter storms, but again, this is very rare.
Sea temperatures
The average annual temperature of the sea is 63 °F (17 °C), from 58 °F (14 °C) in January to 68 °F (20 °C) in August.[29]
| Jan | Feb | Mar | Apr | May | Jun | Jul | Aug | Sep | Oct | Nov | Dec | Year |
|---|---|---|---|---|---|---|---|---|---|---|---|---|
| 58 °F (14 °C) | 58 °F (14 °C) | 60 °F (16 °C) | 60 °F (16 °C) | 61 °F (16 °C) | 63 °F (17 °C) | 66 °F (19 °C) | 68 °F (20 °C) | 67 °F (19 °C) | 66 °F (19 °C) | 64 °F (18 °C) | 60 °F (16 °C) | 63 °F (17 °C) |
References
- ↑ {{cite web|url=http://www.wrh.noaa.gov/lox/climate/climate_intro.php
- 1 2 "NowData – NOAA Online Weather Data". National Oceanic and Atmospheric Administration. Retrieved June 7, 2013.
- ↑ "Station Name: CA LOS ANGELES DWTN USC CAMPUS". National Oceanic and Atmospheric Administration. Retrieved 2014-05-09.
- ↑ "LOS ANGELES/WBO CA Climate Normals". National Oceanic and Atmospheric Administration. Retrieved October 20, 2013.
- ↑ {{cite web|urlhttps://www.wrh.noaa.gov/lox/climate/climate_intro.php
- ↑ Rasmussen, Cecilia (2005-03-10). "We're Not in Kansas, but We Do Get Twisters – Los Angeles Times". Articles.latimes.com. Retrieved 2009-01-08.
- ↑ Burt, Christopher. Extreme Weather: A Guide and Record Book. New York: Norton, 2004: 100.
- ↑ "ENSO and California Precipitation" (PDF). California Department of Water Resources. Retrieved 29 April 2016.
- 1 2 "Monitoring & Data: ENSO Impacts on the U.S. – Previous Events". Climate Prediction Center.
- ↑ Lin II, Rong-Gong. "Is El Niño wimping out in Southern California? Not quite". Los Angeles Times.
- ↑ "Dec–Jan–Feb_2015". National Oceanic and Atmospheric Administration – Climate Prediction Center. Retrieved 29 April 2016.
- ↑ "Station Name: CA LOS ANGELES INTL AP". National Oceanic and Atmospheric Administration. Retrieved 2014-05-09.
- ↑ "WMO Climate Normals for LOS ANGELES/INTL, CA 1961–1990". National Oceanic and Atmospheric Administration. Retrieved 2014-04-17.
- ↑ "NCDC: U.S. Climate Normals" (PDF). National Oceanic and Atmospheric Administration.
- ↑ "Climatography of the United States No. 20 (1971–2000) – Culver City, CA" (PDF). National Oceanic and Atmospheric Administration. 2004. Retrieved 2010-07-25.
- ↑ "NOWData – NOAA Online Weather Data". National Oceanic and Atmospheric Administration. Retrieved July 3, 2013.
- ↑ "Climatography of the United States No. 20 (1971–2000) – Canoga Park Pierce Collg, CA" (PDF). National Oceanic and Atmospheric Administration. 2004. Retrieved 2010-06-19.
- ↑ "Average weather for Burbank". Weather.com. Retrieved March 29, 2008.
- ↑ "Monthly averages for Santa Ana, California". Retrieved February 27, 2009.
- ↑ "Monthly averages for Anaheim, California, United States of America". Retrieved 27 February 2009.
- ↑ http://climexp.knmi.nl/data/mgdcnUSC00045115.dat%5Bpermanent+dead+link%5D
- ↑ Los Angeles and San Diego rainfall
- ↑ "LOS ANGELES DWTN USC CAMPUS, CALIFORNIA – Climate Summary". Western Regional Climate Center.
- ↑ "LOS ANGELES INTL AP, CALIFORNIA – Climate Summary". Western Regional Climate Center.
- ↑ "LONG BEACH, CALIFORNIA (045082): Period of Record Monthly Climate Summary". Western Regional Climate Center.
- ↑ "LONG BEACH DAUGHERTY FLD, CALIFORNIA (045085): Period of Record Monthly Climate Summary". Western Regional Climate Center.
- ↑ https://www.kcet.org/shows/lost-la/why-hasnt-it-snowed-in-los-angeles-since-1962. Missing or empty
|title=(help) - ↑ "Rare Southern California summer storm breaks regional rainfall records". Fox News. Associated Press. 19 July 2015.
- 1 2 "Pacific Ocean Temperatures on California Coast" – beachcalifornia.com