Climate of Puerto Rico
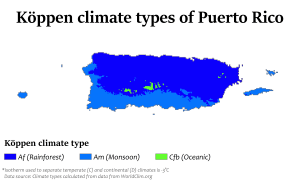
The climate of Puerto Rico in the Köppen climate classification is predominately tropical rainforest. Temperatures throughout the year are warm to hot, averaging near 85 °F (29 °C) in lower elevations and 70 °F (21 °C) in the mountains. Easterly trade winds pass across the island year round while the rainy season stretches from April into November.[1] The relatively cool trade winds are blocked by the mountains of the Cordillera Central which causes rain shadows and sharp variations in the temperature and wind speed over short distances. About a quarter of the average annual rainfall for Puerto Rico occurs during tropical cyclones, which are more frequent during La Niña years.
Temperature
Temperatures range from 70 to 90 °F (21 to 32 °C) in the lower elevations, while higher elevations in the central part of the island experience temperatures between 61 and 80 °F (16 and 27 °C) year round. The temperature in the south is a few degrees higher than the north. Between winter and summer, there is only a temperature swing of around 6 °F (3.3 °C). Coastal water temperatures average between 77 °F in February to 87 °F in August. The highest temperature ever recorded was 103 °F (39 °C) at San Lorenzo, while the lowest temperature ever recorded was 38 °F (3 °C) at Aibonito.
| Climate data for Adjuntas Substation. Elevation: 1,720 feet (520 m). | |||||||||||||
|---|---|---|---|---|---|---|---|---|---|---|---|---|---|
| Month | Jan | Feb | Mar | Apr | May | Jun | Jul | Aug | Sep | Oct | Nov | Dec | Year |
| Average high °F (°C) | 77 (25) |
78 (26) |
81 (27) |
81 (27) |
83 (28) |
84 (29) |
85 (29) |
85 (29) |
85 (29) |
84 (29) |
82 (28) |
80 (27) |
82 (28) |
| Average low °F (°C) | 55 (13) |
54 (12) |
55 (13) |
60 (16) |
66 (19) |
68 (20) |
69 (21) |
69 (21) |
69 (21) |
66 (19) |
60 (16) |
57 (14) |
62 (17) |
| Source: Southeast Regional Climate Center [2] | |||||||||||||
| Climate data for Aibonito. Elevation 2,320 feet (710 m). | |||||||||||||
|---|---|---|---|---|---|---|---|---|---|---|---|---|---|
| Month | Jan | Feb | Mar | Apr | May | Jun | Jul | Aug | Sep | Oct | Nov | Dec | Year |
| Average high °F (°C) | 74 (23) |
75 (24) |
77 (25) |
78 (26) |
79 (26) |
80 (27) |
81 (27) |
81 (27) |
81 (27) |
80 (27) |
78 (26) |
75 (24) |
78 (26) |
| Average low °F (°C) | 59 (15) |
59 (15) |
61 (16) |
63 (17) |
65 (18) |
66 (19) |
67 (19) |
67 (19) |
67 (19) |
66 (19) |
65 (18) |
63 (17) |
64 (18) |
| Source: Southeast Regional Climate Center [2] | |||||||||||||
| Climate data for Cerro Maravilla. Elevation: 3,950 feet (1,200 m). | |||||||||||||
|---|---|---|---|---|---|---|---|---|---|---|---|---|---|
| Month | Jan | Feb | Mar | Apr | May | Jun | Jul | Aug | Sep | Oct | Nov | Dec | Year |
| Average high °F (°C) | 65 (18) |
67 (19) |
69 (21) |
69 (21) |
71 (22) |
73 (23) |
75 (24) |
75 (24) |
73 (23) |
72 (22) |
71 (22) |
68 (20) |
71 (22) |
| Average low °F (°C) | 45 (7) |
45 (7) |
49 (9) |
55 (13) |
59 (15) |
61 (16) |
62 (17) |
62 (17) |
61 (16) |
61 (16) |
59 (15) |
50 (10) |
56 (13) |
| Source: Southeast Regional Climate Center [2] | |||||||||||||
| Climate data for Lajas Substation. Elevation 120 feet (37 m). | |||||||||||||
|---|---|---|---|---|---|---|---|---|---|---|---|---|---|
| Month | Jan | Feb | Mar | Apr | May | Jun | Jul | Aug | Sep | Oct | Nov | Dec | Year |
| Average high °F (°C) | 84 (29) |
86 (30) |
87 (31) |
88 (31) |
89 (32) |
91 (33) |
92 (33) |
93 (34) |
93 (34) |
90 (32) |
89 (32) |
87 (31) |
89 (32) |
| Average low °F (°C) | 60 (16) |
61 (16) |
62 (17) |
65 (18) |
70 (21) |
72 (22) |
74 (23) |
75 (24) |
74 (23) |
71 (22) |
66 (19) |
62 (17) |
68 (20) |
| Source: Southeast Regional Climate Center [2] | |||||||||||||
| Climate data for Ponce 4 E. 40 feet (12 m). | |||||||||||||
|---|---|---|---|---|---|---|---|---|---|---|---|---|---|
| Month | Jan | Feb | Mar | Apr | May | Jun | Jul | Aug | Sep | Oct | Nov | Dec | Year |
| Average high °F (°C) | 86 (30) |
86 (30) |
87 (31) |
87 (31) |
88 (31) |
90 (32) |
90 (32) |
91 (33) |
90 (32) |
89 (32) |
88 (31) |
87 (31) |
88 (31) |
| Average low °F (°C) | 67 (19) |
66 (19) |
67 (19) |
69 (21) |
72 (22) |
74 (23) |
74 (23) |
73 (23) |
73 (23) |
72 (22) |
70 (21) |
68 (20) |
70 (21) |
| Source: Southeast Regional Climate Center [2] | |||||||||||||
Temperature records
| Climate data for Puerto Rico | |||||||||||||
|---|---|---|---|---|---|---|---|---|---|---|---|---|---|
| Month | Jan | Feb | Mar | Apr | May | Jun | Jul | Aug | Sep | Oct | Nov | Dec | Year |
| Record high °F (°C) | 98.1 (36.7) |
99.7 (37.6) |
99.5 (37.5) |
102.6 (39.2) |
104 (40.0) |
102.9 (39.4) |
104.7 (40.4) |
104 (40.0) |
103.1 (39.5) |
104.5 (40.3) |
98.6 (37.0) |
97 (36.1) |
104.7 (40.4) |
| Record low °F (°C) | 39.7 (4.3) |
39.6 (4.2) |
37.4 (3.0) |
43.2 (6.2) |
49.3 (9.6) |
50 (10.0) |
55.4 (13.0) |
55.6 (13.1) |
48.7 (9.3) |
45.9 (7.7) |
41.9 (5.5) |
40.1 (4.5) |
37.4 (3.0) |
| Source #1: Pogoda.ru.net - Climate Monitor[3] — Meteo.ru - Baseline Climatological Data Sets[4] | |||||||||||||
| Source #2: NOAA NCDC - Climate Data Online[5] | |||||||||||||
Climate data
| Climate data for San Juan Marin Int'l, Puerto Rico (1981–2010 normals, extremes 1898–present)[lower-alpha 1] | |||||||||||||
|---|---|---|---|---|---|---|---|---|---|---|---|---|---|
| Month | Jan | Feb | Mar | Apr | May | Jun | Jul | Aug | Sep | Oct | Nov | Dec | Year |
| Record high °F (°C) | 92 (33) |
96 (36) |
96 (36) |
97 (36) |
96 (36) |
97 (36) |
95 (35) |
97 (36) |
97 (36) |
98 (37) |
96 (36) |
94 (34) |
98 (37) |
| Mean maximum °F (°C) | 87.5 (30.8) |
88.2 (31.2) |
90.2 (32.3) |
91.8 (33.2) |
92.7 (33.7) |
92.9 (33.8) |
92.3 (33.5) |
92.7 (33.7) |
93.5 (34.2) |
92.8 (33.8) |
90.3 (32.4) |
87.7 (30.9) |
94.7 (34.8) |
| Average high °F (°C) | 83.2 (28.4) |
83.7 (28.7) |
84.9 (29.4) |
86.2 (30.1) |
87.5 (30.8) |
88.9 (31.6) |
88.7 (31.5) |
89.2 (31.8) |
89.2 (31.8) |
88.4 (31.3) |
85.9 (29.9) |
83.9 (28.8) |
86.6 (30.3) |
| Daily mean °F (°C) | 77.6 (25.3) |
77.9 (25.5) |
78.9 (26.1) |
80.3 (26.8) |
81.9 (27.7) |
83.3 (28.5) |
83.4 (28.6) |
83.7 (28.7) |
83.5 (28.6) |
82.6 (28.1) |
80.6 (27) |
78.7 (25.9) |
81 (27.2) |
| Average low °F (°C) | 72.0 (22.2) |
72.0 (22.2) |
72.9 (22.7) |
74.4 (23.6) |
76.3 (24.6) |
77.7 (25.4) |
78.1 (25.6) |
78.2 (25.7) |
77.8 (25.4) |
76.9 (24.9) |
75.2 (24) |
73.4 (23) |
75.4 (24.1) |
| Mean minimum °F (°C) | 67.1 (19.5) |
67.8 (19.9) |
68.5 (20.3) |
70.0 (21.1) |
71.8 (22.1) |
73.6 (23.1) |
73.6 (23.1) |
74.0 (23.3) |
73.7 (23.2) |
73.0 (22.8) |
70.9 (21.6) |
68.9 (20.5) |
66.7 (19.3) |
| Record low °F (°C) | 61 (16) |
62 (17) |
60 (16) |
64 (18) |
66 (19) |
66 (19) |
69 (21) |
68 (20) |
69 (21) |
67 (19) |
65 (18) |
62 (17) |
60 (16) |
| Average rainfall inches (mm) | 3.76 (95.5) |
2.39 (60.7) |
1.95 (49.5) |
4.68 (118.9) |
5.90 (149.9) |
4.41 (112) |
5.07 (128.8) |
5.46 (138.7) |
5.77 (146.6) |
5.59 (142) |
6.35 (161.3) |
5.02 (127.5) |
56.35 (1,431.3) |
| Average rainy days (≥ 0.01 in) | 17.6 | 13.9 | 12.2 | 13.3 | 15.7 | 14.4 | 18.6 | 18.5 | 17.4 | 17.7 | 19.6 | 19.6 | 198.5 |
| Average relative humidity (%) | 74.0 | 72.4 | 71.0 | 71.3 | 74.9 | 75.5 | 75.9 | 76.4 | 76.4 | 76.9 | 76.2 | 74.7 | 74.6 |
| Mean monthly sunshine hours | 237.4 | 231.2 | 282.0 | 268.3 | 255.2 | 259.4 | 280.8 | 267.8 | 234.7 | 227.2 | 202.4 | 217.4 | 2,963.8 |
| Percent possible sunshine | 69 | 72 | 76 | 71 | 63 | 65 | 69 | 68 | 64 | 63 | 60 | 64 | 67 |
| Source: NOAA (relative humidity and sun 1961–1990)[7][8][9], The Weather Channel[10] | |||||||||||||
Wind
Persistent 19-knot (35 km/h; 22 mph) trade winds move from east to west across the island year round. When the trades winds are lighter, sea breeze and land breeze circulations dominate.[11] Every five years or so a hurricane brings high intensity wind.[12]
Rainfall
There is a pronounced rainy season from April to November. Due to the island's topography, rainfall varies greatly across the island. Pico del Este averages 171.09 inches (4,346 mm) of rainfall yearly while Magueyes Island averages only 29.32 inches (745 mm) a year.[13][14]
Severe weather
| Precipitation | Storm | Location | Ref. | ||
|---|---|---|---|---|---|
| Rank | mm | in | |||
| 1 | 1,058.7 | 41.68 | T. D. #15 (1970) | Jayuya 1 SE | [15] |
| 2 | 962.7 | 37.90 | Maria 2017 | Caguas | [16] |
| 3 | 845.6 | 33.29 | Eloise 1975 | Dos Bocas | [15] |
| 4 | 804.4 | 31.67 | Isabel 1985 | Toro Negro Forest | [17] |
| 5 | 775.0 | 30.51 | Georges 1998 | Jayuya | [15] |
| 6 | 662.2 | 26.07 | Hazel 1954 | Toro Negro Tunnel | [18] |
| 7 | 652.5 | 25.69 | Klaus 1984 | Guavate Camp | [15] |
| 8 | 596.4 | 23.48 | Hortense 1996 | Cayey 1 NW | [15] |
| 9 | 584.2 | 23.00 | 1899 San Ciriaco hurricane | Adjuntas | [19] |
| 10 | 560.1 | 22.05 | Irene 2011 | Gurabo Abajo | [20] |
- Puerto Rico experiences the Atlantic hurricane season, similar to the remainder of the Caribbean Sea and North Atlantic oceans. On average, a quarter of its annual rainfall is contributed from tropical cyclones, which is more prevalent during periods of La Niña than El Niño.[21] A cyclone of tropical storm strength passes near Puerto Rico, on average, every 5 years.[12] A hurricane passes in the vicinity of the island, on average, every 11 years. Only two Category 5 hurricanes have struck the island since 1851, the Lake Okeechobee Hurricane of September 1928, and Hurricane Irma of September 2017.[22]
- Sometimes waterspouts form off the coast during showers and thunderstorms, particularly off the west coast, with tornadoes and hailstorms possible in the inner sea. These thunderstorms may be formed due to tropical waves, tropical cyclones, and frontal boundaries which become stationary across the region between fall and spring.
- In September 2017, Puerto Rico was hit by Category 5 Hurricane Irma, which had maximum sustained winds of 300 km/h (185 mph). While the eye itself stayed offshore, the eye-wall skirted the island's northeastern portion, including the population centre of San Juan. Nearly 70% of the island lost power from the hurricane, and Irma was by far the costliest hurricane to hit the island. Recovery efforts immediately after the storm were slowed due to lack of funding, along with hurricanes Jose and Maria which hit the island with rains and Category 4 winds 2 weeks later.
- Hurricane Maria exacerbated the humanitarian crisis caused by Irma. Although the winds were significantly less catastrophic, Maria brought torrential rainfall to the island, flooding streets and cutting of several smaller villages from road transportation.
Weather by season
The Wet Season begins in May and lasts to late October. The weather is hot and humid with thunderstorms in the afternoon, especially in August and September. Trade winds bring cool summer breezes in the north and east of Puerto Rico, but due to the topography of the island, these winds do not reach the coast south and west, causing much higher temperatures than in the north. During humid summer days, the heat index can reach 115 °F (47 °C) and actual temperatures can reach 100 °F (38 °C). Sometimes the wind shifts from the south, causing an inverse pattern, where the heat south of the island moves to the north, causing temperatures in the mid 90s (35 °C) in San Juan and low humidity. The month of June is usually the driest month of the summer. During June and July the precipitation is mostly caused by the effects of humidity and heat of the island. The peak of the hurricane season comes in September. Weather conditions can be very rainy as tropical lows pass near the island, with frequent strong thunderstorms. By early November the tropical cyclone season fades and the weather becomes drier and generally sunny.
Late November brings the Dry Season which lasts through late April. Weakening cool fronts from the north lower temperatures and humidity, and dry and sunny conditions prevail. In San Juan in the winter months, high temperatures reach 77–87 °F (25–30 °C) with an average high of 83 °F and lows down to 66–76 °F (19–24 °C), giving an average of 71 °F (22 °C). In the central area of the island the elevation and reduced sea effects bring the minimum temperatures to 55–65 °F (13–18 °C) on average. After fronts pass the temperature may drop to the 40s (4–9 °C) in the mountains, in the 50s (10–15 °C) in the valleys, and in the low 60s (16 °C to 20 °C) in the coastal zone. In general the climate in the dry season is sunny, with little change from day to day. February and March are often quite dry, sunny and hot.
Sun
The sunrise varies from 5:30 a.m. in summer and 7:00 a.m. in winter. Sunset varies between 5:40 p.m. in winter and 7:10 p.m. in summer. Puerto Rico does not use daylight saving time. The ultraviolet index or UV index varies from 10+ in the summer and a maximum of 7 in winter.
See also
Notes
References
- ↑ Matt Carter and J.B. Elsner. Monthly Rainfall Climatology for Puerto Rico. Retrieved on January 24, 2008.
- 1 2 3 4 5 "Historical Climate Data For Puerto Rico". Retrieved January 23, 2008.
- ↑ "Pogoda.ru.net" (in Russian). Retrieved May 7, 2013.
- ↑ "Meteo.ru". Retrieved May 7, 2013.
- ↑ "NOAA NCDC Climate Data Online". Retrieved May 7, 2013.
- ↑ ThreadEx
- ↑ "NOWData - NOAA Online Weather Data". National Oceanic and Atmospheric Administration. Retrieved June 27, 2013.
- ↑ "Station Name: SAN JUAN L M MARIN AP". National Oceanic and Atmospheric Administration. Retrieved 2014-05-13.
- ↑ "WMO Climate Normals for SAN JUAN/ISLA VERDE INT'L ARP,PR 1961–1990". National Oceanic and Atmospheric Administration. Retrieved 2014-03-10.
- ↑ "Monthly Averages for San Juan, PR – Temperature and Precipitation". The Weather Channel. Retrieved 2011-04-16.
- ↑ Shawn P. Bennett, Vanda Grusbisic, and Roy M. Rasmussen. GRAVITY WAVES, RAINBANDS, AND DEEP CONVECTION INDUCED BY TRADE WIND FLOW PAST PUERTO RICO. Retrieved on January 24, 2008.
- 1 2 Alexa J. Andrews. Spatial and Temporal Variability of Tropical Storm and Hurricane Strikes in the Bahamas, and the Greater and Lesser Antilles. Retrieved on 2007-01-23.
- ↑ Southern Region Climate Center. Pico del Este Climatology. Retrieved on January 23, 2008.
- ↑ Southern Region Climate Center. Magueyes Island Climatology. Retrieved on January 23, 2008.
- 1 2 3 4 5 Roth, David M. (October 18, 2017). "Tropical Cyclone Point Maxima". Tropical Cyclone Rainfall Data. United States Weather Prediction Center. Retrieved November 26, 2017.
- ↑ "Hurricane Maria Live Updates: In Puerto Rico, the Storm 'Destroyed Us'". The New York Times. Retrieved 22 September 2017.
- ↑ Roth, David M (June 27, 2007). "Tropical Storm Isabel – October 4 – 16, 1985". United States Weather Prediction Center. Retrieved May 1, 2012.
- ↑ Higgs, Ralph L (1954). "Severe Floods of October 12–15, 1954 in Puerto Rico" (PDF). Monthly Weather Review. American Meteorological Society. 82 (10): 301. doi:10.1175/1520-0493(1954)082<0301:SFOOIP>2.0.CO;2. ISSN 1520-0493. Retrieved January 8, 2008.
- ↑ Geddings, R. M (August 1899), Climatological Data, Puerto Rico
- ↑ Avila, Lixion A; Cangialosi, John P (December 14, 2011). Hurricane Irene (PDF) (Tropical Cyclone Report). United States National Hurricane Center. p. 14. Retrieved June 2, 2012.
- ↑ Edward B. Rodgers, Robert F. Adler, Harold F. Pierce. Contribution of Tropical Cyclones to the North Atlantic Climatological Rainfall as Observed from Satellites.
- ↑ Aurelio Mercado and Harry Justiniano. Coastal Hazards of Puerto Rico. Retrieved on January 23, 2008.