Climate of New Jersey

The climate of New Jersey can be described as a humid continental climate with most of the state falling under the Dfa classification on the Köppen climate classification. The extreme northwest areas of the state are classified as Dfb since they are slightly cooler and only the extreme southeastern areas of the state are classified as a humid subtropical climate (Cfa).[1] New Jersey's climate is vastly affected by its proximity to the Atlantic Ocean which provides moisture and moderates temperatures.[2]
Temperature

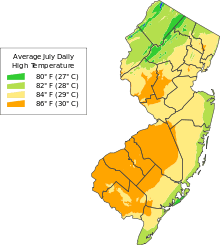
Temperatures are usually coolest in the northwestern part of the state and warmest in the southern part of the state. The temperature difference is greatest in the winter and the least in the summer. All parts of the state have recorded temperatures below 0 degrees and in excess of 100 degrees. The average number of freeze free days ranges from 163 days in the highlands to 217 along the coast.[3] The highest recorded temperature in the state of New Jersey was 110° on July 10, 1936 in Runyon and the lowest was -34° in River Vale on January 5, 1904. [4]
Precipitation
The average annual precipitation ranges from 40 inches along the southeastern coast to around 51 inches in the north-central part of the state. The driest season is usually autumn which has an average of 8 days per month with measurable precipitation. During other seasons the average month has between 9 and 12 days of precipitation. Most areas receive between 25-30 thunderstorms a year. While tornadoes are possible, they tend to be rare and weak. There are usually about 5 tornadoes reported each year statewide.[3] The greatest 24-hour rainfall was 14.81 inches which occurred in Tuckerton on August 19 - 20, 1939[4]
Snowfall
Snow typically occurs between October 15- April 30 in the highlands and November 15-April 15 in the southern part of the state. [3] The record for 24-hour snowfall is 32 inches in Rutherford on December 14, 1915. The greatest snow depth ever recorded was 52 inches at the Canistear Reservoir in Vernon Township on February 5, 1961[4]
Climate data for select cities
| Climate data for Atlantic City, New Jersey (downtown), 1981–2010 normals,[lower-alpha 1] extremes 1874–present[lower-alpha 2] | |||||||||||||
|---|---|---|---|---|---|---|---|---|---|---|---|---|---|
| Month | Jan | Feb | Mar | Apr | May | Jun | Jul | Aug | Sep | Oct | Nov | Dec | Year |
| Record high °F (°C) | 72 (22) |
77 (25) |
84 (29) |
91 (33) |
95 (35) |
99 (37) |
102 (39) |
104 (40) |
94 (34) |
91 (33) |
80 (27) |
74 (23) |
104 (40) |
| Mean maximum °F (°C) | 59.3 (15.2) |
59.9 (15.5) |
68.4 (20.2) |
77.3 (25.2) |
83.7 (28.7) |
89.7 (32.1) |
93.5 (34.2) |
91.8 (33.2) |
86.3 (30.2) |
78.9 (26.1) |
70.1 (21.2) |
62.4 (16.9) |
95.3 (35.2) |
| Average high °F (°C) | 41.8 (5.4) |
43.5 (6.4) |
49.6 (9.8) |
57.6 (14.2) |
66.6 (19.2) |
75.7 (24.3) |
81.3 (27.4) |
80.2 (26.8) |
74.8 (23.8) |
65.0 (18.3) |
55.8 (13.2) |
46.3 (7.9) |
61.6 (16.4) |
| Average low °F (°C) | 29.2 (−1.6) |
30.9 (−0.6) |
36.9 (2.7) |
45.5 (7.5) |
54.5 (12.5) |
64.3 (17.9) |
70.0 (21.1) |
69.7 (20.9) |
63.5 (17.5) |
52.5 (11.4) |
42.9 (6.1) |
33.5 (0.8) |
49.5 (9.7) |
| Mean minimum °F (°C) | 11.3 (−11.5) |
16.3 (−8.7) |
22.4 (−5.3) |
33.8 (1) |
44.3 (6.8) |
53.7 (12.1) |
61.4 (16.3) |
60.1 (15.6) |
50.5 (10.3) |
39.2 (4) |
29.0 (−1.7) |
19.0 (−7.2) |
10.1 (−12.2) |
| Record low °F (°C) | −4 (−20) |
−9 (−23) |
8 (−13) |
15 (−9) |
33 (1) |
45 (7) |
52 (11) |
48 (9) |
37 (3) |
27 (−3) |
10 (−12) |
−7 (−22) |
−9 (−23) |
| Average precipitation inches (mm) | 3.08 (78.2) |
2.87 (72.9) |
4.02 (102.1) |
3.39 (86.1) |
3.22 (81.8) |
2.68 (68.1) |
3.31 (84.1) |
3.92 (99.6) |
3.08 (78.2) |
3.47 (88.1) |
3.35 (85.1) |
3.62 (91.9) |
40.01 (1,016.2) |
| Average snowfall inches (cm) | 4.5 (11.4) |
6.7 (17) |
1.1 (2.8) |
0.3 (0.8) |
0 (0) |
0 (0) |
0 (0) |
0 (0) |
0 (0) |
0 (0) |
0.2 (0.5) |
3.7 (9.4) |
16.5 (41.9) |
| Average precipitation days (≥ 0.01 in) | 9.3 | 9.0 | 10.5 | 10.9 | 10.4 | 8.7 | 8.4 | 8.0 | 7.7 | 7.6 | 8.9 | 10.4 | 109.8 |
| Average snowy days (≥ 0.1 in) | 2.9 | 2.8 | 0.9 | 0.3 | 0 | 0 | 0 | 0 | 0 | 0 | 0.1 | 1.7 | 8.7 |
| Average relative humidity (%) | 69.5 | 69.0 | 66.9 | 66.4 | 70.7 | 72.9 | 73.9 | 75.7 | 76.4 | 74.8 | 72.8 | 70.6 | 71.6 |
| Mean monthly sunshine hours | 150.8 | 157.9 | 204.5 | 218.9 | 243.9 | 266.2 | 276.3 | 271.3 | 227.6 | 200.5 | 147.4 | 133.8 | 2,499.1 |
| Percent possible sunshine | 50 | 53 | 55 | 55 | 55 | 60 | 61 | 64 | 61 | 58 | 49 | 46 | 56 |
| Source: NOAA (relative humidity and sun 1961–1990 and snow at Atlantic City Int'l)[6][7][8][9] | |||||||||||||
| Climate data for Newark, New Jersey (Newark Liberty Int'l) | |||||||||||||
|---|---|---|---|---|---|---|---|---|---|---|---|---|---|
| Month | Jan | Feb | Mar | Apr | May | Jun | Jul | Aug | Sep | Oct | Nov | Dec | Year |
| Record high °F (°C) | 74 (23) |
80 (27) |
89 (32) |
97 (36) |
99 (37) |
102 (39) |
108 (42) |
105 (41) |
105 (41) |
93 (34) |
85 (29) |
76 (24) |
108 (42) |
| Mean maximum °F (°C) | 60.2 (15.7) |
62.2 (16.8) |
73.3 (22.9) |
84.1 (28.9) |
90.8 (32.7) |
95.7 (35.4) |
98.1 (36.7) |
95.7 (35.4) |
90.5 (32.5) |
81.0 (27.2) |
72.6 (22.6) |
62.9 (17.2) |
99.6 (37.6) |
| Average high °F (°C) | 38.8 (3.8) |
42.3 (5.7) |
50.7 (10.4) |
62.0 (16.7) |
72.1 (22.3) |
81.5 (27.5) |
86.0 (30) |
84.0 (28.9) |
76.7 (24.8) |
65.3 (18.5) |
54.6 (12.6) |
43.5 (6.4) |
63.1 (17.3) |
| Daily mean °F (°C) | 31.6 (−0.2) |
34.6 (1.4) |
42.1 (5.6) |
52.8 (11.6) |
62.7 (17.1) |
72.4 (22.4) |
77.4 (25.2) |
75.8 (24.3) |
68.2 (20.1) |
56.6 (13.7) |
46.8 (8.2) |
36.5 (2.5) |
54.8 (12.7) |
| Average low °F (°C) | 24.5 (−4.2) |
26.9 (−2.8) |
33.6 (0.9) |
43.7 (6.5) |
53.3 (11.8) |
63.3 (17.4) |
68.7 (20.4) |
67.5 (19.7) |
59.7 (15.4) |
48.0 (8.9) |
39.0 (3.9) |
29.6 (−1.3) |
46.5 (8.1) |
| Mean minimum °F (°C) | 7.8 (−13.4) |
11.8 (−11.2) |
17.9 (−7.8) |
31.8 (−0.1) |
42.4 (5.8) |
52.4 (11.3) |
60.5 (15.8) |
57.8 (14.3) |
47.2 (8.4) |
36.0 (2.2) |
25.9 (−3.4) |
14.6 (−9.7) |
5.6 (−14.7) |
| Record low °F (°C) | −8 (−22) |
−14 (−26) |
6 (−14) |
16 (−9) |
33 (1) |
41 (5) |
51 (11) |
45 (7) |
35 (2) |
25 (−4) |
12 (−11) |
−8 (−22) |
−14 (−26) |
| Average precipitation inches (mm) | 3.53 (89.7) |
2.88 (73.2) |
4.18 (106.2) |
4.20 (106.7) |
4.09 (103.9) |
4.02 (102.1) |
4.76 (120.9) |
3.70 (94) |
3.82 (97) |
3.60 (91.4) |
3.65 (92.7) |
3.80 (96.5) |
46.24 (1,174.5) |
| Average snowfall inches (cm) | 8.9 (22.6) |
9.5 (24.1) |
4.4 (11.2) |
.9 (2.3) |
0 (0) |
0 (0) |
0 (0) |
0 (0) |
0 (0) |
0 (0) |
.4 (1) |
5.4 (13.7) |
29.5 (74.9) |
| Average precipitation days (≥ 0.01 in) | 10.4 | 9.8 | 11.0 | 11.5 | 11.3 | 11.0 | 10.1 | 9.7 | 8.6 | 8.7 | 9.5 | 10.6 | 122.1 |
| Average snowy days (≥ 0.1 in) | 5.0 | 3.7 | 2.4 | .4 | 0 | 0 | 0 | 0 | 0 | 0 | .4 | 2.9 | 14.7 |
| Source: NOAA (normals 1981–2010, extremes 1931–present)[8][10] | |||||||||||||
| Climate data for Trenton, New Jersey (1981–2010 normals) | |||||||||||||
|---|---|---|---|---|---|---|---|---|---|---|---|---|---|
| Month | Jan | Feb | Mar | Apr | May | Jun | Jul | Aug | Sep | Oct | Nov | Dec | Year |
| Record high °F (°C) | 73 (23) |
76 (24) |
87 (31) |
93 (34) |
99 (37) |
100 (38) |
106 (41) |
105 (41) |
101 (38) |
94 (34) |
83 (28) |
76 (24) |
106 (41) |
| Average high °F (°C) | 39.0 (3.9) |
42.2 (5.7) |
50.9 (10.5) |
61.4 (16.3) |
71.8 (22.1) |
80.8 (27.1) |
85.3 (29.6) |
83.6 (28.7) |
76.1 (24.5) |
65.0 (18.3) |
54.5 (12.5) |
43.1 (6.2) |
62.9 (17.2) |
| Daily mean °F (°C) | 31.1 (−0.5) |
34.0 (1.1) |
41.4 (5.2) |
51.2 (10.7) |
61.1 (16.2) |
70.5 (21.4) |
75.7 (24.3) |
73.9 (23.3) |
66.2 (19) |
54.6 (12.6) |
45.7 (7.6) |
35.3 (1.8) |
53.4 (11.9) |
| Average low °F (°C) | 23.2 (−4.9) |
25.8 (−3.4) |
31.9 (−0.1) |
41.0 (5) |
50.5 (10.3) |
60.3 (15.7) |
66.0 (18.9) |
64.2 (17.9) |
56.4 (13.6) |
44.2 (6.8) |
36.9 (2.7) |
27.6 (−2.4) |
44.1 (6.7) |
| Record low °F (°C) | −13 (−25) |
−14 (−26) |
1 (−17) |
11 (−12) |
33 (1) |
41 (5) |
48 (9) |
41 (5) |
31 (−1) |
22 (−6) |
12 (−11) |
−7 (−22) |
−14 (−26) |
| Average precipitation inches (mm) | 3.16 (80.3) |
2.31 (58.7) |
4.14 (105.2) |
3.54 (89.9) |
4.37 (111) |
4.41 (112) |
4.95 (125.7) |
4.10 (104.1) |
4.27 (108.5) |
4.18 (106.2) |
3.31 (84.1) |
3.70 (94) |
46.44 (1,179.7) |
| Mean monthly sunshine hours | 163.1 | 169.7 | 207.4 | 227.2 | 248.1 | 262.8 | 269.2 | 252.5 | 215.0 | 201.5 | 149.3 | 140.1 | 2,505.9 |
| Percent possible sunshine | 54 | 57 | 56 | 57 | 56 | 58 | 59 | 59 | 57 | 58 | 50 | 48 | 56 |
| Source: NOAA (sun 1961–1981)[11][12][13] | |||||||||||||
References
- ↑ "Koppen Climate Classification for the Conterminous United States". Data.gov. U.S. General Services Administration. Retrieved 7 January 2018.
- ↑ Harris, Amy. "The Average Climate of New Jersey". USA Today. Retrieved 7 January 2018.
- 1 2 3 "New Jersey Climate Overview". Rutgers, The State University of New Jersey. Retrieved 7 January 2018.
- 1 2 3 "State Climate Extremes Committee (SCEC) Records". The National Weather Service. Retrieved 7 January 2018.
- ↑ Threadex
- ↑ "Station Name: NJ ATLANTIC CITY". National Oceanic and Atmospheric Administration. Retrieved March 30, 2013.
- ↑ "Station Name: NJ ATLANTIC CITY INTL AP". National Oceanic and Atmospheric Administration. Retrieved 2014-03-14.
- 1 2 NowData – NOAA Online Weather Data, National Oceanic and Atmospheric Administration. Accessed February 22, 2018
- ↑ "WMO Climate Normals for ATLANTIC CITY, NJ 1961–1990". National Oceanic and Atmospheric Administration. Retrieved 2014-03-11.
- ↑ Station Name: NJ NEWARK INTL AP, National Oceanic and Atmospheric Administration. Accessed March 2, 2013.
- ↑ Station Name: NJ TRENTON MERCER CO AP, National Oceanic and Atmospheric Administration. Accessed February 28, 2013.
- ↑ "WMO Climate Normals for Trenton/WSO City, NJ 1961–1990". NOAA.
- ↑ NOWData – NOAA Online Weather Data, National Oceanic and Atmospheric Administration. Accessed January 14, 2015.
Notes
- ↑ Mean monthly maxima and minima (i.e. the highest and lowest temperature readings during an entire month or year) calculated based on data at said location from 1981 to 2010.
- ↑ The official climatology station for Atlantic City was at the Weather Bureau Office downtown from January 1874 to 15 June 1958 and Atlantic City Int'l (ACY) in Egg Harbor Township since 16 June 1958.[5] ACY's location in the Pine Barrens and distance away from the coast and urban heat island of downtown Atlantic City largely account for its markedly colder temperatures at night as compared to downtown; for example, from 1959 to 2013, there were 50 days with a low of 0 °F (−18 °C) or lower, while in the same period, the corresponding number of days at downtown was 2. The National Weather Service ceased regular snowfall observations at downtown after the winter of 1958–59.