Climate of Mumbai
| Mumbai | ||||||||||||||||||||||||||||||||||||||||||||||||||||||||||||
|---|---|---|---|---|---|---|---|---|---|---|---|---|---|---|---|---|---|---|---|---|---|---|---|---|---|---|---|---|---|---|---|---|---|---|---|---|---|---|---|---|---|---|---|---|---|---|---|---|---|---|---|---|---|---|---|---|---|---|---|---|
| Climate chart (explanation) | ||||||||||||||||||||||||||||||||||||||||||||||||||||||||||||
| ||||||||||||||||||||||||||||||||||||||||||||||||||||||||||||
| ||||||||||||||||||||||||||||||||||||||||||||||||||||||||||||
The Climate of Mumbai is a tropical wet and dry climate. Mumbai's climate can be best described as moderately hot with high level of humidity. Its coastal nature and tropical location ensures temperatures won't fluctuate much throughout the year.
The mean average is 27.2 °C and average precipitation is 242.2 cm (95.35 inches).[1] The mean maximum average temperatures is about 32 °C (90 °F) in summer and 30 °C (86 °F) in winter, while the average minimums are 25 °C (77 °F) in summer and 20.5 °C (68.9 °F) in winter. Mumbai experiences three distinct seasons: 1. Winter (Nov to Feb or mid March) winter temperature 15 to 23 degree C Peak Winter Months - Dec to Mid Feb with temperature range 12-19 Deg C; 2. Summer (Feb/March to mid June and Sept to Nov) Avg temperature 30 to 27 Deg. C; Peak Summer Months (Mid March to June 1 week), temperature shoots up to 30 - 40 Deg. C with humidity being approx 70-80%. 3.Monsoon: (June to August, at times until October). Peak monsoon months: July & August sometimes with winds and thunderstorms. Temperatures at 24-29 Deg C.
Climate data for Mumbai
| Climate data for Mumbai (Chhatrapati Shivaji International Airport) 1981–2010 | |||||||||||||
|---|---|---|---|---|---|---|---|---|---|---|---|---|---|
| Month | Jan | Feb | Mar | Apr | May | Jun | Jul | Aug | Sep | Oct | Nov | Dec | Year |
| Record high °C (°F) | 37.1 (98.8) |
39.6 (103.3) |
41.7 (107.1) |
42.2 (108) |
41.0 (105.8) |
37.1 (98.8) |
34.8 (94.6) |
33.5 (92.3) |
36.4 (97.5) |
37.9 (100.2) |
37.4 (99.3) |
39.8 (103.6) |
42.2 (108) |
| Average high °C (°F) | 31.1 (88) |
31.3 (88.3) |
32.8 (91) |
33.2 (91.8) |
33.6 (92.5) |
32.4 (90.3) |
30.4 (86.7) |
30.0 (86) |
30.7 (87.3) |
33.4 (92.1) |
33.7 (92.7) |
32.4 (90.3) |
32.1 (89.8) |
| Average low °C (°F) | 17.3 (63.1) |
18.2 (64.8) |
21.4 (70.5) |
24.2 (75.6) |
27.0 (80.6) |
26.6 (79.9) |
25.5 (77.9) |
25.1 (77.2) |
24.8 (76.6) |
23.8 (74.8) |
21.3 (70.3) |
18.5 (65.3) |
22.8 (73) |
| Record low °C (°F) | 7.4 (45.3) |
8.5 (47.3) |
13.8 (56.8) |
16.9 (62.4) |
20.2 (68.4) |
19.8 (67.6) |
21.2 (70.2) |
19.4 (66.9) |
20.7 (69.3) |
16.7 (62.1) |
13.3 (55.9) |
10.6 (51.1) |
7.4 (45.3) |
| Average rainfall mm (inches) | 0.3 (0.012) |
0.4 (0.016) |
0.0 (0) |
0.1 (0.004) |
11.3 (0.445) |
493.1 (19.413) |
840.7 (33.098) |
585.2 (23.039) |
341.4 (13.441) |
89.3 (3.516) |
9.9 (0.39) |
1.6 (0.063) |
2,373.4 (93.441) |
| Average rainy days | 0.0 | 0.1 | 0.0 | 0.0 | 0.8 | 13.6 | 22.9 | 21.5 | 13.9 | 3.4 | 0.6 | 0.2 | 77.0 |
| Average relative humidity (%) | 69 | 67 | 69 | 71 | 70 | 80 | 86 | 86 | 83 | 78 | 71 | 69 | 75 |
| Mean monthly sunshine hours | 269.5 | 257.6 | 274.3 | 283.7 | 296.2 | 148.6 | 73.4 | 75.9 | 165.1 | 240.2 | 245.8 | 253.2 | 2,583.5 |
| Source #1: India Meteorological Department (record high and low up to 2010)[2][3] | |||||||||||||
| Source #2: NOAA (humidity, sun 1971–1990)[4] | |||||||||||||
Sea temperature
| Jan | Feb | Mar | Apr | May | Jun | Jul | Aug | Sep | Oct | Nov | Dec |
|---|---|---|---|---|---|---|---|---|---|---|---|
| 27 °C (81 °F) | 25 °C (77 °F) | 26 °C (79 °F) | 27 °C (81 °F) | 29 °C (84 °F) | 29 °C (84 °F) | 30 °C (86 °F) | 28 °C (82 °F) | 28 °C (82 °F) | 29 °C (84 °F) | 28 °C (82 °F) | 26 °C (79 °F) |
Monthly breakdown of climate
The following is the monthly breakdown of the weather in Mumbai city.
January
January is the coolest month of the year for Mumbai with mean daily minimum being 16.4 °C and mean daily maximum being 30.1 °C.[6][7] The weather is generally mild and pleasant with daytime highs of around 27 °C and night-time lows of around 17 °C. The nightly lows may vary between 13 °C and 24 °C. Chilly northern winds during the day make the city seem cooler than it really is. Generally clear skies, with some smog – especially in the early morning – are the norm. The days are dry, the nights relatively humid. January is also associated with the deciduous trees in the city shedding their leaves. 26–27 January 2008 recorded a minimum temperature of 10.2 °C, which is the lowest recorded in 45 years. Mumbai's winter in 2012 had the minimum temperature 8.2 °C. The lowest recorded temperature is 7.4°C (45.3°F) on 22nd January 1962 which was the coldest day in Mumbai ever.
February
The fine January weather continues for the first fortnight of February. The mean daily minimum stays at 17.3 °C and mean daily maximum being 31.3 °C with some possibility of some unseasonal showers.[6] The day highs average 29 to 30 °C. The nights hover around 18 °C. By the second fortnight the humidity starts to increase and the day temperature might rise up to 32 °C. Smog increases. 6 February 2008 recorded a minimum temperature of 9.4 °C. Just two days later, on 8 February, the minimum temperature recorded was 8.5 °C, which was the lowest temperature Mumbai has seen since January 1962.[8] This was the coldest day in February ever.
March
The month of March sees a mean minimum temp of 20.6 °C and mean maximum temp of 32.7 °C.[6] The beginning of March sees night temperatures reach 15 °C. The days reach 30 to 33 °C. During the transition from the dry to humid weather in mid March, the temperature might hit 38 to 40 °C. This high however, is due to hot dry winds from Gujarat. By mid March the temperatures hit 37 °C, with the lows at 18 °C. Humidity is unbearable, and smog affects the city. New leaves sprout from deciduous trees. The all-time high day temperature for March was recorded in 2018 at 41.7 °C.[9]
April
The temperatures and humidity are still high. However, the cooling effect of the sea breezes makes its presence felt. The cool winds compensate for the heat. Which means the days high temperature stays around 35.1 °C and means daily lows are around 23.2 °C.[6]Plants are in full bloom in April.
May
May is the hottest month of the year for Mumbai with the cool sea breezes providing some relief. This means daily maximum hovers around 34.5 °C and also means that the daily low is 29.1 °C.[6]
June
June marks the beginning of the monsoon period in Mumbai. The beginning of the month is characterized by a continuation of the summer with increased humidity. The official date for the monsoon to hit the city is 10 June.[10] This period is marked by thunderstorms and often windy conditions as the monsoon establishes itself over the city. Rainfall activity intensifies as the month goes on, leading into wettest month, July. The max and min mean daily temperatures are measured at 31.9 °C/26.6 °C.[6]
July
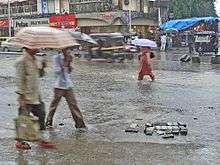
In this month the city receives the maximum amount of rain. July and August are characterized by almost non stop rain and weeks of no sunshine. A continuous monsoon current covers the entire western coast of India during this period. Rainfall activity is less stormy and more constant with a relatively constant breeze from the West or South West. It is not uncommon for parts of the city to be waterlogged during periods of persistent heavy rain. This affects the city's public transport system often leading to long delays. During periods of severe precipitation, the city's commuter rail system is often suspended because of water logging and poor visibility.
The average maximum temperature for the month is around 29.8 °C with the average minimum at 25.5 °C.[6] The highest rainfall in the history of Mumbai was recorded on 26 July 2005. On this day, a record 944 mm rainfall fell over the city, causing large scale flooding, claiming several lives and causing large scale property damage.[11]
August
The weather in August is almost identical to July. Towards the later half of the month, rainfall activity tends to lessen. The coolest days of the monsoon season are often in August. The max temperature might drop to 29.3 °C during the day and 24.5 °C at night.[6]
September
In September the intensity of rainfall decreases. The monsoons officially end in the 3rd week of September. September has unsettled weather. The rainfall is short and light and is not continuous. The end of the monsoon, much like the beginning can feature heavy thunderstorms associated with the withdrawal of the monsoon current from the city and surrounding areas. The mean maximum daily temperatures reach 30.1 °C while daily mean minimum temperature stays at 24.0 °C.[6]
October
In the month of October the mean daily maximum stays at around 32.9 °C and mean daily minimum stays at 23.1 °C[6] making it hot during the days and cold during the nights.
November
The temperature continues to drop slowly in the month of November with the mean daily minimum staying at 20.5 °C and the mean daily maximum staying around 33.4 °C.[6] There are a few unseasonal showers.
December
The day highs hover around 32.4 °C. The nights in the beginning of December do not fall below 18 °C. By late December the day temperature ranges between 26–29 °C. The nights may dip to 12 °C in late December but average around 18.2 °C.[6] Humidity is low in December.
Weather monitoring stations in Mumbai
Mumbai has two weather monitoring stations, one at Santacruz Airport and the other at Navy Nagar near Colaba towards the southern tip of Mumbai.
Record highest and lowest temperatures in Mumbai
The highest temperature ever recorded in Mumbai's history is 42.2 °C (108.0 °F), on 14 April 1952, while the lowest is 7.4 °C (45.3 °F), on 22 January 1962, both of which were recorded at the airport.[3]
References
- ↑ Vega, Anthony J (2007). Climatology. Jones and Bartlett Publishers. p. 267. ISBN 978-0-7637-3828-0.
- ↑ "Mumbai Climatological Table, Period: 1981–2010". India Meteorological Department. Archived from the original on 29 April 2018. Retrieved 29 April 2018.
- 1 2 "Ever recorded Maximum and minimum temperatures up to 2010" (PDF). India Meteorological Department. Archived from the original (PDF) on 29 April 2018. Retrieved 18 January 2014.
- ↑ "Mumbai (Bombay) Colaba Climate Normals 1971–1990". National Oceanic and Atmospheric Administration. Retrieved 18 January 2014.
- ↑ "Mumbai Climate and Weather Averages, India". Weather2Travel. Retrieved 25 June 2013.
- 1 2 3 4 5 6 7 8 9 10 11 "India Metrological Dept: Mumbai". Archived from the original on 5 April 2008.
- ↑ "Tata Institute of Fundamental Research- Mumbai:Climate".
- ↑ "Mumbai records lowest temperature in 46 years".
- ↑ Badri Chatterjee (March 29, 2017). "Monday was second-hottest March day in Mumbai since 2014". Hindustan Times. Retrieved March 29, 2017.
- ↑ "South-west monsoon might not keep its usual June 10 date with Mumbai". The Times of India. Mumbai. 9 June 2016. Retrieved 2 July 2016.
- ↑ Fairclough, Chris (2007). Mumbai. London: Evans. p. 28. ISBN 0-237-53125-9.