Carleton—Mississippi Mills (provincial electoral district)
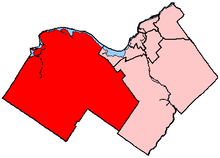 Carleton–Mississippi Mills in relation to other Ottawa electoral districts | |
| Defunct provincial electoral district | |
| Legislature | Legislative Assembly of Ontario |
| District created | 2004 |
| District abolished | 2018 |
| First contested | 2007 |
| Last contested | 2014 |
| Demographics | |
| Population (2006) | 128,915 |
| Electors (2007) | 91,649 |
| Area (km²) | 1,619 |
| Census divisions | Ottawa, Lanark County |
| Census subdivisions | Mississippi Mills, West Carleton, Kanata, Goulbourn |
Carleton–Mississippi Mills was a provincial electoral district in eastern Ontario, Canada. It was created for the 2007 provincial election. 78.7% of the riding came from Lanark–Carleton while 21.3% came from Nepean–Carleton.
The riding included the town of Mississippi Mills plus the former municipalities of West Carleton, Kanata and Goulbourn.
Following the 2018 election, the district was dissolved into Kanata—Carleton, Carleton, and Lanark—Frontenac—Kingston.
Members of Provincial Parliament
| Carleton—Mississippi Mills | ||||
|---|---|---|---|---|
| Assembly | Years | Member | Party | |
| Riding created from Lanark—Carleton and Nepean—Carleton | ||||
| 39th | 2007–2011 | Norm Sterling | Progressive Conservative | |
| 40th | 2011–2014 | Jack MacLaren | ||
| 41st | 2014–2017 | |||
| 2017–2018 | Trillium | |||
| Riding dissolved into Kanata—Carleton, Carleton, and Lanark—Frontenac—Kingston |
||||
Election results
| Ontario general election, 2014 | ||||||||
|---|---|---|---|---|---|---|---|---|
| Party | Candidate | Votes | % | ±% | ||||
| Progressive Conservative | Jack MacLaren | 30,590 | 47.49 | −2.80 | ||||
| Liberal | Rosalyn Stevens | 20,472 | 31.78 | −2.30 | ||||
| New Democratic | John Hansen | 8,744 | 13.57 | +2.23 | ||||
| Green | Andrew West | 4,614 | 7.16 | +3.85 | ||||
| Total valid votes | 64,420 | 100.0 | +14.54 | |||||
| Progressive Conservative hold | Swing | −0.25 | ||||||
Source(s)
"Official return from the records — 013, Carleton-Mississippi Mills" (PDF). Elections Ontario. 2014. Retrieved 27 June 2015.
| ||||||||
| Ontario general election, 2011 | ||||||||
|---|---|---|---|---|---|---|---|---|
| Party | Candidate | Votes | % | ±% | ||||
| Progressive Conservative | Jack MacLaren | 28,246 | 50.29 | +2.46 | ||||
| Liberal | Megan Cornell | 19,144 | 34.08 | +2.15 | ||||
| New Democratic | Liam Duff | 6,371 | 11.34 | +3.72 | ||||
| Green | Scott Simser | 1,857 | 3.31 | −7.19 | ||||
| Family Coalition | Cynthia Bredfeldt | 549 | 0.98 | +0.18 | ||||
| Total valid votes | 56,167 | 100.00 | +6.92 | |||||
| Total rejected, unmarked and declined ballots | 204 | 0.36 | −0.09 | |||||
| Turnout | 56,371 | 53.50 | −1.80 | |||||
| Eligible voters | 105,368 | +10.42 | ||||||
| Progressive Conservative hold | Swing | +0.16 | ||||||
Source(s)
"Summary of Valid Votes Cast for Each Candidate – October 6, 2011 General Election" (PDF). Elections Ontario. Nov 18, 2011. Retrieved May 27, 2014.
"Statistical Summary – General Elections 2011" ( | ||||||||
| Ontario general election, 2007 | ||||||||
|---|---|---|---|---|---|---|---|---|
| Party | Candidate | Votes | % | ±% | ||||
| Progressive Conservative | Norm Sterling | 25,126 | 47.83 | −3.5 | ||||
| Liberal | Megan Cornell | 16,776 | 31.93 | −5.9 | ||||
| Green | John Ogilvie | 5,517 | 10.50 | |||||
| New Democratic | Michael Hadskis | 4,002 | 7.62 | +2.1 | ||||
| Libertarian | Rob Alexander | 693 | 1.32 | |||||
| Family Coalition | Reynolds James | 419 | 0.80 | |||||
| Total valid votes | 52,533 | 100.0 | ||||||
| Total rejected ballots | 238 | 0.45 | ||||||
| Turnout | 52,771 | 55.30 | ||||||
| Eligible voters | 95,421 | |||||||
| Note: Change in percentage of vote calculated on results redistributed from predecessor ridings. | ||||||||
Source(s)
"Summary of Valid Votes Cast for Each Candidate – October 10, 2007 General Election" (PDF). Elections Ontario. Aug 14, 2008. Retrieved May 27, 2014.
"Statistical Summary – General Elections 2007" (PDF). Elections Ontario. May 8, 2008. Retrieved May 27, 2014. | ||||||||
2007 electoral reform referendum
| Ontario electoral reform referendum, 2007 | |||
|---|---|---|---|
| Side | Votes | % | |
| First Past the Post | 36,565 | 70.5 | |
| Mixed member proportional | 15,326 | 29.5 | |
| Total valid votes | 51,891 | 100.0 | |
References
This article is issued from
Wikipedia.
The text is licensed under Creative Commons - Attribution - Sharealike.
Additional terms may apply for the media files.