Camrose (provincial electoral district)
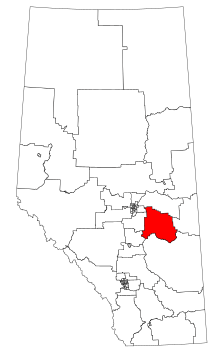 Camrose within Alberta (2017 boundaries). | |||
| Provincial electoral district | |||
| Legislature | Legislative Assembly of Alberta | ||
| MLA |
| ||
| District created | 1909 | ||
| District abolished | 1993 | ||
| District re-created | 2017 | ||
| First contested | 1909 | ||
| Last contested | 1989 | ||
| Demographics | |||
| Population (2016)[1] | 44,082 | ||
| Area (km²) | 10,636 | ||
| Pop. density (per km²) | 4.1 | ||
Camrose is a provincial electoral district in Alberta, Canada.
Geography
The district is named for its main population centre, Camrose. Its boundaries have been adjusted many times since its creation in 1909, when it was carved from the eastern parts of Wetaskiwin and Ponoka. Between 1993 and 2019, the city of Camrose was transferred to the new district of Wetaskiwin-Camrose, and the surrounding areas were transferred to several neighbouring districts.
The new incarnation of the district, re-created in the 2017 redistribution, includes most of Camrose County, all of Flagstaff County, and all of Beaver County. Over two-fifths of the district's population lives in the City of Camrose.
Representation history
1909–1993
| Members of the Legislative Assembly for Camrose | ||||
|---|---|---|---|---|
| Assembly | Years | Member | Party | |
| See Wetaskiwin and Ponoka 1905-1909 | ||||
| 2nd | 1909-1913 | George P. Smith | Liberal | |
| 3rd | 1913-1917 | |||
| 4th | 1917-1921 | |||
| 5th | 1921-1926 | Vernor Smith | United Farmers | |
| 6th | 1926-1930 | |||
| 7th | 1930-1932 | |||
| 1932 | Vacant | |||
| 1932-1935 | Chester Ronning | United Farmers | ||
| 8th | 1935-1937 | William Chant | Social Credit | |
| 1937-1940 | Independent | |||
| 9th | 1940 | David B. Mullen | Social Credit | |
| 1940-1941 | Vacant | |||
| 1941-1944 | Chester Sayers | Social Credit | ||
| 10th | 1944-1948 | |||
| 11th | 1948-1952 | |||
| 12th | 1952-1955 | |||
| 13th | 1955-1959 | |||
| 14th | 1959-1963 | |||
| 15th | 1963-1967 | |||
| 16th | 1967-1971 | |||
| 17th | 1971-1975 | Gordon Stromberg | Progressive Conservative | |
| 18th | 1975-1979 | |||
| 19th | 1979-1982 | |||
| 20th | 1982-1986 | |||
| 21st | 1986-1989 | Ken Rostad | ||
| 22nd | 1989-1993 | |||
| See Wetaskiwin-Camrose 1993-2019 | ||||
| 30th | 2019- | TBD | ||
The new district was picked up by the governing Liberals in 1909, with George P. Smith serving as MLA for three terms. In his final term, he was appointed Minister of Education.
In 1921, the United Farmers of Alberta swept most of rural Alberta from the Liberals, and Smith was soundly defeated by Vernor Smith (of no relation). He was appointed Minister of Railways and Telephones in the new government. Easily re-elected for two more terms, Smith stayed on as Minister until his sudden death in 1932. The resulting by-election delivered future Co-operative Commonwealth Federation leader Chester Ronning to the Legislature, although at the time he was still a member of the United Farmers.
The 1935 election again saw the government swept from power, and Ronning was defeated by Social Credit candidate William Chant. In the tumultuous early years of William Aberhart's government, Chant was appointed Minister of Agriculture but resigned as Minister and left the party in 1937. He did not run for re-election in 1940.
Social Credit MLA for Edmonton (and Chant's replacement as Agriculture Minister) David B. Mullen decided to run in Camrose in 1940, recapturing the district in a razor-thin contest against Chester Ronning, now running as a CCF candidate. Mullen died suddenly the same year.
Ronning ran again in the resulting by-election, but the district was held by Social Credit once again with Chester Sayers becoming MLA. He would become the district's longest-serving representative, winning re-election seven times (although remaining a backbencher throughout his career). He retired from politics at the Legislature's dissolution after his eighth term.
Camrose would again vote with a change in government in 1971, sending Progressive Conservative candidate Gordon Stromberg to the Legislature. He served four terms as MLA, also remaining a backbencher.
The district's final representative was PC Ken Rostad. He soundly defeated Western Canada Concept leader Jack Ramsay to enter the Legislature in 1986, and was appointed Solicitor General by premier Don Getty. He was re-elected in 1989 but was shuffled out of cabinet by new premier Ralph Klein in 1992. Camrose was abolished in 1993, and Rostad went on to become MLA for Wetaskiwin-Camrose.
Current district
The district was re-created by the Electoral Boundaries Commission in 2017 and will be contested in the next general election.
Election results
1909
| Alberta general election, 1909 | ||||||||
|---|---|---|---|---|---|---|---|---|
| Party | Candidate | Votes | % | |||||
| Liberal | George P. Smith | 1,010 | 55.16% | |||||
| Conservative | I.W.T. McEachern | 821 | 44.84% | |||||
| Total valid votes | 1,831 | 100.00% | ||||||
| Eligible voters / Turnout | 2,363 | 77.48% | ||||||
| Liberal pickup new district. | ||||||||
Source(s) | ||||||||
1910s
| Alberta general election, 1913 | ||||||||
|---|---|---|---|---|---|---|---|---|
| Party | Candidate | Votes | % | ±% | ||||
| Liberal | George P. Smith | 1,651 | 86.89% | +31.73% | ||||
| Conservative | R.L. Rushton | 249 | 13.11% | -31.73% | ||||
| Total valid votes | 1,900 | 100.00% | ||||||
| Eligible voters / Turnout | 2,852 | 66.62% | -10.86% | |||||
| Liberal hold | Swing | +31.73% | ||||||
Source(s) | ||||||||
| Alberta general election, 1917 | ||||||||
|---|---|---|---|---|---|---|---|---|
| Party | Candidate | Votes | % | ±% | ||||
| Liberal | George P. Smith | 2,258 | 65.22% | -21.67% | ||||
| Conservative | Frank P. Layton | 1,204 | 34.78% | +21.67% | ||||
| Total valid votes | 3,462 | 100.00% | ||||||
| Eligible voters / Turnout | 4,781 | 72.41% | +5.79% | |||||
| Liberal hold | Swing | -21.67% | ||||||
Source(s) | ||||||||
| Alberta provincial by-election, November 9, 1917 Upon the appointment of G. P. Smith as Provincial Secretary | ||||||||
|---|---|---|---|---|---|---|---|---|
| Party | Candidate | Votes | % | ±% | ||||
| Liberal | George P. Smith | 2,089 | 63.81% | -1.41% | ||||
| Nonpartisan League | J. Miner | 1,185 | 36.19% | |||||
| Total valid votes | 3,274 | 100.00% | ||||||
| Liberal hold | Swing | -18.80% | ||||||
Source(s) | ||||||||
1920s
| Alberta general election, 1921 | ||||||||
|---|---|---|---|---|---|---|---|---|
| Party | Candidate | Votes | % | ±% | ||||
| United Farmers | Vernor Smith | 3,040 | 55.97% | +19.78%[lower-alpha 1] | ||||
| Liberal | George P. Smith | 2,391 | 44.03% | -19.78% | ||||
| Total valid votes | 5,431 | 100.00% | ||||||
| Eligible voters / Turnout | 6,282 | 86.45% | +14.04%[lower-alpha 2] | |||||
| United Farmers gain from Liberal | Swing | +19.78% | ||||||
Source(s) | ||||||||
- ↑ United Farmers swing is compared to the Nonpartisan League result in the 1917 by-election.
- ↑ Turnout is compared to the 1917 general election.
| Alberta provincial by-election, December 9, 1921 | ||||||||
|---|---|---|---|---|---|---|---|---|
| Party | Candidate | Votes | ||||||
| United Farmers | Vernor Smith | Acclaimed | ||||||
| Source: "Past By-Elections". Elections Alberta. Retrieved 2015-06-30. | ||||||||
| Alberta general election, 1926 | ||||||||
|---|---|---|---|---|---|---|---|---|
| Party | Candidate | Votes | % | ±% | ||||
| United Farmers | Vernor Smith | 2,872 | 71.96% | +15.99% | ||||
| Liberal | W. A. Cunningham | 567 | 14.21% | -29.82 | ||||
| Conservative | J. A. Code | 300 | 7.52% | |||||
| Liberal–Progressive | A. D. Campbell | 252 | 6.31% | |||||
| Total valid votes | 3,991 | 100.00% | ||||||
| Eligible voters / Turnout | 6,847 | 58.29% | -28.16% | |||||
| United Farmers hold | Swing | +22.91% | ||||||
Source(s) | ||||||||
1930s
| Alberta general election, 1930 | ||||||||
|---|---|---|---|---|---|---|---|---|
| Party | Candidate | Votes | % | ±% | ||||
| United Farmers | Vernor Smith | 3,137 | 58.07% | -13.89% | ||||
| Liberal | S. M. Westvick | 2,086 | 41.93% | +27.72% | ||||
| Total valid votes | 5,223 | 100.00% | ||||||
| Rejected, spoiled and declined | 179 | |||||||
| Eligible voters / Turnout | 6,914 | 78.13% | +19.84% | |||||
| United Farmers hold | Swing | -20.81% | ||||||
Source(s) | ||||||||
| Alberta provincial by-election, October 25, 1932 Upon the death of V. Smith | ||||||||
|---|---|---|---|---|---|---|---|---|
| Party | Candidate | Votes | % | ±% | ||||
| United Farmers | Chester Ronning | 2,526 | 45.06% | -13.01% | ||||
| Liberal | S. M. Westvick | 1,979 | 35.30% | -6.63% | ||||
| Conservative | F. P. Layton | 1,101 | 19.64% | |||||
| Total valid votes | 5,606 | 100.00% | ||||||
| United Farmers hold | Swing | -3.19% | ||||||
Source(s) | ||||||||
| Alberta general election, 1935 | ||||||||
|---|---|---|---|---|---|---|---|---|
| Party | Candidate | Votes | % | ±% | ||||
| Social Credit | William Chant | 4,335 | 64.04% | |||||
| Liberal | J. T. Johnson | 1,395 | 20.61% | -14.69% | ||||
| United Farmers | Chester Ronning | 1,039 | 15.35% | -29.71% | ||||
| Total valid votes | 6,769 | 100.00% | ||||||
| Rejected, spoiled, and declined | 142 | |||||||
| Eligible voters / Turnout | 7,966 | 86.76% | +8.63[lower-alpha 1] | |||||
| Social Credit gain from United Farmers | Swing | +39.37% | ||||||
Source(s) | ||||||||
- ↑ Turnout is compared to 1930 general election.
1940s
| Alberta general election, 1940 | ||||||||
|---|---|---|---|---|---|---|---|---|
| Party | Candidate | Votes | % | ±% | ||||
| Social Credit | David B. Mullen | 2,472 | 44.90% | -19.14% | ||||
| Co-operative Commonwealth | Chester Ronning[lower-alpha 1] | 1,550 | 28.15% | +12.80% | ||||
| Independent | J. D. Neville | 1,484 | 26.95% | |||||
| Second count[lower-alpha 2] | ||||||||
| Social Credit | David B. Mullen | 2,582 | 50.73% | +5.83% | ||||
| Co-operative Commonwealth | Chester Ronning | 2,508 | 49.27% | +21.12% | ||||
| Exhausted ballots | 416 | |||||||
| Total valid votes | 5,506 | 100.00% | ||||||
| Rejected, spoiled, and declined | 167 | |||||||
| Eligible voters / Turnout | 7,343 | 77.26% | -9.50% | |||||
| Social Credit hold | Swing | -15.97% | ||||||
Source(s) | ||||||||
| Alberta provincial by-election, February 6, 1941 Upon the death of D. B. Mullen | ||||||||
|---|---|---|---|---|---|---|---|---|
| Party | Candidate | Votes | % | ±% | ||||
| Social Credit | Chester Sayers | 2,419 | 56.47% | +11.57% | ||||
| Co-operative Commonwealth | Chester Ronning | 1,865 | 43.53% | +15.38% | ||||
| Total valid votes | 4,284 | 100.00% | ||||||
| Social Credit hold | Swing | -1.91% | ||||||
Source(s) | ||||||||
| Alberta general election, 1944 | ||||||||
|---|---|---|---|---|---|---|---|---|
| Party | Candidate | Votes | % | ±% | ||||
| Social Credit | Chester Sayers | 2,763 | 55.53% | -0.94% | ||||
| Co-operative Commonwealth | C.E. Boulter | 1,590 | 31.95% | -11.58% | ||||
| Independent Progressive | William Chant | 623 | 12.52% | |||||
| Total valid votes | 4,976 | 100.00% | ||||||
| Rejected, spoiled and declined | 26 | |||||||
| Eligible voters / Turnout | 6,941 | 72.06% | -5.20% | |||||
| Social Credit hold | Swing | +5.32% | ||||||
Source(s) | ||||||||
| Alberta general election, 1948 | ||||||||
|---|---|---|---|---|---|---|---|---|
| Party | Candidate | Votes | % | ±% | ||||
| Social Credit | Chester Sayers | 3,041 | 56.75% | +1.22% | ||||
| Co-operative Commonwealth | Charles E. Boulter | 1,315 | 24.54% | -7.42% | ||||
| Liberal | Alexander E. Burgess | 1,003 | 18.72% | |||||
| Total valid votes | 5,359 | 100.00% | ||||||
| Rejected, spoiled and declined | 237 | |||||||
| Eligible voters / Turnout | 7,858 | 71.21% | -0.85% | |||||
| Social Credit hold | Swing | +4.32% | ||||||
Source(s) | ||||||||
1950s
| Alberta general election, 1952 | ||||||||
|---|---|---|---|---|---|---|---|---|
| Party | Candidate | Votes | % | ±% | ||||
| Social Credit | Chester Sayers | 2,919 | 57.62% | +0.87% | ||||
| Co-operative Commonwealth | Archie Olstad | 1,132 | 22.35% | -2.19% | ||||
| Liberal | George Bauer | 1,015 | 20.04% | +1.32% | ||||
| Total valid votes | 5,066 | 100.00% | ||||||
| Rejected, spoiled and declined | 294 | |||||||
| Eligible voters / Turnout | 8,229 | 65.14% | -6.08% | |||||
| Social Credit hold | Swing | +1.53% | ||||||
Source(s) | ||||||||
| Alberta general election, 1955 | ||||||||
|---|---|---|---|---|---|---|---|---|
| Party | Candidate | Votes | % | ±% | ||||
| Social Credit | Chester Sayers | 2,899 | 47.81% | -9.81% | ||||
| Liberal | Ed Schnell | 2,214 | 36.51% | +16.48% | ||||
| Co-operative Commonwealth | Archie Olstad | 734 | 12.10% | -10.24% | ||||
| Conservative | Charles McCleary | 217 | 3.58% | |||||
| Final count | ||||||||
| Social Credit | Chester Sayers | 3,081 | 52.77% | +4.96% | ||||
| Liberal | Ed Schnell | 2,758 | 47.23% | +35.13% | ||||
| Exhausted ballots | 225 | |||||||
| Total valid votes | 6,064 | 100.00% | ||||||
| Rejected, spoiled and declined | 285 | |||||||
| Eligible voters / Turnout | 8,786 | 72.26% | 7.13% | |||||
| Social Credit hold | Swing | -13.14% | ||||||
Source(s) | ||||||||
| Alberta general election, 1959 | ||||||||
|---|---|---|---|---|---|---|---|---|
| Party | Candidate | Votes | % | ±% | ||||
| Social Credit | Chester Sayers | 3,229 | 53.22% | +5.42% | ||||
| Progressive Conservative | John E. Stuart | 1,638 | 27.00% | +23.42% | ||||
| Liberal | Stanley Ross Gould | 732 | 12.07% | -24.45% | ||||
| Co-operative Commonwealth | Archie Olstad | 468 | 7.71% | -4.39% | ||||
| Total valid votes | 6,067 | 100.00% | ||||||
| Rejected, spoiled and declined | 12 | |||||||
| Eligible voters / Turnout | 8,479 | 71.69% | -0.57% | |||||
| Social Credit hold | Swing | -9.00% | ||||||
Source(s) | ||||||||
1960s
| Alberta general election, 1963 | ||||||||
|---|---|---|---|---|---|---|---|---|
| Party | Candidate | Votes | % | ±% | ||||
| Social Credit | Chester Sayers | 3,427 | 56.66% | +3.44% | ||||
| Progressive Conservative | Ernest Moore | 1,519 | 25.12% | -1.88% | ||||
| Liberal | James P. Richardson | 746 | 12.33% | +0.27% | ||||
| New Democratic | Kenneth Nelson | 356 | 5.89% | -1.83% | ||||
| Total valid votes | 6,048 | 100.00% | ||||||
| Rejected, spoiled and declined | 10 | |||||||
| Eligible voters / Turnout | 9,259 | 65.43% | -6.27% | |||||
| Social Credit hold | Swing | +2.66% | ||||||
Source(s) | ||||||||
| Alberta general election, 1967 | ||||||||
|---|---|---|---|---|---|---|---|---|
| Party | Candidate | Votes | % | ±% | ||||
| Social Credit | Chester Sayers | 3,083 | 44.49% | -12.18% | ||||
| Progressive Conservative | Emmett G. Mohler | 1,736 | 25.05% | -0.07% | ||||
| New Democratic | Rudy P. Swanson | 1,412 | 20.38% | +14.49% | ||||
| Liberal | G. Rod Knaut | 699 | 10.09% | -2.25% | ||||
| Total valid votes | 6,930 | 100.00% | ||||||
| Rejected, spoiled and declined | 38 | |||||||
| Eligible voters / Turnout | 9,537 | 73.06% | +7.63% | |||||
| Social Credit hold | Swing | -6.06% | ||||||
Source(s) | ||||||||
1970s
| Alberta general election, 1971 | ||||||||
|---|---|---|---|---|---|---|---|---|
| Party | Candidate | Votes | % | ±% | ||||
| Progressive Conservative | Gordon Stromberg | 4,552 | 47.89% | +22.84% | ||||
| Social Credit | Laurence Rhierson | 3,965 | 41.71% | -2.77% | ||||
| New Democratic | Keith Boulter | 988 | 10.39% | -9.98% | ||||
| Total valid votes | 9,505 | 100.00% | ||||||
| Rejected, spoiled and declined | 44 | |||||||
| Eligible voters / Turnout | 12,631 | 75.60% | +2.54% | |||||
| Progressive Conservative gain from Social Credit | Swing | +12.81% | ||||||
Source(s) | ||||||||
| Alberta general election, 1975 | ||||||||
|---|---|---|---|---|---|---|---|---|
| Party | Candidate | Votes | % | ±% | ||||
| Progressive Conservative | Gordon Stromberg | 6,483 | 72.54% | +24.65% | ||||
| Social Credit | Ray Reid | 1,313 | 14.69% | -27.02% | ||||
| New Democratic | David Moore | 1,141 | 12.77% | +2.37% | ||||
| Total valid votes | 8,937 | 100.00% | ||||||
| Rejected, spoiled and declined | 17 | |||||||
| Eligible voters / Turnout | 12,782 | 70.05% | -5.55% | |||||
| Progressive Conservative hold | Swing | +25.84% | ||||||
Source(s) | ||||||||
| Alberta general election, 1979 | ||||||||
|---|---|---|---|---|---|---|---|---|
| Party | Candidate | Votes | % | ±% | ||||
| Progressive Conservative | Gordon Stromberg | 7,998 | 60.20% | -12.34% | ||||
| Social Credit | R.A. Sorenson | 3,121 | 23.49% | +8.80% | ||||
| New Democratic | Art Bunney | 1,888 | 14.21% | +1.44% | ||||
| Liberal | John R. Shores | 278 | 2.09% | |||||
| Total valid votes | 13,285 | 100.00% | ||||||
| Rejected, spoiled and declined | 31 | |||||||
| Eligible voters / Turnout | 19,905 | 66.90% | -3.15% | |||||
| Progressive Conservative hold | Swing | -10.57% | ||||||
Source(s) | ||||||||
1980s
| Alberta general election, 1982 | ||||||||
|---|---|---|---|---|---|---|---|---|
| Party | Candidate | Votes | % | ±% | ||||
| Progressive Conservative | Gordon Stromberg | 10,547 | 63.86% | +3.65% | ||||
| New Democratic | Garry Oberg | 3,070 | 18.59% | +4.38% | ||||
| Western Canada Concept | Keith Schmidt | 2,900 | 17.56% | |||||
| Total valid votes | 16,517 | 100.00% | ||||||
| Rejected, spoiled and declined | 84 | |||||||
| Eligible voters / Turnout | 22,166 | 74.89% | +8.00% | |||||
| Progressive Conservative hold | Swing | -0.36% | ||||||
Source(s) | ||||||||
| Alberta general election, 1986 | ||||||||
|---|---|---|---|---|---|---|---|---|
| Party | Candidate | Votes | % | ±% | ||||
| Progressive Conservative | Ken Rostad | 5,312 | 54.93% | -8.92% | ||||
| New Democratic | Gordon Ekelund | 2,269 | 23.46% | +4.88% | ||||
| Liberal | Ralph Tate | 758 | 7.84% | |||||
| Representative | J.A. (Jim) Watson | 697 | 7.21% | |||||
| Western Canada Concept | Jack Ramsay | 634 | 6.56% | -11.00% | ||||
| Total valid votes | 9,670 | 100.00% | ||||||
| Rejected, spoiled and declined | 4 | |||||||
| Eligible voters / Turnout | 17,886 | 54.09% | -20.81% | |||||
| Progressive Conservative hold | Swing | -6.90% | ||||||
Source(s) | ||||||||
| Alberta general election, 1989 | ||||||||
|---|---|---|---|---|---|---|---|---|
| Party | Candidate | Votes | % | ±% | ||||
| Progressive Conservative | Ken Rostad | 6,494 | 63.42% | +8.49% | ||||
| New Democratic | Bill Scotten | 2,141 | 20.91% | -2.56% | ||||
| Liberal | Carol Ayers | 1,605 | 15.67% | +7.84% | ||||
| Total valid votes | 10,240 | 100.00% | ||||||
| Rejected, spoiled and declined | 42 | |||||||
| Eligible voters / Turnout | 17,632 | 58.31% | +4.23% | |||||
| Progressive Conservative hold | Swing | +5.52% | ||||||
Source(s) | ||||||||
2010s
| Redistributed results, Alberta general election, 2015 | |||
|---|---|---|---|
| Party | Votes | % | |
| Progressive Conservative | 6,888 | 34.78 | |
| New Democratic | 6,688 | 33.77 | |
| Wildrose | 5,901 | 29.80 | |
| Others | 326 | 1.65 | |
Plebiscite results
1957 liquor plebiscite
| 1957 Alberta liquor plebiscite results: Camrose[2] | |||
| Question A: Do you approve additional types of outlets for the sale of beer, wine and spirituous liquor subject to a local vote? | |||
|---|---|---|---|
| Ballot choice | Votes | % | |
| No | 2,818 | 67.16% | |
| Yes | 1,378 | 32.84% | |
| Total votes | 4,196 | 100% | |
| Rejected, spoiled and declined | 12 | ||
| 7,721 eligible electors, turnout 54.50% | |||
On October 30, 1957 a stand-alone plebiscite was held province wide in all 50 of the then current provincial electoral districts in Alberta. The government decided to consult Alberta voters to decide on liquor sales and mixed drinking after a divisive debate in the Legislature. The plebiscite was intended to deal with the growing demand for reforming antiquated liquor control laws.[3]
The plebiscite was conducted in two parts. Question A, asked in all districts, asked the voters if the sale of liquor should be expanded in Alberta, while Question B, asked in a handful of districts within the corporate limits of Calgary and Edmonton, asked if men and women were allowed to drink together in establishments.[2]
Province wide Question A of the plebiscite passed in 33 of the 50 districts while Question B passed in all five districts. Camrose voted heavily against it. The district recorded the second best turnout in the province. It was well above the province wide average of 46%.[2]
Official district returns were released to the public on December 31, 1957.[2] The Social Credit government in power at the time did not consider the results binding.[4] However the results of the vote led the government to repeal all existing liquor legislation and introduce an entirely new Liquor Act.[5]
Municipal districts lying inside electoral districts that voted against the plebiscite such as Camrose were designated Local Option Zones by the Alberta Liquor Control Board and considered effective dry zones, business owners who wanted a license had to petition for a binding municipal plebiscite in order to be granted a license.[6]
References
- ↑ Statistics Canada: 2016
- 1 2 3 4 Alberta Gazette. 53 (December 31 ed.). Government of Alberta. 1957. pp. 2, 247–2, 249.
- ↑ "Albertans Vote 2 to 1 For More Liquor Outlets". Vol L No 273. The Lethbridge Herald. October 31, 1957. pp. 1–2.
- ↑ "No Sudden Change In Alberta Drinking Habits Is Seen". Vol L No 267. The Lethbridge Herald. October 24, 1957. p. 1.
- ↑ "Entirely New Act On Liquor". Vol LI No 72. The Lethbridge Herald. March 5, 1968. p. 1.
- ↑ "Bill 81". Alberta Bills 12th Legislature 1st Session. Government of Alberta. 1958. p. 40.