California's 34th congressional district
| California's 34th congressional district | |
|---|---|
.tif.png) California's 34th congressional district - since January 3, 2013. | |
| Current Representative | Jimmy Gomez (D–Los Angeles) |
| Median income | $32,667 |
| Ethnicity | |
| Cook PVI | D+35[2] |
California's 34th congressional district is a congressional district in Los Angeles County in the U.S. state of California. The district has been represented by Democrat Jimmy Gomez since June 2017. Its previous representative, Democrat Xavier Becerra of Los Angeles, resigned January 24, 2017 to become Attorney General of California. Representative Gomez won a special election on June 6, 2017, beating fellow Democrat Robert Lee Ahn to replace Becerra.[3] He was later sworn in as the District's Congressman on July 11, 2017.[4]
Geography
The district is almost entirely within the City of Los Angeles and includes the following neighborhoods in Central, East and Northeast Los Angeles:
Recent election results from statewide races
| Year | Office | Results |
|---|---|---|
| 1992 | U.S. President | Clinton 50.9 - 31.1% |
| U.S. Senator | Boxer 47.0 - 42.1% | |
| U.S. Senator | Feinstein 56.1 - 34.2% | |
| 1994 | Governor | [Data unknown/missing.] |
| U.S. Senator | [Data unknown/missing.] | |
| 1996 | U.S. President | [Data unknown/missing.] |
| 1998 | Governor | [Data unknown/missing.] |
| U.S. Senator | [Data unknown/missing.] | |
| 2000 | U.S. President[5] | Gore 67.3 - 29.5% |
| U.S. Senator[6] | Feinstein 68.9 - 24.2% | |
| 2002 | Governor[7] | Davis 63.4 - 27.3% |
| 2003 | Recall[8][9] | No 57.2 - 42.8% |
| Bustamante 52.6 - 33.4% | ||
| 2004 | U.S. President[10] | Kerry 68.8 - 29.8% |
| U.S. Senator[11] | Boxer 73.7 - 21.1% | |
| 2006 | Governor[12] | Angelides 62.6 - 32.4% |
| U.S. Senator[13] | Feinstein 73.7 - 20.7% | |
| 2008 | U.S. President[14] | Obama 74.7 - 23.1% |
| 2010 | Governor | Brown 71.5 - 23.0% |
| U.S. Senator | Boxer 71.2 - 22.7% | |
| 2012 | U.S. Senator | Feinstein 84.6 - 15.4% |
| U.S. President | Obama 83.0 - 14.1% | |
| 2016 | U.S. Senator | Harris 55.4 - 44.6% |
| U.S. President | Clinton 83.6 - 10.7% |
List of representatives
| Representative | Party | Years | Notes | Counties |
|---|---|---|---|---|
 |
Democratic | January 3, 1963 – January 3, 1967 |
District created January 3, 1963 | Orange |
| January 3, 1967 – December 31, 1974 |
Resigned | Los Angeles, Orange | ||
| Vacant | December 31, 1974 – January 3, 1975 |
|||
 |
Democratic | January 3, 1975 – January 3, 1979 |
Lost re-election | Los Angeles, northwestern Orange |
 |
Republican | January 3, 1979 – January 3, 1983 |
Redistricted to the 42nd district | |
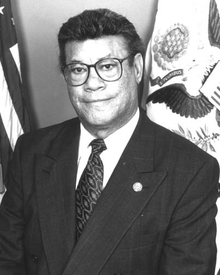 |
Democratic | January 3, 1983 – January 3, 1999 |
Retired | Los Angeles (Norwalk) |
 |
Democratic | January 3, 1999 – January 3, 2003 |
Redistricted to the 38th district | |
 |
Democratic | January 3, 2003 – January 3, 2013 |
Redistricted from the 33rd district Redistricted to the 40th district |
Los Angeles (Downtown L.A., Downey) |
 |
Democratic | January 3, 2013 – January 24, 2017 |
Redistricted from the 31st district Resigned to become California Attorney General |
Los Angeles (Downtown L.A., Northeast) |
| Vacant | January 24, 2017 – July 11, 2017 |
|||
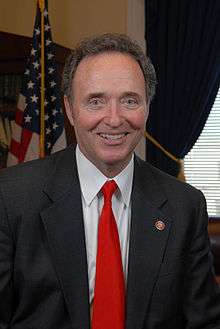
.jpg) |
Democratic | July 11, 2017 – present |
Elected to finish Becerra's term | |
Election results
|
1962 • 1964 • 1966 • 1968 • 1970 • 1972 • 1974 • 1976 • 1978 • 1980 • 1982 • 1984 • 1986 • 1988 • 1990 • 1992 • 1994 • 1996 • 1998 • 2000 • 2002 • 2004 • 2006 • 2008 • 2010 • 2012 • 2014 • 2016 |
1962
| Party | Candidate | Votes | % | ||
|---|---|---|---|---|---|
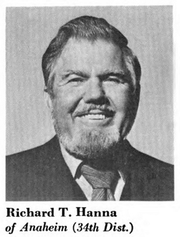
| Democratic | Richard T. Hanna | 90,758 | 55.9 | ||
| Republican | Robert A. Geier | 71,478 | 44.1 | ||
| Total votes | 162,236 | 100.0 | |||
| Democratic win (new seat) | |||||
1964
| Party | Candidate | Votes | % | |
|---|---|---|---|---|
| Democratic | Richard T. Hanna (incumbent) | 137,588 | 58.3 | |
| Republican | Robert A. Geier | 98,606 | 41.7 | |
| Total votes | 236,194 | 100.0 | ||
| Democratic hold | ||||
1966
| Party | Candidate | Votes | % | |
|---|---|---|---|---|
| Democratic | Richard T. Hanna (incumbent) | 127,976 | 55.8 | |
| Republican | Frank LaMagna | 101,410 | 44.2 | |
| Total votes | 129,386 | 100.0 | ||
| Democratic hold | ||||
1968
| Party | Candidate | Votes | % | |
|---|---|---|---|---|
| Democratic | Richard T. Hanna (incumbent) | 105,880 | 50.9 | |
| Republican | Bill J. Teague | 102,333 | 49.1 | |
| Total votes | 208,213 | 100.0 | ||
| Democratic hold | ||||
1970
| Party | Candidate | Votes | % | |
|---|---|---|---|---|
| Democratic | Richard T. Hanna (incumbent) | 101,664 | 54.5 | |
| Republican | Bill J. Teague | 82,167 | 44.0 | |
| American Independent | Lee R. Rayburn | 2,843 | 1.5 | |
| Total votes | 186,674 | 100.0 | ||
| Democratic hold | ||||
1972
| Party | Candidate | Votes | % | |
|---|---|---|---|---|
| Democratic | Richard T. Hanna (incumbent) | 113,841 | 67.2 | |
| Republican | John D. Ratterree | 48,916 | 28.9 | |
| American Independent | Lee R. Rayburn | 6,604 | 3.9 | |
| Total votes | 169,361 | 100.0 | ||
| Democratic hold | ||||
1974
| Party | Candidate | Votes | % | |
|---|---|---|---|---|
| Democratic | Mark W. Hannaford (inc.) | 78,345 | 49.8 | |
| Republican | Bill Bond | 72,967 | 46.3 | |
| American Independent | James Manis | 3,169 | 2.0 | |
| Peace and Freedom | John S. Donohue | 3,043 | 1.9 | |
| Total votes | 157,524 | 100.0 | ||
| Democratic hold | ||||
1976
| Party | Candidate | Votes | % | |
|---|---|---|---|---|
| Democratic | Mark W. Hannaford (inc.) | 100,988 | 50.7 | |
| Republican | Dan Lungren | 98,147 | 49.3 | |
| Total votes | 199,135 | 100.0 | ||
| Democratic hold | ||||
1978
| Party | Candidate | Votes | % | |||
|---|---|---|---|---|---|---|
| Republican | Dan Lungren | 90,554 | 53.7 | |||
| Democratic | Mark W. Hannaford (inc.) | 73,608 | 43.7 | |||
| American Independent | Lawrence John Stafford | 4,410 | 2.6 | |||
| Total votes | 168,572 | 100.0 | ||||
| Republican gain from Democratic | ||||||
1980
| Party | Candidate | Votes | % | |
|---|---|---|---|---|
| Republican | Dan Lungren (incumbent) | 138,024 | 71.8 | |
| Democratic | Simone | 46,351 | 24.1 | |
| Peace and Freedom | John S. Donohue | 7,794 | 4.1 | |
| Total votes | 192,169 | 100.0 | ||
| Republican hold | ||||
1982
| Party | Candidate | Votes | % | |
|---|---|---|---|---|
| Democratic | Esteban Torres | 68,316 | 57.2 | |
| Republican | Paul R. Jackson | 51,026 | 42.8 | |
| Total votes | 119,342 | 100.0 | ||
| Democratic hold | ||||
1984
| Party | Candidate | Votes | % | |
|---|---|---|---|---|
| Democratic | Esteban Torres (incumbent) | 87,060 | 59.8 | |
| Republican | Paul R. Jackson | 58,467 | 40.2 | |
| Total votes | 145,527 | 100.0 | ||
| Democratic hold | ||||
1986
| Party | Candidate | Votes | % | |
|---|---|---|---|---|
| Democratic | Esteban Torres (incumbent) | 66,404 | 60.3 | |
| Republican | Charles M. House | 43,659 | 39.7 | |
| Total votes | 110,063 | 100.0 | ||
| Democratic hold | ||||
1988
| Party | Candidate | Votes | % | |
|---|---|---|---|---|
| Democratic | Esteban Torres (incumbent) | 92,087 | 63.2 | |
| Republican | Charles M. House | 50,954 | 35.0 | |
| Libertarian | Carl M. "Marty" Swinney | 2,686 | 1.8 | |
| Total votes | 145,727 | 100.0 | ||
| Democratic hold | ||||
1990
| Party | Candidate | Votes | % | |
|---|---|---|---|---|
| Democratic | Esteban Torres (incumbent) | 55,646 | 60.7 | |
| Republican | John C. Eastman | 36,024 | 39.3 | |
| Total votes | 91,670 | 100.0 | ||
| Democratic hold | ||||
1992
| Party | Candidate | Votes | % | |
|---|---|---|---|---|
| Democratic | Esteban Torres (incumbent) | 91,738 | 61.3 | |
| Republican | J. Jay Hernandez | 50,907 | 34.0 | |
| Libertarian | Carl M. "Marty" Swinney | 7,072 | 4.7 | |
| No party | Worland (write-in) | 1 | 0.0% | |
| Total votes | 149,718 | 100.0 | ||
| Democratic hold | ||||
1994
| Party | Candidate | Votes | % | |
|---|---|---|---|---|
| Democratic | Esteban Torres (incumbent) | 72,439 | 61.67 | |
| Republican | Albert J. Nunez | 40,068 | 34.11 | |
| Libertarian | Carl M. "Marty" Swinney | 4,921 | 4.19 | |
| American Independent | J. Scott (write-in) | 27 | 0.02 | |
| Total votes | 117,455 | 100.0 | ||
| Democratic hold | ||||
1996
| Party | Candidate | Votes | % | |
|---|---|---|---|---|
| Democratic | Esteban Torres (incumbent) | 94,730 | 68.5 | |
| Republican | David Nunez | 36,852 | 26.7 | |
| American Independent | J. Scott | 4,122 | 2.9 | |
| Libertarian | David Argall | 2,736 | 1.9 | |
| Total votes | 138,440 | 100.0 | ||
| Democratic hold | ||||
1998
| Party | Candidate | Votes | % | |
|---|---|---|---|---|
| Democratic | Grace Napolitano | 76,471 | 67.63 | |
| Republican | Ed Perez | 32,321 | 28.58 | |
| Libertarian | Jason Heath | 2,195 | 1.94 | |
| American Independent | Walter Scott | 2,088 | 1.85 | |
| Total votes | 113,075 | 100.0 | ||
| Democratic hold | ||||
2000
| Party | Candidate | Votes | % | |
|---|---|---|---|---|
| Democratic | Grace Napolitano (incumbent) | 105,980 | 71.3 | |
| Republican | Robert Arthur Canales | 33,445 | 22.5 | |
| Natural Law | Julia F. Simon | 9,262 | 6.2 | |
| Republican | John W. Brantuk (write-in) | 36 | 0.0 | |
| Total votes | 148,723 | 100.0 | ||
| Democratic hold | ||||
2002
| Party | Candidate | Votes | % | |
|---|---|---|---|---|
| Democratic | Lucille Roybal-Allard (inc.) | 46,734 | 74.1 | |
| Republican | Wayne Miller | 17,090 | 25.9 | |
| Total votes | 63,824 | 100.0 | ||
| Democratic hold | ||||
2004
| Party | Candidate | Votes | % | |
|---|---|---|---|---|
| Democratic | Lucille Roybal-Allard (inc.) | 82,282 | 74.5 | |
| Republican | Wayne Miller | 28,175 | 25.5 | |
| Total votes | 110,457 | 100.0 | ||
| Democratic hold | ||||
2006
| Party | Candidate | Votes | % | |
|---|---|---|---|---|
| Democratic | Lucille Roybal-Allard (inc.) | 57,459 | 76.8 | |
| Republican | Wayne Miller | 17,359 | 23.2 | |
| No party | Naomi Crane (write-in) | 1 | 0.0% | |
| Total votes | 74,819 | 100.0 | ||
| Democratic hold | ||||
2008
| Party | Candidate | Votes | % | |
|---|---|---|---|---|
| Democratic | Lucille Roybal-Allard (incumbent) | 98,503 | 77.09 | |
| Republican | Christopher Balding | 29,266 | 22.91 | |
| Total votes | 127,769 | 100.00 | ||
| Turnout | 63.68 | |||
| Democratic hold | ||||
2010
| Party | Candidate | Votes | % | |
|---|---|---|---|---|
| Democratic | Lucille Roybal-Allard (incumbent) | 69,382 | 77.23 | |
| Republican | Wayne Miller | 20,457 | 22.77 | |
| Total votes | 89,839 | 100.0 | ||
| Democratic hold | ||||
2012
| Party | Candidate | Votes | % | |
|---|---|---|---|---|
| Democratic | Xavier Becerra (incumbent) | 120,367 | 85.6 | |
| Republican | Stephen C. Smith | 20,223 | 14.4 | |
| Total votes | 140,590 | 100.0 | ||
| Democratic hold | ||||
2014
| Party | Candidate | Votes | % | |
|---|---|---|---|---|
| Democratic | Xavier Becerra (incumbent) | 44,697 | 73% | |
| Democratic | Adrienne Nicole Edwards | 16,924 | 27% | |
| Total votes | 61,621 | 100% | ||
| Democratic hold | ||||
2016
| Party | Candidate | Votes | % | |
|---|---|---|---|---|
| Democratic | Xavier Becerra (incumbent) | 122,842 | 77% | |
| Democratic | Adrienne Nicole Edwards | 36,314 | 23% | |
| Total votes | 159,156 | 100% | ||
| Democratic hold | ||||
2017
| Party | Candidate | Votes | % | ||
|---|---|---|---|---|---|
| Democratic | Jimmy Gomez | 19,761 | 60.1% | ||
| Democratic | Robert Lee Ahn | 13,108 | 39.9% | ||
| Total votes | 32,869 | 100.00 | |||
| Democratic hold | |||||
Living former Members
As of April 2015, there are five former members of the U.S. House of Representatives from California's 34th congressional district that are currently living.
| Representative | Term in office | Date of birth (and age) |
|---|---|---|
| Dan Lungren | 1979 - 1983 | September 22, 1946 |
| Esteban Edward Torres | 1983 - 1999 | January 27, 1930 |
| Grace Napolitano | 1999 - 2003 | December 4, 1936 |
| Lucille Roybal-Allard | 2003 - 2013 | June 12, 1941 |
| Xavier Becerra | 2013 - 2017 | January 26, 1958 |
Historical district boundaries

See also
References
- ↑ http://www.latimes.com/la-redistricting-map-july-2011,0,5339409.htmlstory#39.71057374407184,-118.14590136718749,5,usCongress,,,current
- ↑ "Partisan Voting Index – Districts of the 115th Congress" (PDF). The Cook Political Report. April 7, 2017. Retrieved April 7, 2017.
- ↑ http://mynewsla.com/government/2017/06/07/traditionally-latino-congressional-seat-stays-with-latino-korean-american-defeated/
- ↑ http://www.latimes.com/politics/essential/la-pol-ca-essential-politics-updates-los-angeles-rep-jimmy-gomez-sworn-1499817496-htmlstory.html
- ↑ Statement of Vote (2000 President) Archived 2011-05-20 at the Wayback Machine.
- ↑ Statement of Vote (2000 Senator) Archived 2011-05-20 at the Wayback Machine.
- ↑ Statement of Vote (2002 Governor) Archived 2010-11-11 at the Wayback Machine.
- ↑ Statement of Vote (2003 Recall Question) Archived 2011-05-20 at the Wayback Machine.
- ↑ Statement of Vote (2003 Governor) Archived 2011-05-20 at the Wayback Machine.
- ↑ Statement of Vote (2004 President) Archived 2011-05-20 at the Wayback Machine.
- ↑ Statement of Vote (2004 Senator) Archived 2011-08-10 at the Wayback Machine.
- ↑ Statement of Vote (2006 Governor) Archived 2011-08-10 at the Wayback Machine.
- ↑ Statement of Vote (2006 Senator) Archived 2011-08-10 at the Wayback Machine.
- ↑ (2008 President) Archived 2009-02-14 at the Wayback Machine.
- ↑ 1962 election results
- ↑ 1964 election results
- ↑ 1966 election results
- ↑ 1968 election results
- ↑ 1970 election results
- ↑ 1972 election results
- ↑ 1974 election results
- ↑ 1976 election results
- ↑ 1978 election results
- ↑ 1980 election results
- ↑ 1982 election results
- ↑ 1984 election results
- ↑ 1986 election results
- ↑ 1988 election results
- ↑ 1990 election results
- ↑ 1992 election results
- ↑ 1994 election results
- ↑ 1996 election results
- ↑ 1998 election results
- ↑ 2000 election results
- ↑ 2002 general election results Archived February 3, 2009, at the Wayback Machine.
- ↑ 2004 general election results
- ↑ 2006 general election results Archived November 27, 2008, at the Wayback Machine.
- ↑ 2012 general election results Archived October 19, 2013, at the Wayback Machine.
- ↑ 2012 general election results Archived October 19, 2013, at the Wayback Machine.
External links
- California's 34th congressional district, GovTrack.US
- RAND California Election Returns: District Definitions
- California Voter Foundation map - CD34
- Christopher Balding for Congress
Coordinates: 34°04′29″N 118°13′42″W / 34.07472°N 118.22833°W