California's 21st congressional district
| California's 21st congressional district | |
|---|---|
.tif.png) California's 21st congressional district – since January 3, 2013. | |
| Current Representative | David Valadao (R–Hanford) |
| Ethnicity | |
| Cook PVI | D+5[2] |
California's 21st congressional district is a congressional district in the U.S. state of California which is centered in the San Joaquin Valley, and includes areas of Fresno County, Kern County, Kings County, and Tulare County. Cities in it include Coalinga, Delano, Hanford, and outer parts of Bakersfield.
The district is currently represented by Republican David Valadao. Democrat Emilio Huerta, who lost to Valadao in 2016, had announced that he would run against Valadao again in the 2018 midterm elections.[3] Huerta withdrew from the race on March 2, 2018.[4] On March 6, 2018, with the filing deadline looming, "TJ"(Terrance John) Cox, an engineer and small businessman, announced that he would not run in CA-10 against Rep. Jeff Denham; but instead, would run in CA-21 against Rep. Valadao. In 2017, the District leaned 5 points more Democratic than the nation as a whole, according to the Cook Political Report's Partisan Voting Index.[2]
Formerly, from 2003–2013, the 21st district covered all of Tulare County and the eastern half of Fresno County.
Voting
| Election results from statewide races (current incarnation) | ||
|---|---|---|
| Year | Office | Results |
| 2016 | President | Clinton 55.2–39.7% |
| 2012 | President | Obama 54.6–43.5% |
| Senator | Feinstein 55.6–44.4% | |
| 2010 | Governor | Brown 47.5–43.8% |
| Senator | Fiorina 49.9–39.5% | |
| Attorney General | Cooley 48.9–37.2% | |
| Treasurer | Lockyer 49.7–38.7% | |
| Controller | Chiang 50.1–37.8% | |
| 2008 | President | Obama 51.5–45.7% |
| Election results from statewide races (previous incarnation) | ||
|---|---|---|
| Year | Office | Results |
| 2010 | Governor | Whitman 58.4–36.2% |
| Senator | Fiorina 63.9–30.2% | |
| 2008 | President[5] | McCain 56.3–42.1% |
| 2006 | Governor[6] | Schwarzenegger 71.6–25.0% |
| Senator[7] | Mountjoy 52.3–43.4% | |
| 2004 | President[8] | Bush 65.4–33.7% |
| Senator[9] | Jones 59.0–37.9% | |
| 2003 | Recall[10][11] | Yes 72.4–27.6% |
| Schwarzenegger 55.8–22.6% | ||
| 2002 | Governor[12] | Simon 60.9–32.4% |
| 2000 | President[13] | Bush 63.6–33.2% |
| Senator[14] | Campbell 52.8–40.4% | |
| 1998 | Governor | |
| Senator | ||
| 1996 | President | |
| 1994 | Governor | |
| Senator | ||
| 1992 | President | Bush 46.4–32.5% |
| Senator | Herschensohn 63.1–28.4% | |
| Senator | Seymour 56.5–34.5% | |
List of representatives
| Representative | Party | Dates | Notes | Counties |
|---|---|---|---|---|
| District created | January 3, 1943 | |||
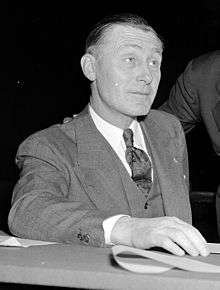 |
Democratic | January 3, 1943 – January 3, 1953 |
Redistricted from the 19th district Redistricted to the 27th district |
Northern Los Angeles, San Bernardino |
 |
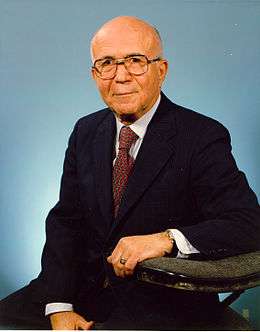
Republican | January 3, 1953 – January 3, 1963 |
Redistricted to the 27th district and lost | Los Angeles |
 |
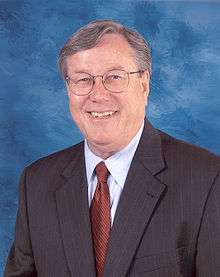
Democratic | January 3, 1963 – January 3, 1975 |
Redistricted to the 29th district | |
.jpg) |
Democratic | January 3, 1975 – January 3, 1981 |
Redistricted from the 22nd district Lost re-election | |
.jpg) |
Republican | January 3, 1981 – January 3, 1983 |
||
| January 3, 1983 – January 3, 1987 |
Retired to run for US Senate | Los Angeles (western San Fernando Valley), southeastern Ventura | ||
 |
Republican | January 3, 1987 – January 3, 1993 |
Redistricted to the 23rd district | |
 |
Republican | January 3, 1993 – January 3, 2003 |
Redistricted from the 20th district Redistricted to the 22nd district |
Kern, eastern Tulare |
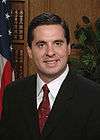 |
Republican | January 3, 2003 – January 3, 2013 |
Redistricted to the 22nd district | Eastern Fresno, Tulare |
 |
Republican | January 3, 2013 – present |
Kings, parts of Fresno. Kern and Tulare. | |
Election results
|
1942 • 1944 • 1946 • 1948 • 1950 • 1952 • 1954 • 1956 • 1958 • 1960 • 1962 • 1964 • 1966 • 1968 • 1970 • 1972 • 1974 • 1976 • 1978 • 1980 • 1982 • 1984 • 1986 • 1988 • 1990 • 1992 • 1994 • 1996 • 1998 • 2000 • 2002 • 2004 • 2006 • 2008 • 2010 • 2012 • 2014 • 2016 |
1942
| Party | Candidate | Votes | % | |
|---|---|---|---|---|
| Democratic | Harry R. Sheppard (inc.) | 38,419 | 96.6 | |
| Republican | Arthur E. Isham (write-in) | 1,350 | 3.4 | |
| Total votes | 39,769 | 100.0 | ||
| Turnout | ||||
| Democratic hold | ||||
1944
| Party | Candidate | Votes | % | |
|---|---|---|---|---|
| Democratic | Harry R. Sheppard (inc.) | 48,539 | 58.5 | |
| Republican | Earl S. Webb | 34,409 | 41.5 | |
| Total votes | 82,948 | 100.0 | ||
| Turnout | ||||
| Democratic hold | ||||
1946
| Party | Candidate | Votes | % | |
|---|---|---|---|---|
| Democratic | Harry R. Sheppard (inc.) | 37,229 | 52.7 | |
| Republican | Lowell E. Lathrop | 33,395 | 47.3 | |
| Total votes | 70,624 | 100.0 | ||
| Turnout | ||||
| Democratic hold | ||||
1948
| Party | Candidate | Votes | % | |
|---|---|---|---|---|
| Democratic | Harry R. Sheppard (inc.) | 61,383 | 55.2 | |
| Republican | Lowell E. Lathrop | 47,411 | 42.6 | |
| Progressive | Howard J. Louks | 2,422 | 2.2 | |
| Total votes | 111,216 | 100.0 | ||
| Turnout | ||||
| Democratic hold | ||||
1950
| Party | Candidate | Votes | % | |
|---|---|---|---|---|
| Democratic | Harry R. Sheppard (inc.) | 62,994 | 57.4 | |
| Republican | R. E. Reynolds | 46,693 | 42.6 | |
| Total votes | 109,687 | 100.0 | ||
| Turnout | ||||
| Democratic hold | ||||
1952
| Party | Candidate | Votes | % | ||
|---|---|---|---|---|---|
| Republican | Edgar W. Hiestand | 112,100 | 53.6 | ||
| Democratic | Everett G. Burkhalter | 97,007 | 46.4 | ||
| Total votes | 209,107 | 100.0 | |||
| Turnout | |||||
| Republican win (new seat) | |||||
1954
| Party | Candidate | Votes | % | |
|---|---|---|---|---|
| Republican | Edgar W. Hiestand (inc.) | 100,258 | 58.7 | |
| Democratic | William E. "Bill" Roskam | 70,486 | 41.3 | |
| Total votes | 170,744 | 100.0 | ||
| Turnout | ||||
| Republican hold | ||||
1956
| Party | Candidate | Votes | % | |
|---|---|---|---|---|
| Republican | Edgar W. Hiestand (inc.) | 153,679 | 62.6 | |
| Democratic | W. C. "Bill" Stethem | 91,683 | 37.4 | |
| Total votes | 245,362 | 100.0 | ||
| Turnout | ||||
| Republican hold | ||||
1958
| Party | Candidate | Votes | % | |
|---|---|---|---|---|
| Republican | Edgar W. Hiestand (inc.) | 127,238 | 51.9 | |
| Democratic | Mrs. Rudd Brown | 118,141 | 48.1 | |
| Total votes | 245,379 | 100.0 | ||
| Turnout | ||||
| Republican hold | ||||
1960
| Party | Candidate | Votes | % | |
|---|---|---|---|---|
| Republican | Edgar W. Hiestand (inc.) | 179,376 | 58.4 | |
| Democratic | Mrs. Rudd Brown | 127,591 | 41.6 | |
| Total votes | 306,967 | 100.0 | ||
| Turnout | ||||
| Republican hold | ||||
1962
| Party | Candidate | Votes | % | ||
|---|---|---|---|---|---|
| Democratic | Augustus F. Hawkins | 73,465 | 84.6 | ||
| Republican | Herman Smith | 13,371 | 15.2 | ||
| Total votes | 86,836 | 100.0 | |||
| Turnout | |||||
| Democratic win (new seat) | |||||
1964
| Party | Candidate | Votes | % | |
|---|---|---|---|---|
| Democratic | Augustus F. Hawkins (inc.) | 106,231 | 90.3 | |
| Republican | Rayfield Lundy | 11,374 | 9.7 | |
| Total votes | 117,605 | 100.0 | ||
| Turnout | ||||
| Democratic hold | ||||
1966
| Party | Candidate | Votes | % | |
|---|---|---|---|---|
| Democratic | Augustus F. Hawkins (inc.) | 74,216 | 84.8 | |
| Republican | Rayfield Lundy | 13,294 | 15.2 | |
| Total votes | 87,510 | 100.0 | ||
| Turnout | ||||
| Democratic hold | ||||
1968
| Party | Candidate | Votes | % | |
|---|---|---|---|---|
| Democratic | Augustus F. Hawkins (inc.) | 87,205 | 91.6 | |
| Republican | Rayfield Lundy | 7,995 | 8.4 | |
| Total votes | 95,200 | 100.0 | ||
| Turnout | ||||
| Democratic hold | ||||
1970
| Party | Candidate | Votes | % | |
|---|---|---|---|---|
| Democratic | Augustus F. Hawkins (inc.) | 75,127 | 94.5 | |
| Republican | Southy M. Johnson | 4,349 | 5.5 | |
| Total votes | 79,476 | 100.0 | ||
| Turnout | ||||
| Democratic hold | ||||
1972
| Party | Candidate | Votes | % | |
|---|---|---|---|---|
| Democratic | Augustus F. Hawkins (inc.) | 92,799 | 82.9 | |
| Republican | Rayfield Lundy | 19,187 | 17.1 | |
| Total votes | 111,986 | 100.0 | ||
| Turnout | ||||
| Democratic hold | ||||
1974
| Party | Candidate | Votes | % | |
|---|---|---|---|---|
| Democratic | James C. Corman (incumbent) | 86,778 | 73.5 | |
| Republican | Mel Nadell | 31,365 | 26.5 | |
| Total votes | 118,143 | 100.0 | ||
| Turnout | ||||
| Democratic hold | ||||
1976
| Party | Candidate | Votes | % | |
|---|---|---|---|---|
| Democratic | James C. Corman (incumbent) | 101,837 | 66.5 | |
| Republican | Erwin Ed Hogan | 44,094 | 28.8 | |
| Peace and Freedom | Bill Hill | 7,178 | 4.7 | |
| Total votes | 153,109 | 100.0 | ||
| Turnout | ||||
| Democratic hold | ||||
1978
| Party | Candidate | Votes | % | |
|---|---|---|---|---|
| Democratic | James C. Corman (incumbent) | 73,869 | 59.5 | |
| Republican | Rod Walsh | 44,519 | 35.9 | |
| Peace and Freedom | Bill Hill | 5,750 | 4.6 | |
| Total votes | 124,138 | 100.0 | ||
| Turnout | ||||
| Democratic hold | ||||
1980
| Party | Candidate | Votes | % | |||
|---|---|---|---|---|---|---|
| Republican | Bobbi Fiedler | 74,674 | 48.7 | |||
| Democratic | James C. Corman (incumbent) | 73,898 | 48.2 | |||
| Libertarian | George J. Lehmann | 2,790 | 1.8 | |||
| Peace and Freedom | Jan B. Tucker | 2,038 | 1.3 | |||
| Total votes | 153,400 | 100.0 | ||||
| Turnout | ||||||
| Republican gain from Democratic | ||||||
1982
| Party | Candidate | Votes | % | |
|---|---|---|---|---|
| Republican | Bobbi Fiedler (incumbent) | 138,474 | 71.8 | |
| Democratic | George Henry Margolis | 46,412 | 24.1 | |
| Libertarian | Daniel Wiener | 7,881 | 4.1 | |
| Total votes | 192,767 | 100.0 | ||
| Turnout | ||||
| Republican hold | ||||
1984
| Party | Candidate | Votes | % | |
|---|---|---|---|---|
| Republican | Bobbi Fiedler (incumbent) | 173,504 | 72.3 | |
| Democratic | Charles "Charlie" Davis | 62,085 | 25.9 | |
| Libertarian | Robert Townsend Leet | 4,379 | 1.8 | |
| Total votes | 239,968 | 100.0 | ||
| Turnout | ||||
| Republican hold | ||||
1986
| Party | Candidate | Votes | % | |
|---|---|---|---|---|
| Republican | Elton Gallegly | 132,090 | 68.4 | |
| Democratic | Gilbert R. Saldana | 54,497 | 28.2 | |
| Libertarian | Daniel Wiener | 6,504 | 3.4 | |
| Total votes | 193,091 | 100.0 | ||
| Turnout | ||||
| Republican hold | ||||
1988
| Party | Candidate | Votes | % | |
|---|---|---|---|---|
| Republican | Elton Gallegly (incumbent) | 181,413 | 69.1 | |
| Democratic | Donald E. Stevens | 75,739 | 28.8 | |
| Libertarian | Robert Jay | 5,519 | 2.1 | |
| Total votes | 262,671 | 100.0 | ||
| Turnout | ||||
| Republican hold | ||||
1990
| Party | Candidate | Votes | % | |
|---|---|---|---|---|
| Republican | Elton Gallegly (incumbent) | 118,326 | 58.4 | |
| Democratic | Richard D. Freiman | 68,921 | 34.0 | |
| Libertarian | Peggy L. Christensen | 15,364 | 7.6 | |
| Total votes | 202,611 | 100.0 | ||
| Turnout | ||||
| Republican hold | ||||
1992
| Party | Candidate | Votes | % | |
|---|---|---|---|---|
| Republican | Bill Thomas (incumbent) | 127,758 | 65.2 | |
| Democratic | Deborah A. Vollmer | 68,058 | 34.7 | |
| Libertarian | Mike Hodges (write-in) | 149 | 0.1 | |
| Total votes | 195,965 | 100.0 | ||
| Turnout | ||||
| Republican hold | ||||
1994
| Party | Candidate | Votes | % | |
|---|---|---|---|---|
| Republican | Bill Thomas (incumbent) | 116,874 | 68.10 | |
| Democratic | John L. Evans | 47,517 | 27.69 | |
| Libertarian | Mike Hodges | 6,899 | 4.02 | |
| No party | Vollmer (write-in) | 339 | 0.20% | |
| Total votes | 171,629 | 100.0 | ||
| Turnout | ||||
| Republican hold | ||||
1996
| Party | Candidate | Votes | % | |
|---|---|---|---|---|
| Republican | Bill Thomas (incumbent) | 125,916 | 65.9 | |
| Democratic | Deborah Vollmer | 50,694 | 26.5 | |
| Reform | John Evans | 8,113 | 4.3 | |
| Natural Law | Jane Bialosky | 3,380 | 1.8 | |
| Libertarian | Mike Hodges | 3,049 | 1.5 | |
| Republican | Karen Gentry (write-in) | 172 | 0.0 | |
| Total votes | 191,324 | 100.0 | ||
| Turnout | ||||
| Republican hold | ||||
1998
| Party | Candidate | Votes | % | |
|---|---|---|---|---|
| Republican | Bill Thomas (incumbent) | 115,989 | 78.91 | |
| Democratic | John Evans | 30,994 | 21.09 | |
| Total votes | 146,983 | 100.0 | ||
| Turnout | ||||
| Republican hold | ||||
2000
| Party | Candidate | Votes | % | |
|---|---|---|---|---|
| Republican | Bill Thomas (incumbent) | 142,539 | 71.6 | |
| Democratic | Pedro "Pete" Martinez | 49,318 | 24.8 | |
| Libertarian | James R.S. Manion | 7,243 | 3.6 | |
| Total votes | 199,100 | 100.0 | ||
| Turnout | ||||
| Republican hold | ||||
2002
| Party | Candidate | Votes | % | ||
|---|---|---|---|---|---|
| Republican | Devin Nunes | 87,544 | 70.5 | ||
| Democratic | David G. LaPere | 32,584 | 26.3 | ||
| Libertarian | Jonathan Richter | 4,070 | 3.2 | ||
| Total votes | 124,198 | 100.0 | |||
| Turnout | |||||
| Republican win (new seat) | |||||
2004
| Party | Candidate | Votes | % | |
|---|---|---|---|---|
| Republican | Devin Nunes (incumbent) | 140,721 | 73.2 | |
| Democratic | Fred B. Davis | 51,594 | 26.8 | |
| Total votes | 192,315 | 100.0 | ||
| Turnout | ||||
| Republican hold | ||||
2006
| Party | Candidate | Votes | % | |
|---|---|---|---|---|
| Republican | Devin Nunes (incumbent) | 95,214 | 66.8 | |
| Democratic | Steven Haze | 42,718 | 29.9 | |
| Green | John Roger Miller | 4,729 | 3.3 | |
| Total votes | 142,661 | 100.0 | ||
| Turnout | ||||
| Republican hold | ||||
2008
| Party | Candidate | Votes | % | |
|---|---|---|---|---|
| Republican | Devin Nunes (incumbent) | 143,498 | 68.4 | |
| Democratic | Larry Johnson | 66,317 | 31.6 | |
| Total votes | 209,815 | 100.0 | ||
| Turnout | ||||
| Republican hold | ||||
2010
| Party | Candidate | Votes | % | |
|---|---|---|---|---|
| Republican | Devin Nunes (incumbent) | 135,979 | 100.0 | |
| Total votes | 135,979 | 100.0 | ||
| Turnout | ||||
| Republican hold | ||||
2012
| Party | Candidate | Votes | % | ||
|---|---|---|---|---|---|
| Republican | David Valadao | 67,164 | 57.8 | ||
| Democratic | John Hernandez | 49,119 | 42.2 | ||
| Total votes | 116,283 | 100.0 | |||
| Republican win (new seat) | |||||
2014
| Party | Candidate | Votes | % | |
|---|---|---|---|---|
| Republican | David Valadao (incumbent) | 45,907 | 57.8 | |
| Democratic | Amanda Renteria | 33,470 | 42.2 | |
| Total votes | 79,377 | 100.0 | ||
| Republican hold | ||||
2016
| Party | Candidate | Votes | % | |
|---|---|---|---|---|
| Republican | David Valadao (incumbent) | 75,126 | 56.7 | |
| Democratic | Emilio Huerta | 57,282 | 43.3 | |
| Total votes | 132,408 | 100.0 | ||
| Republican hold | ||||
Living former Members
As of April 2015, there are four former members of the U.S. House of Representatives from California's 21st congressional district that are currently living. The most recent representative to die was Augustus F. Hawkins (1963-1975) on November 10, 2007. The most recently serving representative to die was James C. Corman (1975-1981) on December 30, 2000.
| Representative | Term in office | Date of birth (and age) |
|---|---|---|
| Bobbi Fiedler | 1981–1987 | April 22, 1937 |
| Elton Gallegly | 1987–1993 | March 7, 1944 |
| Bill Thomas | 1993–2003 | December 6, 1941 |
| Devin Nunes | 2003–2013 | October 1, 1973 |
Historical district boundaries

See also
References
- ↑ http://www.latimes.com/la-redistricting-map-july-2011,0,5339409.htmlstory#39.71057374407184,-118.14590136718749,5,usCongress,,,current
- 1 2 "Partisan Voting Index – Districts of the 115th Congress" (PDF). The Cook Political Report. April 7, 2017. Retrieved April 7, 2017.
- ↑ Hernandez, Luis. "Nunes, Valadao to face challenge in 2018 election". Visalia Times-Delta. USA Today Networks. Retrieved 18 June 2017.
- ↑ http://www.fresnobee.com/news/politics-government/politics-columns-blogs/political-notebook/article203154124.html. Missing or empty
|title=(help) - ↑ (2008 President)
- ↑ Statement of Vote (2006 Governor) Archived 2011-08-10 at the Wayback Machine.
- ↑ Statement of Vote (2006 Senator) Archived 2011-08-10 at the Wayback Machine.
- ↑ Statement of Vote (2004 President) Archived 2010-08-01 at the Wayback Machine.
- ↑ Statement of Vote (2004 Senator) Archived 2011-08-10 at the Wayback Machine.
- ↑ Statement of Vote (2003 Recall Question) Archived 2011-05-20 at the Wayback Machine.
- ↑ Statement of Vote (2003 Governor) Archived 2011-05-20 at the Wayback Machine.
- ↑ Statement of Vote (2002 Governor) Archived 2010-11-11 at the Wayback Machine.
- ↑ Statement of Vote (2000 President) Archived 2007-06-11 at the Wayback Machine.
- ↑ Statement of Vote (2000 Senator) Archived 2007-06-11 at the Wayback Machine.
- ↑ 1942 election results
- ↑ 1944 election results
- ↑ 1946 election results
- ↑ 1948 election results
- ↑ 1950 election results
- ↑ 1952 election results
- ↑ 1954 election results
- ↑ 1956 election results
- ↑ 1958 election results
- ↑ 1960 election results
- ↑ 1962 election results
- ↑ 1964 election results
- ↑ 1966 election results
- ↑ 1968 election results
- ↑ 1970 election results
- ↑ 1972 election results
- ↑ 1974 election results
- ↑ 1976 election results
- ↑ 1978 election results
- ↑ 1980 election results
- ↑ 1982 election results
- ↑ 1984 election results
- ↑ 1986 election results
- ↑ 1988 election results
- ↑ 1990 election results
- ↑ 1992 election results
- ↑ 1994 election results
- ↑ 1996 election results
- ↑ 1998 election results
- ↑ 2000 election results
- ↑ 2002 general election results Archived February 3, 2009, at the Wayback Machine.
- ↑ 2004 general election results Archived 2008-08-21 at the Wayback Machine.
- ↑ 2006 general election results Archived November 27, 2008, at the Wayback Machine.
- ↑ California - Election Results 2008 - The New York Times
- ↑ Barone, Michael; Cohen, Richard E. (2009). Koszczuk, Jackie, ed. The Almanac of American Politics (2010 ed.). Washington, D.C.: National Journal Group. p. 195. ISBN 978-0-89234-120-7.
- ↑ Statement of Vote November 4, 2008, General Election Archived October 18, 2012, at the Wayback Machine.
- ↑ 2010 general election results
- ↑ 2012 general election results Archived October 19, 2013, at the Wayback Machine.
- ↑ U.S. House of Representatives District 21 - Districtwide Results Archived 2014-12-14 at the Wayback Machine.
- ↑ U.S. House of Representatives District 21 - Districtwide Results Archived 2014-11-18 at the Wayback Machine.