California's 51st congressional district
| California's 51st congressional district | |
|---|---|
.tif.png) California's 51st congressional district - since January 3, 2013. | |
| Current Representative | Juan Vargas (D–San Diego) |
| Area | 4,896 sq mi (12,680 km2) |
| Population (2013) | 743,982[1] |
| Median income | 41,477[2] |
| Ethnicity | |
| Cook PVI | D+22[4] |
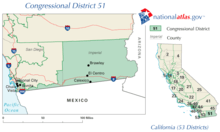
California's 51st congressional district is a congressional district in the U.S. state of California. The district is currently represented by Democrat Juan Vargas.
The district currently includes all of Imperial County and the extreme southern portions of San Diego County that run across the U.S.–Mexico border. Cities in the district include National City, Chula Vista and El Centro.
Historical boundaries
In the 1980s, California's 44th Congressional District was one of four that divided San Diego. The district had been held for eight years by Democrat Jim Bates, and was considered the most Democratic district in the San Diego area. Randy "Duke" Cunningham won the Republican nomination and won the general election by just a point, meaning that the San Diego area was represented entirely by Republicans for only the second time since the city was split into three districts after the 1960 U.S. Census.
After the 1990 U.S. Census, the district was renumbered the 51st Congressional District and much of its share of San Diego was moved to the new 50th Congressional District.
List of representatives
| Portrait | Representative | Party | Dates | Notes | |
|---|---|---|---|---|---|
| District created | January 3, 1993 | ||||
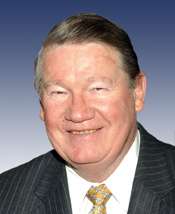 |
Duke Cunningham December 8, 1941 |
Republican | January 3, 1993 – January 3, 2003 |
Redistricted from the 44th district Redistricted to the 50th district | |
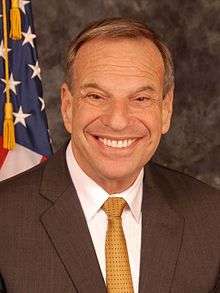 |
Bob Filner September 4, 1942 |
Democratic | January 3, 2003 – December 3, 2012 |
Redistricted from the 50th district Retired to become Mayor of San Diego | |
| Vacant | December 3, 2012 – January 3, 2013 |
||||
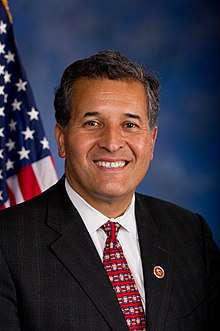 |
Juan Vargas March 7, 1961 |
Democratic | January 3, 2013 – Incumbent |
||
Living former representatives
As of April 2015, two former members of the U.S. House of Representatives from California's 51st congressional district were still living.
| Representative | Term in office | Date of birth (and age) |
|---|---|---|
| Duke Cunningham | 1993–2003 | December 8, 1941 |
| Bob Filner | 2003–2012 | September 4, 1942 |
Elections for representatives
1992
| Party | Candidate | Votes | % | |
|---|---|---|---|---|
| Republican | Duke Cunningham (inc.) | 141,890 | 56.1 | |
| Democratic | Bea Herbert | 85,148 | 33.7 | |
| Libertarian | Bill Holmes | 10,309 | 4.1 | |
| Peace and Freedom | Miriam Clark | 10,307 | 4.1 | |
| Green | Richard Roe | 5,328 | 2.1 | |
| No party | Johnson (write-in) | 13 | 0.0% | |
| Total votes | 262,995 | 100.0 | ||
| Turnout | ||||
| Republican hold | ||||
1994
| Party | Candidate | Votes | % | ± | |
|---|---|---|---|---|---|
| Republican | Duke Cunningham (inc.) | 138,547 | 66.93 | +10.83 | |
| Democratic | Rita K. Tamerius | 57,374 | 27.72 | −5.98 | |
| Libertarian | Bill Holmes | 6,968 | 3.37 | −0.73 | |
| Peace and Freedom | Miriam Clark | 4,099 | 1.98 | −2.12 | |
| Total votes | 206,968 | 100.0 | |||
| Turnout | |||||
| Republican hold | |||||
1996
| Party | Candidate | Votes | % | ± | |
|---|---|---|---|---|---|
| Republican | Duke Cunningham (inc.) | 149,032 | 65.1 | −1.83 | |
| Democratic | Rita Tamerius | 66,250 | 29.0 | +1.28 | |
| Peace and Freedom | Miriam Clark | 5,407 | 2.3 | +0.32 | |
| Libertarian | J.C. Anderson | 5,298 | 2.3 | −1.07 | |
| Natural Law | Eric Bourdette | 3,037 | 1.3 | ||
| Total votes | 215,282 | 100.0 | |||
| Turnout | |||||
| Republican hold | |||||
1998
| Party | Candidate | Votes | % | ± | |
|---|---|---|---|---|---|
| Republican | Duke Cunningham (inc.) | 126,229 | 61.02 | −4.08 | |
| Democratic | Dan Kripke | 71,706 | 34.66 | +5.66 | |
| Libertarian | Jack Anderson | 5,411 | 2.62 | +0.32 | |
| Natural Law | Eric Bourdette | 3,532 | 1.71 | ||
| No party | Don J. Pando (write-in) | 0 | 0.00% | ||
| Total votes | 206,878 | 100.0 | |||
| Turnout | |||||
| Republican hold | |||||
2000
| Party | Candidate | Votes | % | ± | |
|---|---|---|---|---|---|
| Republican | Duke Cunningham (inc.) | 172,291 | 64.4 | +3.38 | |
| Democratic | George "Jorge" Barraza | 81,408 | 30.4 | −4.26 | |
| Libertarian | Daniel L. Muhe | 7,159 | 2.7 | +0.08 | |
| Natural Law | Eric Hunter Bourdette | 6,941 | 2.5 | +0.79 | |
| Total votes | 267,799 | 100.0 | |||
| Turnout | |||||
| Republican hold | |||||
2002
| Party | Candidate | Votes | % | ± | |
|---|---|---|---|---|---|
| Democratic | Bob Filner (incumbent) | 59,541 | 58.0 | ||
| Republican | Maria Guadalupe Garcia | 40,430 | 39.3 | ||
| Libertarian | Jeffrey S. Keup | 2,816 | 2.7 | ||
| Total votes | 102,787 | 100.0 | |||
| Turnout | |||||
| Democratic hold | |||||
2004
| Party | Candidate | Votes | % | ± | |
|---|---|---|---|---|---|
| Democratic | Bob Filner (incumbent) | 111,441 | 61.7 | +3.7 | |
| Republican | Michael Giorgino | 63,526 | 35.1 | −4.2 | |
| Libertarian | Michael S. Metti | 5,912 | 3.2 | +0.5 | |
| Total votes | 180,879 | 100.0 | |||
| Turnout | |||||
| Democratic hold | |||||
2006
| Party | Candidate | Votes | % | ± | |
|---|---|---|---|---|---|
| Democratic | Bob Filner (incumbent) | 78,114 | 67.5 | +4.8 | |
| Republican | Blake L. Miles | 34,931 | 30.1 | −5.0 | |
| Libertarian | Dan Litwin | 2,790 | 2.4 | −0.8 | |
| No party | David Arguello (write-in) | 4 | 0.0% | ||
| Total votes | 115,839 | 100.0 | |||
| Turnout | |||||
| Democratic hold | |||||
2008
| Party | Candidate | Votes | % | ± | |
|---|---|---|---|---|---|
| Democratic | Bob Filner (incumbent) | 148,281 | 72.75 | ||
| Republican | David Lee Joy | 49,345 | 24.21 | ||
| Libertarian | Dan Litwin | 6,199 | 3.04 | ||
| Total votes | 203,825 | 100.00 | |||
| Turnout | |||||
| Democratic hold | |||||
2010
| Party | Candidate | Votes | % | ± | |
|---|---|---|---|---|---|
| Democratic | Bob Filner (incumbent) | 86,411 | 60% | ||
| Republican | Nick Popaditch | 57,480 | 40% | ||
| Total votes | 143,891 | 100% | |||
| Turnout | |||||
| Democratic hold | |||||
2012
| Party | Candidate | Votes | % | ± | |
|---|---|---|---|---|---|
| Democratic | Juan Vargas | 85,672 | 70% | ||
| Republican | Michael Crimmins | 36,649 | 30% | ||
| Total votes | 122,321 | 100% | |||
| Turnout | |||||
| Democratic hold | |||||
2014
| Party | Candidate | Votes | % | ± | |
|---|---|---|---|---|---|
| Democratic | Juan Vargas | 56,373 | 68% | ||
| Republican | Stephen Meade | 25,577 | 32% | ||
| Total votes | 81,950 | 100% | |||
| Turnout | |||||
| Democratic hold | |||||
In statewide races
| Year | Office | District result |
|---|---|---|
| 1992 | President | Bush 40.3–32.3% |
| Senator | Herschensohn 52.1–38.2% | |
| Senator | Seymour 48.0–43.3% | |
| 1994 | Governor | [Data unknown/missing.] |
| Senator | [Data unknown/missing.] | |
| 1996 | President | [Data unknown/missing.] |
| 1998 | Governor | [Data unknown/missing.] |
| Senator | [Data unknown/missing.] | |
| 2000 | President[17] | Bush 55.2–40.5% |
| Senator[18] | Campbell 46.7–46.2% | |
| 2002 | Governor[19] | Davis 53.5–39.7% |
| 2003 | Recall[20][21] | Yes 60.4–39.6% |
| Schwarzenegger 48.8–36.4% | ||
| 2004 | President[22] | Kerry 53.4–45.7% |
| Senator[23] | Boxer 61.0–33.7% | |
| 2006 | Governor[24] | Schwarzenegger 51.6–43.1% |
| Senator[25] | Feinstein 62.6–32.2% | |
| 2008 | President[26] | Obama 63.1–35.5% |
| 2010 | Governor | Brown 56.3–36.3% |
| Senator | Boxer 55.5–37.4% | |
| 2012 | President | Obama 69.4–28.9% |
| 2016 | President | Clinton 71.8–22.8% |
See also
References
- ↑ "American Fact Finder - Results". United States Census Bureau. Retrieved May 20, 2015.
- ↑ "American Fact Finder - Results". United States Census Bureau. Retrieved May 20, 2015.
- ↑ http://www.latimes.com/la-redistricting-map-july-2011,0,5339409.htmlstory#39.71057374407184,-118.14590136718749,5,usCongress,,,current
- ↑ "Partisan Voting Index – Districts of the 115th Congress" (PDF). The Cook Political Report. April 7, 2017. Retrieved April 7, 2017.
- ↑ 1992 election results
- ↑ 1994 election results
- ↑ 1996 election results
- ↑ 1998 election results
- ↑ 2000 election results
- ↑ 2002 general election results Archived February 3, 2009, at the Wayback Machine.
- ↑ 2004 general election results
- ↑ 2006 general election results Archived November 27, 2008, at the Wayback Machine.
- ↑ "Archived copy" (PDF). Archived from the original (PDF) on December 21, 2008. Retrieved 2009-03-12.
- ↑
- ↑
- ↑ "Archived copy". Archived from the original on November 6, 2014. Retrieved November 6, 2014.
- ↑ Statement of Vote (2000 President) Archived June 11, 2007, at the Wayback Machine.
- ↑ Statement of Vote (2000 Senator) Archived June 11, 2007, at the Wayback Machine.
- ↑ Statement of Vote (2002 Governor) Archived November 11, 2010, at the Wayback Machine.
- ↑ Statement of Vote (2003 Recall Question) Archived May 20, 2011, at the Wayback Machine.
- ↑ Statement of Vote (2003 Governor) Archived May 20, 2011, at the Wayback Machine.
- ↑ Statement of Vote (2004 President) Archived August 1, 2010, at the Wayback Machine.
- ↑ Statement of Vote (2004 Senator) Archived August 10, 2011, at the Wayback Machine.
- ↑ Statement of Vote (2006 Governor) Archived August 10, 2011, at the Wayback Machine.
- ↑ Statement of Vote (2006 Senator) Archived August 10, 2011, at the Wayback Machine.
- ↑ President)