Balearic regional election, 1983
|
| |||||||||||||||||||||||||||||||||||||||||||||||||||||||||||||||||||||
| |||||||||||||||||||||||||||||||||||||||||||||||||||||||||||||||||||||
All 54 seats in the Parliament of the Balearic Islands 28 seats needed for a majority | |||||||||||||||||||||||||||||||||||||||||||||||||||||||||||||||||||||
|---|---|---|---|---|---|---|---|---|---|---|---|---|---|---|---|---|---|---|---|---|---|---|---|---|---|---|---|---|---|---|---|---|---|---|---|---|---|---|---|---|---|---|---|---|---|---|---|---|---|---|---|---|---|---|---|---|---|---|---|---|---|---|---|---|---|---|---|---|---|
| Opinion polls | |||||||||||||||||||||||||||||||||||||||||||||||||||||||||||||||||||||
| Registered | 488,336 | ||||||||||||||||||||||||||||||||||||||||||||||||||||||||||||||||||||
| Turnout | 315,795 (64.7%) | ||||||||||||||||||||||||||||||||||||||||||||||||||||||||||||||||||||
| |||||||||||||||||||||||||||||||||||||||||||||||||||||||||||||||||||||
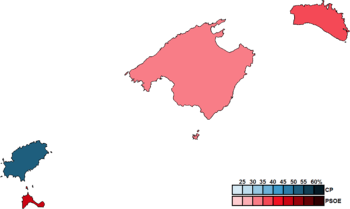 Constituency results map for the Parliament of the Balearic Islands | |||||||||||||||||||||||||||||||||||||||||||||||||||||||||||||||||||||
| |||||||||||||||||||||||||||||||||||||||||||||||||||||||||||||||||||||
.jpg)
.jpg)

.jpg)
The 1983 Balearic regional election was held on Sunday, 8 May 1983, to elect the 1st Parliament of the Autonomous Community of the Balearic Islands. All 54 seats in the Parliament were up for election. The election was held simultaneously with regional elections in twelve other autonomous communities and local elections all throughout Spain.
The regional picture, at first glance, had been dominated by the Union of the Democratic Centre (UCD), heading the pre-autonomic government since 1978 and having won the 1979 elections to the Mallorca and Menorca Island Councils. However, the UCD was dissolved in early 1983 after its disastrous defeat in the 1982 Spanish general election, with its supporters fleeing to the People's Alliance (AP), the People's Democratic Party (PDP) or, as one of its erstwhile leaders, the newly founded Majorcan Union (UM). Other parties which had also contested the Island Council elections four year previously were regional branch of the Spanish Socialist Workers' Party, the Socialist Party of Majorca or the Communist Party of the Balearic Islands. There was no electoral law passed, but the 1983 Statute of Autonomy did provide for a provisional distribution of seats per island until the community could have its own electoral law.
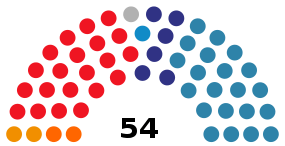
The Socialists won the islands of Mallorca, Menorca and Formentera, but its lead over its competitors there was so small that the broad People's Coalition (AP–PDP–UL) victory in Ibiza provided for a centre-right narrow victory overall. The AP–PDP–UL coalition emerged as the largest force with 21 seats, followed closely by the PSOE with another 21 seats and UM with 6. The centre-right candidate, Gabriel Cañellas, was able to access the regional government thanks to support from UM, the Liberal Democratic Party (PDL) and the Menorcan Independent Candidacy (CIM).
Overview
Electoral system
The Parliament of the Balearic Islands was the devolved, unicameral legislature of the autonomous community of the Balearic Islands, having legislative power in regional matters as defined by the Spanish Constitution and the Balearic Statute of Autonomy, as well as the ability to vote confidence in or withdraw it from a President of the Government.[1] Voting for the Parliament was on the basis of universal suffrage, which comprised all nationals over eighteen, registered in the Balearic Islands and in full enjoyment of their political rights.
The 54 members of the Parliament of the Balearic Islands were elected using the D'Hondt method and a closed list proportional representation, with a threshold of 3 percent of valid votes—which included blank ballots—being applied in each constituency. Parties not reaching the threshold were not taken into consideration for seat distribution. Seats were allocated to constituencies, corresponding to the islands of Mallorca, Menorca, Ibiza and Formentera. Each constituency was allocated a fixed number of seats: 30 for Mallorca, 12 for Menorca, 11 for Ibiza and 1 for Formentera.[1]
The electoral law provided that parties, federations, coalitions and groupings of electors were allowed to present lists of candidates. However, groupings of electors were required to secure the signature of at least 0.1 percent of the electors registered in the constituency for which they sought election—needing to secure, in any case, the signature of 500 electors—. Electors were barred from signing for more than one list of candidates. Concurrently, parties and federations intending to enter in coalition to take part jointly at an election were required to inform the relevant Electoral Commission within fifteen days of the election being called.[2]
Election date
The Inter-island General Council, in agreement with the Government of Spain, was required to call an election to the Parliament of the Balearic Islands before 31 May 1983. In the event of an investiture process failing to elect a regional President within a sixty-day period from the first ballot, the Parliament was to be automatically dissolved and a snap election called, with elected deputies merely serving out what remained of their four-year terms.[1]
Opinion polls
The table below lists voting intention estimates in reverse chronological order, showing the most recent first and using the dates when the survey fieldwork was done, as opposed to the date of publication. Where the fieldwork dates are unknown, the date of publication is given instead. The highest percentage figure in each polling survey is displayed with its background shaded in the leading party's colour. If a tie ensues, this is applied to the figures with the highest percentages. The "Lead" column on the right shows the percentage-point difference between the parties with the highest percentages in a given poll. When available, seat projections are also displayed below the voting estimates in a smaller font. 28 seats were required for an absolute majority in the Parliament of the Balearic Islands.
| Polling firm/Commissioner | Fieldwork date | Sample size | Turnout | PSM | UM | CIM | Lead | ||||
|---|---|---|---|---|---|---|---|---|---|---|---|
| 1983 regional election | 8 May 1983 | N/A | 64.7 | 34.7 21 |
35.6 21 |
2.1 0 |
6.7 4 |
15.1 6 |
1.3 1 |
1.0 1 |
0.9 |
| Sofemasa/El País[p 1][p 2] | 23–26 Apr 1983 | ? | ? | ? 26/33 |
? 15/19 |
– | ? 5/7 |
– | – | – | ? |
| 1982 general election | 28 Oct 1982 | N/A | 79.7 | 40.5 | 37.7 | 5.3 | 2.4 | – | – | – | 2.8 |
Results
Overall
 | ||||||
| Parties and coalitions | Popular vote | Seats | ||||
|---|---|---|---|---|---|---|
| Votes | % | ±pp | Total | +/− | ||
| People's Coalition (AP–PDP–UL) | 110,629 | 35.58 | n/a | 21 | n/a | |
| Spanish Socialist Workers' Party (PSOE) | 107,906 | 34.71 | n/a | 21 | n/a | |
| Majorcan Union (UM) | 46,915 | 15.09 | n/a | 6 | n/a | |
| Socialist Party of Majorca–Socialist Party of the Islands (PSM–PSI) | 16,979 | 5.46 | n/a | 2 | n/a | |
| Communist Party of the Balearic Islands (PCIB) | 7,669 | 2.47 | n/a | 0 | n/a | |
| Democratic and Social Centre (CDS) | 6,611 | 2.13 | n/a | 0 | n/a | |
| Liberal Democratic Party (PDL) | 3,896 | 1.25 | n/a | 1 | n/a | |
| Socialist Party of Menorca (PSM) | 3,732 | 1.20 | n/a | 2 | n/a | |
| Menorcan Independent Candidacy (CIM) | 3,250 | 1.05 | n/a | 1 | n/a | |
| Spanish Communist Workers' Party (PCOE) | 1,509 | 0.49 | n/a | 0 | n/a | |
| Blank ballots | 1,820 | 0.59 | n/a | |||
| Total | 310,916 | 54 | n/a | |||
| Valid votes | 310,916 | 98.46 | n/a | |||
| Invalid votes | 4,879 | 1.54 | n/a | |||
| Votes cast / turnout | 315,795 | 64.67 | n/a | |||
| Abstentions | 172,541 | 35.33 | n/a | |||
| Registered voters | 488,336 | |||||
| Sources[3][4] | ||||||
Distribution by constituency
| Constituency | CP | PSOE | UM | PSM–PSI | PDL | PSM | CIM | |||||||
|---|---|---|---|---|---|---|---|---|---|---|---|---|---|---|
| % | S | % | S | % | S | % | S | % | S | % | S | % | S | |
| Formentera | 39.2 | − | 49.1 | 1 | 11.5 | − | ||||||||
| Ibiza | 51.5 | 6 | 30.7 | 4 | 14.6 | 1 | ||||||||
| Mallorca | 34.3 | 11 | 34.7 | 11 | 18.3 | 6 | 6.6 | 2 | ||||||
| Menorca | 32.7 | 4 | 37.7 | 5 | 13.5 | 2 | 11.7 | 1 | ||||||
| Total | 35.6 | 21 | 34.7 | 21 | 16.3 | 7 | 5.5 | 2 | 1.3 | 1 | 1.2 | 2 | 1.1 | 1 |
Aftermath
Investiture vote
| Candidate: Gabriel Cañellas | |||
|---|---|---|---|
| Choice | Vote | ||
| Parties | Votes | ||
| AP–PDP–UL (21), UM (6), PDL (1), CIM (1) | 29 / 54 | ||
| No | PSOE (21), PSM (2), PSM (2) | 25 / 54 | |
| Abstentions | 0 / 54 | ||
| Source: historiaelectoral.com | |||
References
- Opinion poll sources
- ↑ "El PSOE vuelve a distanciarse de la coalición de Fraga". El País (in Spanish). 1 May 1983.
- ↑ "Ficha técnica de los sondeos". El País (in Spanish). 1 May 1983.
- Other
- 1 2 3 "Statute of Autonomy of the Balearic Islands of 1983". Organic Law No. 2 of 25 February 1983. Official State Gazette (in Spanish). Retrieved 13 September 2017.
- ↑ "Electoral Rules Decree of 1977". Royal Decree-Law No. 20 of 18 March 1977. Official State Gazette (in Spanish). Retrieved 27 December 2016.
- ↑ "Regional elections, 1983. Balearic Islands". www.caib.es (in Catalan). Government of the Balearic Islands. Retrieved 28 September 2017.
- ↑ "Parliament of the Balearic Islands and Island Council elections since 1979". historiaelectoral.com (in Catalan). Electoral History. Retrieved 28 September 2017.
| Regional elections | |
|---|---|
| General elections | |
| European Parliament elections | |
| Local elections | |