Alberta municipal censuses, 2017
|
| ||
| ||
|
| ||
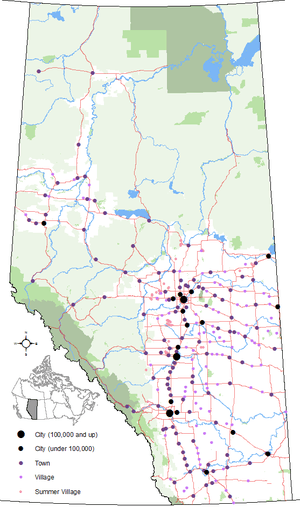 Distribution of Alberta's 269 urban municipalities | ||
Alberta has provincial legislation allowing its municipalities to conduct municipal censuses between April 1 and June 30 inclusive.[1][2] Municipalities choose to conduct their own censuses for multiple reasons such as to better inform municipal service planning and provision, to capitalize on per capita based grant funding from higher levels of government, or to simply update their populations since the last federal census.[3]
Alberta began the year of 2017 with 354 municipalities.[4] Of these, 35 (9.9%) conducted a municipal census in 2017. Alberta Municipal Affairs recognized those conducted by 34 of these municipalities.[5] By municipal status, it recognized those conducted by 7 of Alberta's 18 cities, 16 of 107 towns, 10 of 87 villages, 1 of its 51 summer villages, and 1 of 64 municipal districts.[5][lower-alpha 1]
Some municipalities achieved population milestones as a result of their 2017 censuses. Fort Saskatchewan exceeded 25,000 residents, while Chestermere surpassed 20,000 people and Crossfield grew beyond the 3,000 mark for the first time.
Municipal census results
The following summarizes the results of the numerous municipal censuses conducted in 2017.
| 2017 municipal census summary[5] | 2016 federal census comparison[6] | Previous municipal census comparison[7][8][9][10][11][12] | |||||||||
|---|---|---|---|---|---|---|---|---|---|---|---|
| Municipality | Status | Census date |
2017 pop. |
2016 pop. |
Absolute growth |
Absolute change |
Annual growth rate |
Prev. pop. |
Prev. census year |
Absolute growth |
Annual growth rate |
| Airdrie | City | April 1, 2017 | 64,922 | 61,581 | 3,341 | 5.4% | 5.4% | 61,842 | 2016 | 3,080 | 5.0% |
| Banff | Town | June 12, 2017 | 8,875 | 7,851 | 1,024 | 13% | 13.0% | 8,421 | 2014 | 454 | 1.8% |
| Beaumont | Town | April 15, 2017 | 18,320 | 17,396 | 924 | 5.3% | 5.3% | 17,720 | 2016 | 600 | 3.4% |
| Big Valley | Village | May 1, 2017 | 349 | 346 | 3 | 0.9% | 0.9% | 347 | 2015 | 2 | 0.3% |
| Blackfalds | Town | May 15, 2017 | 9,916 | 9,328 | 588 | 6.3% | 6.3% | 9,510 | 2016 | 406 | 4.3% |
| Bonnyville | Town | April 1, 2017 | 6,422 | 5,975[13] | 447 | 7.5% | 7.5% | 6,921 | 2014 | −499 | −2.5% |
| Bow Island | Town | April 1, 2017 | 2,043 | 1,983 | 60 | 3% | 3.0% | 1,868 | 2007 | 175 | 0.9% |
| Calgary | City | April 1, 2017 | 1,246,337 | 1,239,220 | 7,117 | 0.6% | 0.6% | 1,235,171 | 2016 | 11,166 | 0.9% |
| Carbon | Village | May 1, 2017 | 500 | 454 | 46 | 10.1% | 10.1% | 501 | 2000 | −1 | 0.0% |
| Carmangay | Village | May 19, 2017 | 250 | 242 | 8 | 3.3% | 3.3% | 262 | 2013 | −12 | −1.2% |
| Chestermere | City | May 1, 2017 | 20,331 | 19,887 | 444 | 2.2% | 2.2% | 19,715 | 2016 | 616 | 3.1% |
| Cochrane | Town | April 3, 2017 | 26,320 | 25,853 | 467 | 1.8% | 1.8% | 25,122 | 2016 | 1,198 | 4.8% |
| Crossfield | Town | May 8, 2017 | 3,055 | 2,983 | 72 | 2.4% | 2.4% | 2,918 | 2014 | 137 | 1.5% |
| Edgerton | Village | May 10, 2017 | 425 | 384 | 41 | 10.7% | 10.7% | 401 | 2012 | 24 | 1.2% |
| Empress | Village | 160[14] | 135 | 25 | 18.5% | 18.5% | 254 | 1983 | −94 | −1.4% | |
| Fort Saskatchewan | City | April 3, 2017 | 25,533 | 24,149 | 1,384 | 5.7% | 5.7% | 24,569 | 2016 | 964 | 3.9% |
| Girouxville | Village | May 1, 2017 | 289 | 219 | 70 | 32% | 32.0% | 315 | 1976 | −26 | −0.2% |
| High Level | Town | May 1, 2017 | 3,992 | 3,159 | 833 | 26.4% | 26.4% | 3,823 | 2015 | 169 | 2.2% |
| Horseshoe Bay | Summer village | May 1, 2017 | 73 | 49 | 24 | 49% | 49.0% | 46 | 2001 | 27 | 2.9% |
| Innisfree | Village | May 15, 2017 | 223 | 193 | 30 | 15.5% | 15.5% | 267 | 1977 | −44 | −0.4% |
| Leduc | City | April 1, 2017 | 31,130 | 29,993 | 1,137 | 3.8% | 3.8% | 30,498 | 2016 | 632 | 2.1% |
| Lethbridge | City | April 1, 2017 | 98,198 | 92,729 | 5,469 | 5.9% | 5.9% | 96,828 | 2016 | 1,370 | 1.4% |
| Magrath | Town | April 24, 2017 | 2,435 | 2,374 | 61 | 2.6% | 2.6% | 2,398 | 2015 | 37 | 0.8% |
| Marwayne | Village | May 15, 2017 | 606 | 564 | 42 | 7.4% | 7.4% | 667 | 2013 | −61 | −2.4% |
| McLennan | Town | May 1, 2017 | 791 | 701 | 90 | 12.8% | 12.8% | 957 | 1997 | −166 | −0.9% |
| Oyen | Town | June 5, 2017 | 1,022 | 1,001 | 21 | 2.1% | 2.1% | 1,006 | 2015 | 16 | 0.8% |
| Raymond | Town | April 10, 2017 | 4,037 | 3,708 | 329 | 8.9% | 8.9% | 4,202 | 2016 | −165 | −3.9% |
| Rosemary | Village | [lower-alpha 2] | 396 | 421 | 2012 | ||||||
| Spruce Grove | City | April 5, 2017 | 34,881 | 34,066 | 815 | 2.4% | 2.4% | 33,640 | 2016 | 1,241 | 3.7% |
| St. Paul | Town | April 10, 2017 | 5,963 | 5,827 | 136 | 2.3% | 2.3% | 6,004 | 2014 | −41 | −0.2% |
| County of St. Paul No. 19 | Municipal district | April 18, 2017 | 6,468 | 6,036 | 432 | 7.2% | 7.2% | 6,168 | 2012 | 300 | 1.0% |
| Stirling | Village | June 1, 2017 | 1,269 | 978 | 291 | 29.8% | 29.8% | 1,147 | 2013 | 122 | 2.6% |
| Thorsby | Town | April 1, 2017 | 1,015 | 985 | 30 | 3% | 3.0% | 1,025 | 2015 | −10 | −0.5% |
| Two Hills | Town | May 15, 2017 | 1,443 | 1,352 | 91 | 6.7% | 6.7% | 1,431 | 2012 | 12 | 0.2% |
| Vermilion | Town | April 1, 2017 | 4,150 | 4,084 | 66 | 1.6% | 1.6% | 4,545 | 2012 | −395 | −1.8% |
| Veteran | Village | May 29, 2017 | 239 | 207 | 32 | 15.5% | 15.5% | 318 | 1982 | −79 | −0.8% |
See also
Notes
- ↑ No censuses were conducted among Alberta's 5 specialized municipalities, 3 special areas and 8 improvement districts.[5]
- ↑ The Village of Rosemary indicated it was going to conduct a municipal census in 2017,[15] though no completion of this census was reported by Alberta Municipal Affairs.[5]
References
- ↑ "Municipal Government Act: Revised Statutes of Alberta 2000 Chapter M-26 (Office Consolidation)" (PDF). Alberta Queen's Printer. November 24, 2010. Retrieved February 4, 2017.
- ↑ "Municipal Government Act: Determination of Population Regulation, Alberta Regulation 63/2001 (Office Consolidation)" (PDF). Alberta Queen's Printer. 2013. p. 3. Retrieved February 4, 2017.
- ↑ "Municipal Census Manual: Requirements and Guidelines for Conducting a Municipal Census" (PDF). Alberta Municipal Affairs. February 2015. p. 7. ISBN 978-1-4601-2127-6. Retrieved February 4, 2017.
- ↑ "2017 Municipal Codes" (PDF). Alberta Municipal Affairs. January 12, 2017. Retrieved February 4, 2017.
- 1 2 3 4 5 "2017 Municipal Affairs Population List" (PDF). Alberta Municipal Affairs. ISBN 978-1-4601-3652-2. Retrieved January 12, 2018.
- ↑ "Population and dwelling counts, for Canada, provinces and territories, and census subdivisions (municipalities), 2016 and 2011 censuses (Alberta)". Statistics Canada. February 8, 2017. Missing or empty
|url=(help) - ↑ "2016 Municipal Affairs Population List" (PDF). Alberta Municipal Affairs. ISBN 978-1-4601-3127-5. Retrieved February 4, 2017.
- ↑ "2011 Municipal Affairs Population List" (PDF). Alberta Municipal Affairs. October 5, 2011. ISBN 978-0-7785-9738-4. Retrieved April 19, 2017.
- ↑ "2001 Official Population List" (PDF). Alberta Municipal Affairs. September 4, 2001. ISBN 978-0-7785-9738-4. Retrieved April 20, 2017.
- ↑ "1986 Official Population" (PDF). Alberta Municipal Affairs. Retrieved April 20, 2017.
- ↑ "1977 Official Population" (PDF). Alberta Municipal Affairs. Retrieved January 13, 2018.
- ↑ "1976 Official Population" (PDF). Alberta Municipal Affairs. Retrieved January 13, 2018.
- ↑ "Population and dwelling count amendments, 2016 Census". Statistics Canada. October 6, 2017. Retrieved January 12, 2018.
- ↑ "2017 Municipal Census". Village of Empress. Retrieved June 2, 2017.
- ↑ Michelle Gietz. "Area population up over 5% since 2011". Brooks Bulletin. Retrieved February 17, 2017.
That census counted 421 people in the Village of Rosemary compared to 396 people recorded by Statistics Canada in 2016. "We are going to have another municipal census this year to confirm the numbers," comments Zacharias.