Ajax—Pickering (provincial electoral district)
 | |
| Coordinates: |
43°51′02″N 79°01′27″W / 43.85056°N 79.02417°WCoordinates: 43°51′02″N 79°01′27″W / 43.85056°N 79.02417°W Location of the constituency office (as of 12 July 2010) |
| Defunct provincial electoral district | |
| Legislature | Legislative Assembly of Ontario |
| District created | 2005 |
| First contested | 2007 |
| Last contested | 2014 |
| Demographics | |
| Population (2011) | 137,215 |
| Electors (2011) | 92,745 |
| Area (km²) | 286 |
| Census divisions | Durham |
| Census subdivisions | Ajax, Pickering |
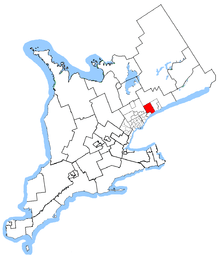
Ajax—Pickering was a provincial electoral district in central Ontario, Canada. It was first contested in the 2007 provincial election. 55.2% of the riding came from Pickering—Ajax—Uxbridge while 44.8% came from Whitby—Ajax.
The riding included all of the Town of Ajax plus that part of the City of Pickering north of Finch Avenue and east of Brock Road, as well as the area north of Highway 401 and east of Valley Farm Road.
In 2018, the district was dissolved into Pickering—Uxbridge and Ajax.
Members of Provincial Parliament
| Ajax—Pickering | ||||
|---|---|---|---|---|
| Assembly | Years | Member | Party | |
| Riding created from Pickering—Ajax—Uxbridge and Whitby—Ajax | ||||
| 39th | 2007–2011 | Joe Dickson | Liberal | |
| 40th | 2011–2014 | |||
| 41st | 2014–2018 | |||
| Riding dissolved into Pickering—Uxbridge and Ajax | ||||
Election results
| Ontario general election, 2014 | ||||||||
|---|---|---|---|---|---|---|---|---|
| Party | Candidate | Votes | % | ±% | ||||
| Liberal | Joe Dickson | 26,257 | 51.06 | +3.72 | ||||
| Progressive Conservative | Todd McCarthy | 14,999 | 29.17 | −6.17 | ||||
| New Democratic | Jermaine King | 8,274 | 16.09 | +1.72 | ||||
| Green | Adam Narraway | 1,589 | 3.09 | +1.06 | ||||
| Libertarian | Kyle Stewart | 301 | 0.59 | −0.13 | ||||
| Total valid votes | 51,420 | 100.0 | +23.94 | |||||
| Total rejected, unmarked and declined ballots | 580 | 1.12 | +0.71 | |||||
| Turnout | 52,000 | 50.18 | +5.38 | |||||
| Eligible voters | 103,629 | +11.74 | ||||||
| Liberal hold | Swing | +4.95 | ||||||
Source(s)
Elections Ontario. "Official Return from the Records, 001 Ajax—Pickering" (PDF). Retrieved March 21, 2015.
| ||||||||
| Ontario general election, 2011 | ||||||||
|---|---|---|---|---|---|---|---|---|
| Party | Candidate | Votes | % | ±% | ||||
| Liberal | Joe Dickson | 19,606 | 47.34 | −1.74 | ||||
| Progressive Conservative | Todd McCarthy | 14,718 | 35.54 | +1.19 | ||||
| New Democratic | Evan Wiseman | 5,952 | 14.37 | +6.28 | ||||
| Green | Steven Toman | 843 | 2.04 | −5.54 | ||||
| Libertarian | Andrew Delis | 299 | 0.72 | |||||
| Total valid votes | 41,418 | 100.0 | +2.36 | |||||
| Total rejected, unmarked and declined ballots | 172 | 0.41 | −0.07 | |||||
| Turnout | 41,590 | 44.8 | −4.5 | |||||
| Eligible voters | 92,745 | +12.53 | ||||||
| Liberal hold | Swing | −1.47 | ||||||
Source(s)
"Summary of Valid Votes Cast for Each Candidate – October 6, 2011 General Election" (PDF). Elections Ontario. Nov 18, 2011. Retrieved May 9, 2014.
"Statistical Summary – General Elections 2011" ( | ||||||||
| Ontario general election, 2007 | ||||||||
|---|---|---|---|---|---|---|---|---|
| Party | Candidate | Votes | % | |||||
| Liberal | Joe Dickson | 19,857 | 49.07 | |||||
| Progressive Conservative | Kevin Ashe | 13,898 | 34.35 | |||||
| New Democratic | Bala Thavarajasoorier | 3,275 | 8.09 | |||||
| Green | Cecile Willert | 3,067 | 7.58 | |||||
| Family Coalition | Andrew Carvalho | 368 | 0.91 | |||||
| Total valid votes | 40,465 | 100.0 | ||||||
| Total rejected ballots | 197 | 0.48 | ||||||
| Turnout | 40,662 | 49.3 | ||||||
| Eligible voters | 82,416 | |||||||
Source(s)
"Summary of Valid Votes Cast for Each Candidate – October 10, 2007 General Election" (PDF). Elections Ontario. Aug 14, 2008. Retrieved May 9, 2014.
"Statistical Summary – General Elections 2007" (PDF). Elections Ontario. May 8, 2008. Retrieved May 9, 2014. | ||||||||
2007 electoral reform referendum
| Ontario electoral reform referendum, 2007 | |||
|---|---|---|---|
| Side | Votes | % | |
| First Past the Post | 24,946 | 63.0 | |
| Mixed member proportional | 14,657 | 37.0 | |
| Total valid votes | 39,603 | 100.0 | |
This article is issued from
Wikipedia.
The text is licensed under Creative Commons - Attribution - Sharealike.
Additional terms may apply for the media files.