Economy of Tunisia
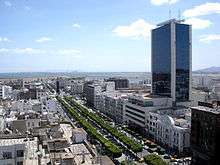 Tunis | |
| Currency | Tunisian dinar (TND) |
|---|---|
| Statistics | |
| GDP |
$40.29 billion nominal (2017)[1] $136.8 billion PPP (2017) [1] |
GDP growth |
1.0% (2015), 1.2% (2016), 1.9% (2017e), 2.4% (2018f) [2] |
GDP per capita | $3,553 (2017)[1] |
GDP by sector | agriculture: 11%; industry: 35.3%; services: 53.7% (2009 est.) |
|
7.6% (March 2018)[3] | |
Population below poverty line | 15.5% (2010)[4] |
|
36.1 (2010)[5] | |
Labour force | 3.315 million (2013) |
Labour force by occupation | agriculture: 18.3%; industry: 31.9%; services: 49.8% (2009 est.) |
| Unemployment |
14.7% (December 2017)[6] |
| $275 monthly (2017)[7] | |
Main industries | petroleum, mining (particularly phosphate and iron ore), tourism, textiles, footwear, agribusiness, beverages |
|
| |
| External | |
| Exports |
$12.9 billion (2016)[9] |
Export goods | clothing, semi-finished goods and textiles, agricultural products, mechanical goods, phosphates and chemicals, hydrocarbons, electrical equipment |
Main export partners |
|
| Imports |
$18.8 billion (2016)[9] |
Import goods | textiles, machinery and equipment, hydrocarbons, chemicals, foodstuffs |
Main import partners |
|
FDI stock | $31.86 billion (31 December 2009 est.) |
Gross external debt | $27.86 billion (2014)[12] |
| Public finances | |
| 50.03% of GDP (2014)[13] | |
| Revenues | $11.89 billion (2014) |
| Expenses | $13.66 billion (2014)[13] |
Foreign reserves | US$7.047 billion (October 2015)[16] |
Tunisia is in the process of economic reform and liberalization after decades of heavy state direction and participation in the economy. Prudent economic and fiscal planning have resulted in moderate but sustained growth for over a decade. Tunisia's economic growth historically has depended on oil, phosphates, agri-food products, car parts manufacturing, and tourism. In the World Economic Forum Global Competitiveness Report for 2015-2016, Tunisia ranks in 92nd place.[17] Based on HDI latest report (for 2014), Tunisia ranks 96th globally and 5th in Africa.
The year 2015 was marked by terrorist attacks in Tunisia which are likely to affect economic growth, especially in tourism, one of the main sectors.[18]
Historical trend
GDP per capita soared by more than 380% in the seventies (1970–1980: USD 280–1,369). But this proved unsustainable and it collapsed to a cumulative 10% growth in the turbulent eighties (1980–1990: USD 1,369–1,507), rising again to almost 50% cumulative growth in the nineties (1990–2000: USD 1,507–2,245), signifying the impact of successful diversification.[19]
Growing foreign debt and the foreign exchange crisis in the mid-1980s led the government to launch a structural adjustment program to liberalize prices, reduce tariffs, and reorient Tunisia toward a market economy in 1986. Tunisia's economic reform program was lauded as a model by international financial institutions. The government liberalized prices, reduced tariffs, lowered debt-service-to-exports and debt-to-GDP ratios, and extended the average maturity of its $10 billion foreign debt. Structural adjustment brought additional lending from the World Bank and other Western creditors. In 1990, Tunisia acceded to the General Agreement on Tariffs and Trade (GATT) and is a member of the World Trade Organization (WTO).
In 1996 Tunisia entered into an "Association Agreement" with the European Union (EU) which removed tariff and other trade barriers on most goods by 2008. In conjunction with the Association Agreement, the EU is assisting the Tunisian government's Mise A Niveau (upgrading) program to enhance the productivity of Tunisian businesses and prepare for competition in the global marketplace.
The government totally or partially privatized around 160 state-owned enterprises after the privatization program was launched in 1987. Although the program is supported by the GATT, the government had to move carefully to avoid mass firings. Unemployment continued to plague Tunisia's economy and was aggravated by a rapidly growing work force. An estimated 55% of the population is under the age of 25. Officially, 15.2% of the Tunisian work force is unemployed.
In 2011, after the Arab Spring, the economy slumped but then recovered with 2.81% GDP growth in 2014. However, unemployment is still one of the major issues with 15.2% of the labor force unemployed as of the first quarter of 2014. Tunisia’s political transition gained new momentum in early 2014, with the resolution of a political deadlock, the adoption of a new Constitution and the appointment of a new government. The national dialogue platform, brokered by key civil society organizations, played a crucial role in gathering all major political parties. This consensus will allow for further reform in the economy and public sector.
In 2015, the Bardo National Museum attack led to the collapse of the third largest sector of Tunisia's economy,[20] tourism. Tunisian tourist workers in Tunis have said that "tourism is dead, it is completely dead" expressing the severe drop in tourism after the attack.[21]
The following table shows the main economic indicators in 1980–2017. Inflation under 5 % is in green.[22]
| Year | GDP (in Bil. US$ PPP) |
GDP per capita (in US$ PPP) |
GDP growth (real) |
Inflation rate (in Percent) |
Unemployment (in Percent) |
Government debt (in % of GDP) |
|---|---|---|---|---|---|---|
| 1980 | 13.6 | 2,127 | n/a | n/a | ||
| 1981 | n/a | n/a | ||||
| 1982 | n/a | n/a | ||||
| 1983 | n/a | n/a | ||||
| 1984 | n/a | n/a | ||||
| 1985 | n/a | n/a | ||||
| 1986 | n/a | n/a | ||||
| 1987 | n/a | n/a | ||||
| 1988 | n/a | n/a | ||||
| 1989 | n/a | n/a | ||||
| 1990 | 16.2 % | n/a | ||||
| 1991 | 66.4 % | |||||
| 1992 | ||||||
| 1993 | ||||||
| 1994 | ||||||
| 1995 | ||||||
| 1996 | ||||||
| 1997 | ||||||
| 1998 | ||||||
| 1999 | ||||||
| 2000 | ||||||
| 2001 | ||||||
| 2002 | ||||||
| 2003 | ||||||
| 2004 | ||||||
| 2005 | ||||||
| 2006 | ||||||
| 2007 | ||||||
| 2008 | ||||||
| 2009 | ||||||
| 2010 | ||||||
| 2011 | ||||||
| 2012 | ||||||
| 2013 | ||||||
| 2014 | ||||||
| 2015 | ||||||
| 2016 | ||||||
| 2017 |
External trade and investment
In 1992, Tunisia re-entered the private international capital market for the first time in 6 years, securing a $10-million line of credit for balance-of-payments support. In January 2003 Standard & Poor's affirmed its investment grade credit ratings for Tunisia. The World Economic Forum 2002-03 ranked Tunisia 34th in the Global Competitiveness Index Ratings (two places behind South Africa, the continent's leader). In April 2002, Tunisia's first US dollar-denominated sovereign bond issue since 1997 raised $458 million, with maturity in 2012.
The Bourse de Tunis is under the control of the state-run Financial Market Council and lists over 50 companies. The government offers substantial tax incentives to encourage companies to join the exchange, and expansion is occurring.
The Tunisian government adopted a unified investment code in 1993 to attract foreign capital. More than 1,600 export-oriented joint venture firms operate in Tunisia to take advantage of relatively low labor costs and preferential access to nearby European markets. Economic links are closest with European countries, which dominate Tunisia's trade. Tunisia's currency, the dinar, is not traded outside Tunisia. However, partial convertibility exists for bona fide commercial and investment transaction. Certain restrictions still limit operations carried out by Tunisian residents.
The stock market capitalisation of listed companies in Tunisia was valued at $5.3 Billion in 2007, 15% of 2007 GDP, by the World Bank.[23]
For 2007, foreign direct investment totaled TN Dinar 2 billion in 2007, or 5.18% of the total volume of investment in the country. This figure is up 35.7% from 2006 and includes 271 new foreign enterprises and the expansion of 222 others already based in the country.
The economic growth rate seen for 2007, at 6.3% is the highest achieved in a decade.
In November 29 and 30th, Tunisia held an investment conference with country chiefs from all around the world with pledges that have reached $30 billion to finance new public projects.[24]
Loan Guarantee[25]
On April 20, 2012, U.S. Treasury Secretary[26] and Tunisian Finance Minister Houcine Dimassi signed a declaration of intent[27] to move forward on a U.S. loan guarantee for Tunisia. The U.S. Government would provide this loan guarantee to enable the Tunisian government to access significant market financing at affordable rates and favorable maturities with the backing of a U.S. guarantee of principal and interest (up to 100 percent).
The support would consist of the U.S. guarantee of Tunisian government-issued debt (or of bank loans made to the Government of Tunisia). This guarantee will significantly reduce the Tunisian government's borrowing costs at a time when market access has become more expensive for many emerging market countries. In the weeks ahead, both governments intend to make progress on a loan guarantee agreement that would allow Tunisia to move forward with a debt issuance.
The ceremony took place at the World Bank immediately following the meeting of Finance Ministers of the Deauville Partnership with Arab Countries in Transition.
Electricity
- Production: 16.13 Billion kWh (2011)[28]
- Production by source:
- fossil fuel: 96.8% (2010)
- hydro: 1.7% (2010)
- other: 1.5% (2010)
- Consumption: 13.29 billion kWh (2010)
- Exports: None (2010)
- Imports: 19 million kWh (2010)
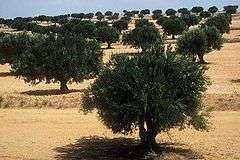
Agriculture
Agriculture - products: olives, grain, tomatoes, citrus fruit, sugar beets, dates, almonds,
See also
References
- 1 2 3 "Report for Selected Countries and Subjects". www.imf.org.
- ↑ "World Bank forecasts for Tunisia, June 2018 (p. 152)" (PDF). World Bank. Retrieved 6 September 2018.
- ↑ tradingeconomics.com/tunisia/inflation-cpi
- ↑ "Archived copy" (PDF). Archived from the original (PDF) on 24 September 2015. Retrieved 29 October 2014.
- ↑ "GINI index (World Bank estimate) - Data". data.worldbank.org.
- ↑ "Tunisia - unemployment rate 2007-2017 - Statistic". Statista.
- ↑ "Rankings by Country of Average Monthly Net Salary (After Tax) (Salaries And Financing)". www.numbeo.com.
- ↑ "Ease of Doing Business in Tunisia". Doingbusiness.org. Retrieved 2017-11-24.
- 1 2 "OEC - Tunisia (TUN) Exports, Imports, and Trade Partners". atlas.media.mit.edu.
- ↑ "Export Partners of Tunisia". CIA World Factbook. 2012. Retrieved 2013-07-27.
- ↑ "Import Partners of Tunisia". CIA World Factbook. 2012. Retrieved 2013-07-27.
- ↑ "The World Factbook — Central Intelligence Agency". www.cia.gov.
- 1 2 "Tunisia 2018".
- ↑ "Sovereigns rating list". Standard & Poor's. Retrieved 26 May 2011.
- 1 2 3 Rogers, Simon; Sedghi, Ami (15 April 2011). "How Fitch, Moody's and S&P rate each country's credit rating". The Guardian. Retrieved 28 May 2011.
- ↑ "International Reserves and Foreign Currency Liquidity - TUNISIA". International Monetary Fund. 18 April 2011. Retrieved 31 May 2011.
- ↑ "Competitiveness Rankings".
- ↑ Solutions, EIU Digital. "Tunisia Economy, Politics and GDP Growth Summary - The Economist Intelligence Unit". country.eiu.com.
- ↑ "Tunisia: GDP per capita". "Index Mundi". Retrieved 2012-07-02.
- ↑ "CIA World Factbook". cia.gov. CIA. Archived from the original on 16 October 2012. Retrieved 16 July 2015.
- ↑ "Tunisia's tourism grappling with job losses". BBC World. July 15, 2015. Retrieved 16 July 2015.
- ↑ "Report for Selected Countries and Subjects". www.imf.org. Retrieved 2018-10-07.
- ↑ "Archived copy". Archived from the original on 5 December 2006. Retrieved 2009-12-31.
- ↑ "Hoping to preserve democracy, Tunisia woos foreign investors".
- ↑ "Treasury Secretary Geithner and Tunisian Finance Minister Dimassi Sign Declaration to Work Toward U.S. Loan Guarantee for Tunisia". U.S. Department of the Treasury. Retrieved 2012-06-13.
- ↑ Timothy Geithner
- ↑ "FAQs: U.S. LOAN GUARANTEE FOR TUNISIA" (PDF). U.S. Department of the Treasury. Archived (PDF) from the original on 2014-07-27. Retrieved 2012-09-13.
- ↑ "Nation Master".
External links
- Historic Growth Trend of Tunisia’s Economy, 1962 – 2007
- Economy of Tunisia at Curlie (based on DMOZ)
- Economy of Tunisia extracted from the CIA factbook public data