| 1979 North Indian Ocean cyclone season |
|---|
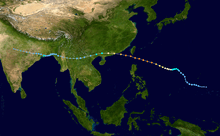
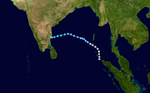
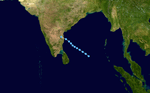
 Season summary map |
| Seasonal boundaries |
|---|
| First system formed |
May 6, 1979 |
|---|
| Last system dissipated |
November 25, 1979 |
|---|
| Seasonal statistics |
|---|
| Total fatalities |
Unknown |
|---|
| Total damage |
Unknown |
|---|
| Related articles |
|---|
|
|
|
The 1979 North Indian Ocean cyclone season was part of the annual cycle of tropical cyclone formation. The season has no official bounds but cyclones tend to form between April and December. These dates conventionally delimit the period of each year when most tropical cyclones form in the northern Indian Ocean. There are two main seas in the North Indian Ocean—the Bay of Bengal to the east of the Indian subcontinent and the Arabian Sea to the west of India. The official Regional Specialized Meteorological Centre in this basin is the India Meteorological Department (IMD), while the Joint Typhoon Warning Center (JTWC) releases unofficial advisories. An average of five tropical cyclones form in the North Indian Ocean every season with peaks in May and November.[1] Cyclones occurring between the meridians 45°E and 100°E are included in the season by the IMD.[2]
Systems
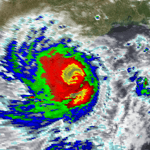
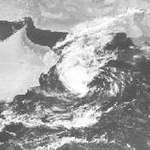
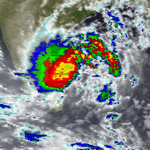
Cyclone One (1B)
|
Category 2 tropical cyclone (SSHWS) |
|
|
| Duration |
May 6 – May 12 |
|---|
| Peak intensity |
155 km/h (100 mph) (1-min) |
|---|
This system killed 700 people and 300,000 cattle.[3]
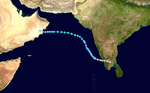
Tropical Storm Two (2A)
|
Tropical storm (SSHWS) |
|
|
| Duration |
June 18 – June 20 |
|---|
| Peak intensity |
95 km/h (60 mph) (1-min) |
|---|
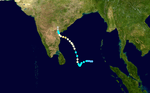
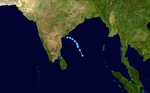
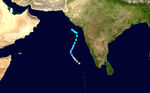
Tropical Storm Three (3B) (Hope)
|
Tropical storm (SSHWS) |
|
|
| Duration |
August 5 – August 8 |
|---|
| Peak intensity |
65 km/h (40 mph) (1-min) |
|---|
Tropical Storm Four (4B/4A)
|
Tropical storm (SSHWS) |
|
|
| Duration |
September 21 – September 23 |
|---|
| Peak intensity |
100 km/h (65 mph) (1-min) |
|---|
Tropical Depression Five (5B)
|
Tropical depression (SSHWS) |
|
|
| Duration |
September 21 – September 25 |
|---|
| Peak intensity |
45 km/h (30 mph) (1-min) |
|---|
Tropical Storm Six (6B)
|
Tropical storm (SSHWS) |
|
|
| Duration |
October 29 – November 1 |
|---|
| Peak intensity |
65 km/h (40 mph) (1-min) |
|---|
Tropical Storm Seven (7A)
|
Tropical storm (SSHWS) |
|
|
| Duration |
November 16 – November 17 |
|---|
| Peak intensity |
75 km/h (45 mph) (1-min) |
|---|
Tropical Depression Eight (8B)
|
Tropical depression (SSHWS) |
|
|
| Duration |
November 23 – November 25 |
|---|
| Peak intensity |
55 km/h (35 mph) (1-min) |
|---|