S&P 500 Index
The S&P 500,[6] or simply the S&P,[7][8] is a stock market index that measures the stock performance of 500 large companies listed on stock exchanges in the United States. It is one of the most commonly followed equity indices, and many consider it to be one of the best representations of the U.S. stock market.[9] The average annual total return of the index, including dividends, since inception in 1926 has been 9.8%; however, there were several years where the index declined over 30%.[10] The index has posted annual increases 70% of the time.[11]
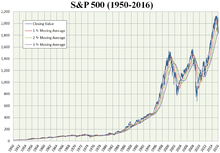 S&P 500 Index from 1950 to 2016 | |
| Foundation | March 4, 1957[1] |
|---|---|
| Operator | S&P Dow Jones Indices[2] |
| Exchanges | NYSE, NASDAQ, Cboe BZX Exchange |
| Constituents | 505[3] |
| Type | Large-cap[2] |
| Market cap | US$28.1 trillion (as of December 31, 2019)[4] |
| Weighting method | Free-float capitalization-weighted[5] |
| Related indices | List
|
| Website | us |


For a list of the components of the index, see List of S&P 500 companies. The components that have increased their dividends in 25 consecutive years are known as the S&P 500 Dividend Aristocrats.
The S&P 500 is a capitalization-weighted index and the performance of the 10 largest companies in the index account for 21.8% of the performance of the index.[1]
Funds that track the index have been recommended as investments by Warren Buffett, Burton Malkiel and John C. Bogle for investors with long time horizons.[12]
Although the index includes only companies listed in the United States, companies not originating from the United States might be included in the future. It already includes many multi-national companies; companies in the index derive on average only 71% of their revenue in the United States.[13]
The index is one of the factors in computation of the Conference Board Leading Economic Index, used to forecast the direction of the economy.[14]
The index is associated with many ticker symbols, including: ^GSPC,[15] INX,[16] and $SPX, depending on market or website.[17] The index value is updated every 15 seconds, or 1,559 times per trading day, with price updates disseminated by Reuters.[18]
The S&P 500 is maintained by S&P Dow Jones Indices, a joint venture majority-owned by S&P Global and its components are selected by a committee.[19][20]
Investing in the S&P 500
Mutual and exchange-traded funds
The easiest way to invest in the S&P 500 is to buy an index fund, either a mutual fund or an exchange-traded fund that replicates, before fees and expenses, the performance of the index by holding the same stocks as the index, in the same proportions. Exchange-traded funds (ETFs) that replicate the performance of the index are issued by The Vanguard Group (NYSE Arca: VOO), iShares (NYSE Arca: IVV), and State Street Corporation (NYSE Arca: SPY). These can be purchased via any stockbroker, sometimes commission-free. In addition, mutual funds that track the index are offered by several issuers including Fidelity Investments, T. Rowe Price, and Charles Schwab Corporation.[21][22][23]
Derivatives
In the derivatives market, the Chicago Mercantile Exchange (CME) offers futures contracts that track the index and trade on the exchange floor in an open outcry auction, or on CME's Globex platform, and are the exchange's most popular product. Ticker symbols are /SP for the full-sized contract and /ES for the E-mini S&P contract that is one-fifth the size of /SP. In May 2019, the CME started trading a Micro E-mini futures contract that is one-tenth the size of the S&P E-mini contract, i.e. 1/50 the size of the full-sized (SP) contract. The Micro E-mini S&P 500 Index contract's ticker symbol is /MES.
The Chicago Board Options Exchange (CBOE) offers options on the S&P 500 as well as on S&P 500 ETFs, inverse ETFs, and leveraged ETFs.
History
In 1860, Henry Varnum Poor formed Poor's Publishing, which published an investor's guide to the railroad industry.[24]
In 1923, Standard Statistics Company (founded in 1906 as the Standard Statistics Bureau) began rating mortgage bonds[24] and developed its first stock market index consisting of the stocks of 233 U.S. companies, computed weekly.[25]
In 1926, it developed a 90-stock index, computed daily.[25]
In 1941, Poor's Publishing merged with Standard Statistics Company to form Standard & Poor's.[24][26]
On March 4, 1957, the index was expanded to its current 500 companies and was renamed the S&P 500.[25]
In 1962, Ultronic Systems became the compiler of the S&P indices including the S&P 500 Stock Composite Index, the 425 Stock Industrial Index, the 50 Stock Utility Index, and the 25 Stock Rail Index.[27]
Selection criteria
The components of the S&P 500 are selected by a committee. This is similar to the Dow Jones Industrial Average, but different from others such as the Russell 1000, which are strictly rule-based. When considering the eligibility of a new addition, the committee assesses the company's merit using eight primary criteria: market capitalization, liquidity, domicile, public float, sector classification, financial viability, and length of time publicly traded and stock exchange.[5] Each of these primary criteria have specific requirements that must be met. For example, in order to be added to the index, a company must satisfy the following liquidity-based size requirements:[5]
- Market capitalization must be greater than or equal to US$8.2 billion
- Annual dollar value traded to float-adjusted market capitalization is greater than 1.0
- Minimum monthly trading volume of 250,000 shares in each of the six months leading up to the evaluation date
The committee selects the companies in the S&P 500 so they are representative of the industries in the Economy of the United States. The securities must be publicly listed on either the New York Stock Exchange (including NYSE Arca or NYSE American) or NASDAQ (NASDAQ Global Select Market, NASDAQ Select Market or the NASDAQ Capital Market). Securities that are ineligible for inclusion in the index are limited partnerships, master limited partnerships, OTC Bulletin Board issues, closed-end funds, exchange-traded funds, Exchange-traded notes, royalty trusts, tracking stocks, preferred stock, unit trusts, equity warrants, convertible bonds, investment trusts, American depositary receipts, American depositary shares and MLP IT units.[5]
The index includes non-U.S. companies, both formerly U.S.-incorporated companies that have completed corporate inversions outside the United States, as well as firms that have never been incorporated in the United States.
A stock may rise in value when it is added to the index since index funds must purchase that company's stock in order to continue tracking the S&P 500 index.[28][29]
Weighting
The index is a capitalization-weighted index;[30]:150 that is, movements in the prices of stocks with higher market capitalizations (the share price times the number of shares outstanding) have a greater impact on the value of the index than do companies with smaller market capitalizations.
However, to calculate the market capitalization of each company and therefore value of the index, Standard & Poor's uses only the number of shares available for public trading ("public float"), and excludes shares held by insiders or controlling shareholders that are not publicly traded.
The transition to a public float-adjusted capitalization-weighting was made in two steps, the first on March 18, 2005 and the second on September 16, 2005.[31]
Index maintenance
To keep the S&P 500 Index consistent over time, it is adjusted to capture corporate actions which affect market capitalization, such as additional share issuance, dividends and restructuring events such as mergers or spin-offs. To remain indicative of the largest public companies in the United States, the constituent stocks are changed from time to time.[5]
To prevent the value of the index from changing merely as a result of corporate financial actions, all such actions affecting the market value of the Index require a divisor adjustment. Also, when a company is dropped and replaced by another with a different market capitalization, the divisor needs to be adjusted in such a way that the value of the S&P 500 Index remains constant. All divisor adjustments are made after the close of trading and after the calculation of the closing value of the S&P 500 Index.[32]:290
There are many corporate actions that require the divisor to be adjusted, as follows:[33]
| Type of Action | Divisor Adjustment |
|---|---|
| Stock split (e.g., 2×1) | No |
| Share issuance | Yes |
| Share repurchase | Yes |
| Special cash dividend | Yes |
| Company change | Yes |
| Rights offering | Yes |
| Spinoffs | Yes |
| Mergers | Yes |
Calculation
To calculate the value of the S&P 500 Index, the sum of the adjusted market capitalization of all 500 stocks is divided by a factor, usually referred to as the Divisor.[33][34] For example, if the total adjusted market cap of the 500 component stocks is US$13 trillion and the Divisor is set at 8.933 billion, then the S&P 500 Index value would be 1,455.28. Although the adjusted market capitalization of the entire index can be accessed from Standard & Poor's website,[35] the Divisor is considered to be proprietary to the firm. However, the Divisor's value is approximately 8.9 billion.[36]
The formula to calculate the S&P 500 Index value is:[37]:225–226

where P is the price of each stock in the index and Q is the number of shares publicly available for each stock.
The Divisor is adjusted in the case of stock issuance, spin-offs or similar structural changes, to ensure that such events do not in themselves alter the numerical value of the Index.[33]
Performance
Price history & milestones
Breaking 100 in 1982
On August 12, 1982, the index closed at 102.42.[38]
Dot-com bubble
On March 24, 2000, the index reached an intraday high of 1,552.87, at the peak of the dot-com bubble; this high was not exceeded until 7 years later. On October 10, 2002, during the stock market downturn of 2002, the index fell to 768.83, a decline of approximately 50% from its high in March 2000.[39]
Financial crisis of 2007–2008
On May 30, 2007, the S&P 500 closed at 1,530.23, setting its first all-time closing high in more than 7 years. The index achieved a new all-time intraday high on October 11, 2007, at 1,576.09, following a record close of 1,565.15 on October 9, just before the onset of the financial crisis of 2007–2008. The index ended 2007 at 1,468.36, just below its December 31, 1999 close. Less than a month later, it dropped to 1,400, and did not reach that level again for 5 years.
In mid-2007, the subprime mortgage crisis spread to the wider U.S. financial sector. The situation became acute in September 2008, ushering in a period of unusually high market volatility not seen since 1929, encompassing daily swings of over 5% in both directions.[40]
On October 11, 2007, S&P index set a milestone with its all-time intraday high of 1,576.09.[41]
On November 20, 2008, the index closed at 752.44, its lowest since early 1997.[42]
The index ended 2008 at 903.25, for a yearly loss of 38.5%.[43] The market continued to decline in early 2009. The index reached a nearly 13-year low, closing at 676.53, on March 9, 2009. The entire drop from high in Oct 2007 to low in Mar 2009 was 57.7%, the largest since WWII.
On March 23, 2009, the S&P 500 marked a 20% gain from its low when it reached 822.92.[44] The Dow Jones Industrial Average reached this milestone on March 26, 2009.[45]
The close on December 31, 2009 was 1,115.10, making it the second-best year of the decade.[46]
On April 14, 2010, the index broke 1,200 closing at 1,210.65, but by July 2, 2010, it had fallen to 1022.58.
On April 29, 2011, the index closed at 1,363.61. However, after the August 2011 stock markets fall, it briefly broke below 1,100 in October 2011, with the VIX reaching 40.
Gains continued in 2012 despite significant volatility amid electoral and fiscal uncertainty, and the December 31, 2012 close of the S&P 500 following round 3 of quantitative easing was its third-highest ever, at 1,426.22 points.
New highs in 2013 and beyond
On March 28, 2013, the S&P surpassed its closing high level of 1,565.15, recovering all its losses from the financial crisis.[47] On April 10, 2013, it also closed above the intraday high from 2007.[48][41]
On March 2, 2015, the S&P closed at a new all-time inflation-adjusted closing high, and achieved a new all-time inflation-adjusted intraday high in September 2016, both of which were set in 2000.[49][50]
A period of over a year with no new record highs ended on July 11, 2016, closing at 2,137.16.[51]
In June 2017, the index posted the largest weekly rise since the previous presidential election in November 2016.[52]
After strong performance in 2017, the S&P 500 peaked in February 2018 at 2,836.[53]
In the first quarter of 2020, the S&P 500 fell 20% during the global stock market crash, its worst quarter since 2008.[54]
Annual returns
The "S&P 500" generally quoted is a price return index; there are also "total return" and "net total return" versions of the index. These versions differ in how dividends are accounted for. The price return version does not account for dividends; it captures only the changes in the prices of the index components. The total return version reflects the effects of dividend reinvestment. Finally, the net total return version reflects the effects of dividend reinvestment after the deduction of withholding tax.[55][56]
The CAGR (compound annual growth rate, annualized return) is the best average rate to summarize investment returns over several years. In contrast with the median return or the mean return, the CAGR is a measurement of the actual return achieved over the number of years examined.[57]
Calculation used for CAGR:

The total rate of return (including dividends) compounded annually from 1970 through 2019 is 10.60%. The rate of return (without dividends, or just on the index price itself) through 2019 is 7.37%.
Using a charting method (see chart above: Logarithmic graphs of S&P 500 index with and without inflation and with best fit lines), the S&P 500 index compound annual increase from 1950 to mid-2019 is a consistent 7.5%.
| Year | Change in Index | Total Annual Return Including Dividends | Value of $1.00 Invested on 1970‑01‑01 | 5 Year Annualized Return | 10 Year Annualized Return | 15 Year Annualized Return | 20 Year Annualized Return | 25 Year Annualized Return |
|---|---|---|---|---|---|---|---|---|
| 1970 | 0.10% | 4.01% | $1.04 | - | - | - | - | - |
| 1971 | 10.79% | 14.31% | $1.19 | - | - | - | - | - |
| 1972 | 15.63% | 18.98% | $1.41 | - | - | - | - | - |
| 1973 | −17.37% | −14.66% | $1.21 | - | - | - | - | - |
| 1974 | −29.72% | −26.47% | $0.89 | −2.35% | - | - | - | - |
| 1975 | 31.55% | 37.20% | $1.22 | 3.21% | - | - | - | - |
| 1976 | 19.15% | 23.84% | $1.51 | 4.87% | - | - | - | - |
| 1977 | −11.50% | −7.18% | $1.40 | −0.21% | - | - | - | - |
| 1978 | 1.06% | 6.56% | $1.49 | 4.32% | - | - | - | - |
| 1979 | 12.31% | 18.44% | $1.77 | 14.76% | 5.86% | - | - | - |
| 1980 | 25.77% | 32.50% | $2.34 | 13.96% | 8.45% | - | - | - |
| 1981 | −9.73% | −4.92% | $2.23 | 8.10% | 6.47% | - | - | - |
| 1982 | 14.76% | 21.55% | $2.71 | 14.09% | 6.70% | - | - | - |
| 1983 | 17.27% | 22.56% | $3.32 | 17.32% | 10.63% | - | - | - |
| 1984 | 1.40% | 6.27% | $3.52 | 14.81% | 14.78% | 8.76% | - | - |
| 1985 | 26.33% | 31.73% | $4.64 | 14.67% | 14.32% | 10.49% | - | - |
| 1986 | 14.62% | 18.67% | $5.51 | 19.87% | 13.83% | 10.76% | - | - |
| 1987 | 2.03% | 5.25% | $5.80 | 16.47% | 15.27% | 9.86% | - | - |
| 1988 | 12.40% | 16.61% | $6.76 | 15.31% | 16.31% | 12.17% | - | - |
| 1989 | 27.25% | 31.69% | $8.90 | 20.37% | 17.55% | 16.61% | 11.55% | - |
| 1990 | −6.56% | −3.10% | $8.63 | 13.20% | 13.93% | 13.94% | 11.16% | - |
| 1991 | 26.31% | 30.47% | $11.26 | 15.36% | 17.59% | 14.34% | 11.90% | - |
| 1992 | 4.46% | 7.62% | $12.11 | 15.88% | 16.17% | 15.47% | 11.34% | - |
| 1993 | 7.06% | 10.08% | $13.33 | 14.55% | 14.93% | 15.72% | 12.76% | - |
| 1994 | −1.54% | 1.32% | $13.51 | 8.70% | 14.38% | 14.52% | 14.58% | 10.98% |
| 1995 | 34.11% | 37.58% | $18.59 | 16.59% | 14.88% | 14.81% | 14.60% | 12.22% |
| 1996 | 20.26% | 22.96% | $22.86 | 15.22% | 15.29% | 16.80% | 14.56% | 12.55% |
| 1997 | 31.01% | 33.36% | $30.48 | 20.27% | 18.05% | 17.52% | 16.65% | 13.07% |
| 1998 | 26.67% | 28.58% | $39.19 | 24.06% | 19.21% | 17.90% | 17.75% | 14.94% |
| 1999 | 19.53% | 21.04% | $47.44 | 28.56% | 18.21% | 18.93% | 17.88% | 17.25% |
| 2000 | −10.14% | −9.10% | $43.12 | 18.33% | 17.46% | 16.02% | 15.68% | 15.34% |
| 2001 | −13.04% | −11.89% | $37.99 | 10.70% | 12.94% | 13.74% | 15.24% | 13.78% |
| 2002 | −23.37% | −22.10% | $29.60 | −0.59% | 9.34% | 11.48% | 12.71% | 12.98% |
| 2003 | 26.38% | 28.68% | $38.09 | −0.57% | 11.07% | 12.22% | 12.98% | 13.84% |
| 2004 | 8.99% | 10.88% | $42.23 | −2.30% | 12.07% | 10.94% | 13.22% | 13.54% |
| 2005 | 3.00% | 4.91% | $44.30 | 0.54% | 9.07% | 11.52% | 11.94% | 12.48% |
| 2006 | 13.62% | 15.79% | $51.30 | 6.19% | 8.42% | 10.64% | 11.80% | 13.37% |
| 2007 | 3.53% | 5.49% | $54.12 | 12.83% | 5.91% | 10.49% | 11.82% | 12.73% |
| 2008 | −38.49% | −37.00% | $34.09 | −2.19% | −1.38% | 6.46% | 8.43% | 9.77% |
| 2009 | 23.45% | 26.46% | $43.11 | 0.42% | −0.95% | 8.04% | 8.21% | 10.54% |
| 2010 | 12.78% | 15.06% | $49.61 | 2.29% | 1.41% | 6.76% | 9.14% | 9.94% |
| 2011 | -0.00% | 2.11% | $50.65 | −0.25% | 2.92% | 5.45% | 7.81% | 9.28% |
| 2012 | 13.41% | 16.00% | $58.76 | 1.66% | 7.10% | 4.47% | 8.22% | 9.71% |
| 2013 | 29.60% | 32.39% | $77.79 | 17.94% | 7.40% | 4.68% | 9.22% | 10.26% |
| 2014 | 11.39% | 13.69% | $88.44 | 15.45% | 7.67% | 4.24% | 9.85% | 9.62% |
| 2015 | −0.73% | 1.38% | $89.66 | 12.57% | 7.30% | 5.00% | 8.19% | 9.82% |
| 2016 | 9.54% | 11.96% | $100.38 | 14.66% | 6.94% | 6.69% | 7.68% | 9.15% |
| 2017 | 19.42% | 21.83% | $122.30 | 15.79% | 8.49% | 9.92% | 7.19% | 9.69% |
| 2018 | −6.24% | −4.38% | $116.94 | 8.49% | 13.12% | 7.77% | 5.62% | 9.07% |
| 2019 | 28.88% | 31.49% | $153.76 | 11.70% | 13.56% | 9.00% | 6.06% | 10.22% |
| High | 34.11% | 37.58% | --- | 28.56% | 19.21% | 18.93% | 17.88% | 17.25% |
| Low | −38.49% | −37.00% | --- | −2.35% | −1.38% | 4.24% | 5.62% | 9.07% |
| Median | 11.85% | 14.69% | --- | 13.58% | 12.07% | 10.85% | 11.80% | 11.60% |
| Year | Change in Index | Total Annual Return Including Dividends | Value of $1.00 Invested on 1970‑01‑01 | 5 Year Annualized Return | 10 Year Annualized Return | 15 Year Annualized Return | 20 Year Annualized Return | 25 Year Annualized Return |
See also
- Conference Board Leading Economic Index
- Dow Jones Industrial Average
- List of S&P 500 companies
- E-mini S&P
- Exchange-traded fund
- Fortune 500
- FTSE 100
- S&P Europe 350
- Euro Stoxx 50
- STOXX Europe 600
- Index fund
- Russell 1000 Index
- S&P 100
- S&P 400
- S&P 500 Dividend Aristocrats
- S&P 600
- S&P 1500
- Standard & Poor's
- Topple rate
- Wilshire 5000
References
- "S&P 500 factsheet" (PDF). Standard & Poor's. Archived (PDF) from the original on August 17, 2014. Retrieved January 20, 2013.
- "S&P 500 Overview". S&P/Dow Jones Indices LLC. Archived from the original on January 16, 2013. Retrieved January 20, 2013.
- "S&P Dow Jones Indices Announces Treatment of Stock Dividend for Discovery Communications in S&P 500" (PDF). Spice-indices.com. Archived (PDF) from the original on August 9, 2014. Retrieved December 16, 2017.
- "Dow Jones Indices" (PDF). Us.spindices.com. Archived (PDF) from the original on April 3, 2014. Retrieved December 16, 2017.
- "S&P U.S. Indices Methodology" (PDF). Standard & Poor's. Archived (PDF) from the original on June 5, 2016. Retrieved December 16, 2017.
- "S&P 500®". S&P Dow Jones Indices. Archived from the original on January 24, 2019. Retrieved January 24, 2019.
- Reklaitis, Victor (October 30, 2015). "The S&P is up 9% this month, but these 10 stocks jumped more than 22%". Marketwatch. Archived from the original on November 16, 2018.
- "The S&P is Flat for the Year, and that Usually Leads to Huge Moves". Dailyfx.com. December 28, 2015. Archived from the original on December 30, 2015. Retrieved January 9, 2016.
- "Standard & Poor's 500 Index – S&P 500". Archived from the original on June 14, 2012.
- "The S&P 500 has already met". CNBC. June 18, 2017.
- Carlozo, Lou (October 2, 2018). "Why Investors Love the S&P 500". U.S. News & World Report.
- Martin, Emmie (June 28, 2018). "Warren Buffett and Tony Robbins agree on the best way to invest your money". CNBC.
- Brzenk, Phillip (March 19, 2018). "The Impact of the Global Economy on the S&P 500®". S&P Global.
- KENTON, WILL (May 8, 2019). "Composite Index of Leading Indicators". Investopedia.
- "Yahoo! Finance: ^GSPC". Yahoo! Finance. Archived from the original on July 8, 2016.
- "Google Finance: .INX". Google Finance. Archived from the original on December 17, 2008.
- "S&P 500 Index Quote". MarketWatch. Archived from the original on February 9, 2016.
- Duggan, Wayne (June 13, 2019). "This Day In Market History: S&P 500 Quotes Delivered Every 15 Seconds". MSN.
- MCFARLANE, GREG (June 25, 2019). "The S&P 500: The Index You Need To Know". Investopedia.
- Wathen, Jordan (April 9, 2019). "How Are S&P 500 Stocks Chosen?". The Motley Fool.
- Olson, Sheila. "Top 3 ETFs to Track the S&P 500". Investopedia. Archived from the original on March 24, 2019.
- Chang, Ellen (June 28, 2019). "7 S&P Index Funds to Buy Now". U.S. News & World Report.
- THUNE, KENT (June 25, 2019). "The Best S&P 500 Index Funds". TheBalance.
- "Our History". S&P Global.
- Valetkevitch, Caroline (May 6, 2013). "Key dates and milestones in the S&P 500's history". Reuters.
- Riggs, Thomas, ed. (2015). "Standard & Poor's". Gale Encyclopedia of U.S. Economic History. 3 (2nd ed.). Gale. p. 1256. Gale CX3611000855.
- "Vast stock wire network being extended to coast". The New York Times. June 4, 1962.
- "Stock Price Reactions to Index Inclusion". National Bureau of Economic Research.
- Krantz, Matt (July 5, 2013). "Do stocks soar if they get into the S&P 500?". USA TODAY.
- Fernholz, E. R., Stochastic Portfolio Theory (Berlin/Heidelberg: Springer, 2002), p. 150.
- "Standard & Poor's Announces Changes to U.S. Investable Weight Factors and Final Float Transition Schedule". March 9, 2005. Archived from the original on September 21, 2013.
- Shilling, H., The International Guide to Securities Market Indices (Chicago: Fitzroy Dearborn Publishers, 1996), p. 290.
- "S&P Indices Index Mathematics Methodology" (PDF). The McGraw-Hill Companies, Inc. Archived from the original (PDF) on November 6, 2011. Retrieved January 20, 2013.
- "S&P Dow Jones Index Mathematics Methodology" (PDF). Spindices.com. March 2014. p. 6. Archived from the original (PDF) on December 7, 2014. Retrieved December 16, 2017.
- "S&P 500 Details". Standard & Poor's. Archived from the original on January 16, 2013. Retrieved January 20, 2013.
- "How is the value of the S&P 500 calculated?". Investopedia. Archived from the original on January 3, 2013.
- Parr, R. L., & Smith, G. V., Intellectual Property: Valuation, Exploitation, and Infringement Damages (Hoboken: Wiley, 2005), pp. 225–226.
- Marotta, David John (October 11, 2017). "Volker's Bear: The Bear Market Of 1982". Forbes. Archived from the original on October 11, 2017.
- "New High For S&P 500". ETF.com. August 9, 2007. Archived from the original on September 11, 2014.
- "S&P 500 actual volatility at highest since 1929". FinanzNachrichten.de. November 21, 2008. Archived from the original on May 27, 2015.
- Park, JeeYeon. "Record-Smashing Quarter: S&P 500 Ends Above 2007's Record Close, Dow Posts Best Q1 Since 1998". CNBC. Archived from the original on April 1, 2013.
- Perman, Cindy (November 20, 2008). "Stocks Plunge, Leaving Dow Below 7600". CNBC. Archived from the original on December 17, 2017.
- Twin, Alexandra (December 31, 2008). "Wall Street: Bring on '09". CNN. Archived from the original on April 2, 2015.
- Twin, Alexandra (March 23, 2009). "Dow jumps almost 500 points". CNN.
- Mckay, Peter; Rogow, Geoffrey; Curran, Rob (March 26, 2009). "Stocks' Momentum Keeps Building". The Wall Street Journal. Archived from the original on March 11, 2016.
- Valetkevitch, Caroline (December 31, 2009). "Wall St closes out '09 with best gains since 2003". Reuters. Archived from the original on December 17, 2017.
- "S&P 500 Closes At All-Time High". HuffPost. Reuters. Archived from the original on September 24, 2015.
- Farrell, Maureen (April 10, 2013). "Dow and S&P 500 close at new record highs". CNN. Archived from the original on September 24, 2014.
- "CPI Inflation Calculator". Bureau of Labor Statistics. Archived from the original on March 4, 2016.
- "CPI Inflation Calculator". Bureau of Labor Statistics. Archived from the original on March 5, 2016.
- Reuters (July 11, 2016). Strong economy, earnings bets propel S&P 500 to record high Archived March 17, 2017, at the Wayback Machine.
- Gold, Riva; Driebusch, Corrie (June 24, 2017). "U.S. Stocks Notch Weekly Gains". The Wall Street Journal. Archived from the original on June 25, 2017.
- Anon., "Collision Of The Immutable K?", Long Finance, October 15, 2019.
- Stevens, Pippa (April 1, 2020). "Stock futures point to an opening bounce on Wall Street after second quarter's rocky start". CNBC. Archived from the original on April 2, 2020.
The S&P 500 fell 20% in the first quarter, its biggest quarterly loss since 2008
- "S&P – Indices > Equity Indices – S&P 500 – Index Table". standardandpoors.com. Archived from the original on January 10, 2007.
- "Description". standardandpoors.com.
- Murphy, C. B., "Compound Annual Growth Rate – CAGR", Investopedia, June 13, 2019.
External links
- Business data for S&P 500 Index: