NASDAQ Composite
The NASDAQ Composite (ticker symbol ^IXIC)[1] is a stock market index of the common stocks and similar securities (e.g. ADRs, tracking stocks, limited partnership interests) listed on the Nasdaq stock market. Along with the Dow Jones Industrial Average and S&P 500 it is one of the three most-followed indices in US stock markets. The composition of the NASDAQ Composite is heavily weighted towards information technology companies. The NASDAQ-100, whose components are a subset of the NASDAQ Composite's, accounts for over 90% of the NASDAQ Composite's movement, and there are many ETFs tracking its performance.
Annual returns
| Year | Starting Amount | Highest Amount | Lowest Amount | Finishing Amount | Return Change | Return Rate |
|---|---|---|---|---|---|---|
| 1971 | 100.00 | 114.12 | 99.68 | 114.12 | +14.12 | +14.12% |
| 1972 | 114.12 | 135.15 | 113.65 | 133.73 | +19.61 | +17.18% |
| 1973 | 133.73 | 136.84 | 88.67 | 92.19 | -41.54 | -31.06% |
| 1974 | 92.19 | 96.53 | 54.87 | 59.82 | -32.37 | -35.11% |
| 1975 | 59.82 | 88.00 | 59.82 | 77.62 | +17.80 | +29.76% |
| 1976 | 77.62 | 97.88 | 77.06 | 97.88 | +20.26 | +26.10% |
| 1977 | 97.88 | 105.05 | 93.66 | 105.05 | +7.17 | +7.33% |
| 1978 | 105.05 | 139.25 | 99.09 | 117.98 | +12.93 | +12.31% |
| 1979 | 117.98 | 151.14 | 117.84 | 151.84 | +33.86 | +28.70% |
| 1980 | 151.84 | 206.19 | 124.09 | 202.34 | +50.50 | +33.26% |
| 1981 | 202.34 | 223.47 | 175.03 | 195.84 | -6.50 | -3.21% |
| 1982 | 195.84 | 240.70 | 159.14 | 232.41 | +36.57 | +18.67% |
| 1983 | 232.41 | 286.07 | 230.59 | 278.60 | +46.19 | +19.87% |
| 1984 | 278.60 | 287.90 | 225.30 | 247.10 | -31.50 | -11.31% |
| 1985 | 247.10 | 325.60 | 245.80 | 324.90 | +77.80 | +31.49% |
| 1986 | 324.90 | 384.00 | 322.10 | 348.80 | +23.90 | +7.36% |
| 1987 | 348.80 | 456.30 | 288.50 | 330.50 | -18.30 | -5.25% |
| 1988 | 330.50 | 397.50 | 329.00 | 381.40 | +50.90 | +15.40% |
| 1989 | 381.40 | 487.50 | 376.90 | 454.80 | +73.40 | +19.24% |
| 1990 | 454.80 | 470.30 | 323.00 | 373.80 | -81.00 | -17.81% |
| 1991 | 373.80 | 586.35 | 353.00 | 586.34 | +212.54 | +56.86% |
| 1992 | 586.34 | 676.95 | 545.95 | 676.95 | +90.91 | +15.45% |
| 1993 | 676.95 | 791.20 | 644.71 | 776.80 | +99.85 | +14.75% |
| 1994 | 776.80 | 800.63 | 690.95 | 751.96 | -24.84 | -3.20% |
| 1995 | 751.96 | 1,074.85 | 751.96 | 1,052.13 | +300.17 | +39.92% |
| 1996 | 1,052.13 | 1,328.95 | 977.79 | 1,291.03 | +238.90 | +22.71% |
| 1997 | 1,291.03 | 1,748.78 | 1,194.16 | 1,570.35 | +279.32 | +21.64% |
| 1998 | 1,570.35 | 2,202.63 | 1,465.61 | 2,192.69 | +622.34 | +39.63% |
| 1999 | 2,192.69 | 4,090.61 | 2,192.69 | 4,069.31 | +1,876.62 | +85.59% |
| 2000 | 4,069.31 | 5,132.52 | 2,288.16 | 2,470.52 | -1,598.79 | -39.29% |
| 2001 | 2,470.52 | 2,892.36 | 1,387.06 | 1,950.40 | -520.12 | -21.05% |
| 2002 | 1,950.40 | 2,098.88 | 1,108.49 | 1,335.51 | -614.89 | -31.53% |
| 2003 | 1,335.51 | 2,015.23 | 1,253.22 | 2,003.37 | +667.86 | +50.01% |
| 2004 | 2,003.37 | 2,185.56 | 1,750.82 | 2,175.44 | +172.07 | +8.59% |
| 2005 | 2,175.44 | 2,278.16 | 1,889.83 | 2,205.32 | +29.88 | +1.37% |
| 2006 | 2,205.32 | 2,470.95 | 2,012.68 | 2,415.29 | +209.97 | +9.52% |
| 2007 | 2,415.29 | 2,861.51 | 2,331.57 | 2,652.28 | +236.99 | +9.81% |
| 2008 | 2,652.28 | 2,661.50 | 1,295.48 | 1,577.03 | -1,075.25 | -40.54% |
| 2009 | 1,577.03 | 2,295.80 | 1,265.62 | 2,269.15 | +692.12 | +43.89% |
| 2010 | 2,269.15 | 2,675.26 | 2,100.17 | 2,652.87 | +383.72 | +16.91% |
| 2011 | 2,652.87 | 2,878.94 | 2,298.89 | 2,605.15 | -47.72 | -1.80% |
| 2012 | 2,605.15 | 3,196.93 | 2,605.15 | 3,019.51 | +414.36 | +15.91% |
| 2013 | 3,019.51 | 4,177.73 | 3,019.51 | 4,176.59 | +1,157.08 | +38.32% |
| 2014 | 4,176.59 | 4,814.95 | 4,103.88 | 4,736.05 | +559.46 | +13.40% |
| 2015 | 4,736.05 | 5,231.94 | 4,292.14 | 5,007.41 | +271.36 | +5.73% |
| 2016 | 5,007.41 | 5,487.41 | 4,209.76 | 5,383.12 | +375.71 | +7.50% |
| 2017 | 5,383.12 | 7,003.89 | 5,383.12 | 6,903.39 | +1,520.27 | +28.24% |
| 2018 | 6,903.39 | 8,109.69 | 6,192.92 | 6,635.28 | -268.11 | -3.88% |
| 2019 | 6,635.28 | 9,022.39 | 6,463.50 | 8,972.60 | +2337.32 | 35.23% |
History
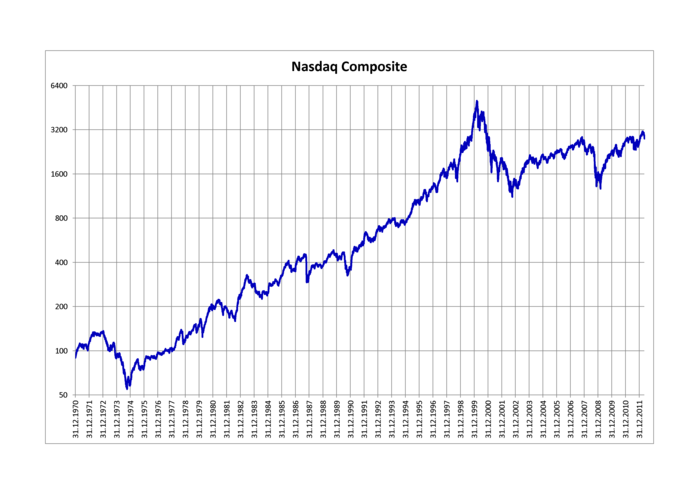
The index was launched in 1971, with a starting value of 100. Over the years, the index has soared tremendously despite multiple periods of decline.
Dot-com boom and bust
On July 17, 1995, the index closed above the 1,000 mark for the first time. It made steady gains in the following years to reach 2,000 points by 1998, then began to accelerate significantly. This process mushroomed in late 1999. The index closed that year at 4,069.31 points. On March 10, 2000, the index finally peaked at an intra-day high of 5,132.52,[2] and closed at an all-time high of 5,048.62.
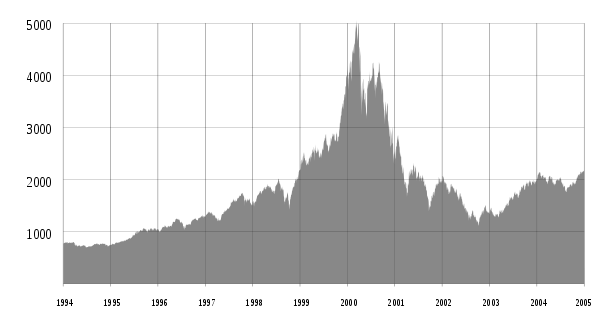
On March 10, 2000, the NASDAQ Composite peaked at 5,132.52, but fell to 3,227 by April 17,[3] and in the following 30 months fell 78% from its peak.[4]
The decline from this peak signalled the beginning of the dot-com bubble burst. There were multiple things contributing to this Dot-com boom and bust. Some optimists thought the internet and World Wide Web would be more significant to business than any kind of Industrial Revolution in the past, possibly enabling us to achieve a Technological Singularity. More pessimistic types were concerned that business would require massive technology replacement to achieve Y2K compatibility.
The index declined to half its value within a year, and finally hit the bottom of the bear market trend on October 10, 2002, with an intra-day low of 1,108.49. While the index gradually recovered since then, it did not trade for more than half of its peak value until May 2007. The 2000s (decade) brought a mix of pessimistic news stemming from the Early 2000s recession, the September 11 attacks and the impending Afghan War along with the 2003 invasion of Iraq.
Financial crisis
The index opened the fourth quarter of 2007 with new 80-month highs, closing above the 2,800 point mark on October 9, 2007, and reaching an intra-day level of 2,861.51 on October 31, 2007, the highest point reached on the index since January 24, 2001.
High energy prices and the possibility of recession dropped the NASDAQ into a bear market in early 2008, which was recognized on February 6 when the NASDAQ closed below the 2,300 level, about 20% below the recent highs. Furthermore, the failure of Lehman Brothers in September brought world financial markets into turmoil. The NASDAQ was no exception, experiencing record levels of market volatility. On September 29, 2008, the NASDAQ dropped nearly 200 points, the most since the tech bubble burst, losing 9.14% (third largest in history) to fall beneath the 2,000 level. Conversely, on October 13, 2008, the NASDAQ recorded a gain of nearly 200 points (more than 11%). On March 9, 2009, the composite hit a six-year intra-day low of 1,265.52 before recovering under the influence of Federal Reserve quantitative easing (QE).
2010s bull market
Amid hope that the Great Recession, the United States housing bubble and the Global financial crisis of 2008–2009 were easing and possibly coming to an end, the NASDAQ established a volatile base from which the index would finally surpass the 3,000 mark, and the initial crash low of mid-2000 (3,042.66), for the first time since the end of the 20th century. This first occurred intra-day on February 29, 2012, before further volatile pullbacks. Later in 2012, the index managed a yearly close above 3,000 for only the second time in its history, with a total of 3,019.51 points.
With the extension of relatively low tax rates for most incomes, the index jumped to begin 2013 with only minor pullbacks. On November 26, 2013, the index made its first close above 4,000 since September 7, 2000. Although it still stood almost 20% below its all-time highs, the index did set a new record annual close of 4,176.59 on December 31, 2013. On March 2, 2015, the NASDAQ closed above 5,000 for the first time since March 9, 2000.
On April 23, 2015, the NASDAQ finally broke through the record of 15 years earlier and set a new high for a daily close, though it was still just short of the all-time intraday high set in 2000.[5] After its first significant correction (greater than 10%) in about four years, the index roared back above 5,000 with a triple-digit gain on October 23, 2015. Two years later, the Nasdaq crossed 7,000 intraday, which was within reach of the inflation-adjusted high set back on March 10, 2000. Although Nasdaq flirted with the "unthinkable milestone" on January 16, 2018, the COMP closed above it the next day for the first time since the end of the Dot-com boom.[6][7] Later that same year, NASDAQ plunged more than 20% below its high from August 29th, thus confirming bear market status on a closing-basis. The following year, NASDAQ rallied more than 20% from its trough on December 24, 2018, though it remains below last year's high, resulting in debates as to whether the index has left bear market territory or remains in there.[8]
Criteria
To be eligible for inclusion in the Composite, a security's U.S. listing must be exclusively on the NASDAQ Stock Market (unless the security was dually listed on another U.S. market prior to 2004 and has continuously maintained such listing), and must be one of the following security types:
- American Depositary Receipts (ADRs)
- Common Stock
- Limited Partnership Interests
- Ordinary Shares
- Real Estate Investment Trusts (REITs)
- Shares of Beneficial Interest (SBIs)
- Tracking Stocks
Closed-end funds, convertible debentures, exchange traded funds, preferred stocks, rights, warrants, units and other derivative securities are not included. If at any time a component security no longer meets the above criteria, the security becomes ineligible for inclusion in the Composite Index and is removed.
Investing
Investing in the NASDAQ Composite Index is currently made accessible through an exchange-traded fund issued by fund manager Fidelity Investments. Introduced on October 1, 2003, the ETF (NASDAQ: ONEQ) attempts to match the overall performance of the index. It is not nearly as popular as the "Q's" (NASDAQ: QQQ) which tracks the NASDAQ-100.
See also
- Closing milestones of the NASDAQ Composite
- NASDAQ-100
- NYSE Composite
- Value Line Composite Index
References
- "NASDAQ Composite". Yahoo! Finance. Retrieved 9 February 2016.
- Stocks Rally to Pre-Crisis Heights | Business and Finance Digest Archived 2013-11-05 at the Wayback Machine. Business-finance.top10-digest.com. Retrieved on 2013-07-19.
- "NASDAQ Composite daily index".
- Glassman, James K. (February 11, 2015). "3 Lessons for Investors From the Tech Bubble". Kiplinger's Personal Finance.
- Mahmudova, Anora; Sjolin, Sara (23 April 2015). "Nasdaq posts first record close in 15 years". MarketWatch. Retrieved 27 April 2015.
- Eule, Alex. "Inconceivable! The Nasdaq Crossed 7000…and a Once Unthinkable Milestone Is Now in Reach". Retrieved 2017-12-19.
- Eisen, Ben (2018-01-17). "Nasdaq Tops Inflation-Adjusted High from Dot-Com Boom". WSJ. Retrieved 2018-01-17.
- DeCambre, Mark. "The Nasdaq is on the brink of escaping from bear-market territory". MarketWatch. Retrieved 2019-03-20.
External links
- www.nasdaq.com/reference/composite-eligibility-criteria.aspx
- Reuters page for .IXIC
- Yahoo! Finance page for ^IXIC
- Bloomberg page for CCMP:IND
- Nasdaq Market Indices
- NASDAQ Composite Index List
- March 10, 2000, record high
Nasdaq, Inc. | ||
|---|---|---|
Operator of the Nasdaq, Nasdaq Nordic, and Nasdaq Baltic stock exchange systems | ||
| Exchanges |
| |
| Indexes | ||
| Other holdings |
| |