Motor vehicle
A motor vehicle, also known as motorized vehicle or automotive vehicle, is a self-propelled vehicle, commonly wheeled, that does not operate on rails (such as trains or trams or 4-wheelers) and is used for the transportation of people or cargo.


The vehicle propulsion is provided by an engine or motor, usually an internal combustion engine or an electric motor, or some combination of the two, such as hybrid electric vehicles and plug-in hybrids. For legal purpose, motor vehicles are often identified within a number of vehicle classes including cars, buses, motorcycles, off-road vehicles, light trucks and regular trucks. These classifications vary according to the legal codes of each country. ISO 3833:1977 is the standard for road vehicle types, terms and definitions.[2] Generally, to avoid requiring handicapped persons from having to possess an operator's license to use one, or requiring tags and insurance, powered wheelchairs will be specifically excluded by law from being considered motor vehicles.
As of 2011, there were more than one billion motor vehicles in use in the world, excluding off-road vehicles and heavy construction equipment.[3][4][5] Global vehicle ownership per capita in 2010 was 148 vehicles in operation per 1000 people.[5] China has the largest motor vehicle fleet in the world, with 322 million motor vehicles registered at the end of September 2018.[6] The United States has the highest vehicle ownership per capita in the world, with 832 vehicles in operation per 1000 people in 2016.[1] Also, China became the world's largest new car market in 2009.[4][5][7] In 2011, a total of 80 million cars and commercial vehicles were built, led by China, with 18.4 million motor vehicles manufactured.[8]
Ownership trends
The US publisher Ward's estimates that as of 2010, there were 1.015 billion motor vehicles in use in the world. This figure represents the number of cars, trucks (light, medium and heavy duty), and buses, but does not include off-road vehicles or heavy construction equipment. The world vehicle population passed the 500 million-unit mark in 1986, from 250 million motor vehicles in 1970. Between 1950 and 1970, the vehicle population doubled roughly every 10 years.[3][4][5] Two US researchers estimate that the world's fleet will reach 2 billion motor vehicles by 2020, with cars representing at least 50% of all vehicles. China's and India's automobile fleets are expected to grow at an annual rate of around 7 or 8%, while the slowest growth is expected in the United States, with less than 1% a year, and Western Europe, with 1 to 2%.[3] Navigant Consulting forecasts that the global stock of light-duty motor vehicles will reach 2 billion units in 2035.[9]
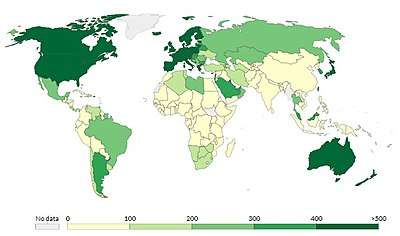
Global vehicle ownership in 2010 was 148 vehicles in operation per 1000 people, a ratio of 1:6.75 vehicles to people, slightly down from 150 vehicles per 1000 people in 2009, a rate of 1:6.63 vehicles to people.[5] The global rate of motorization increased in 2013 to 174 vehicles per 1000 people.[10] In developing countries vehicle ownership rates rarely exceed 200 cars per 1,000 population.[11]
The following table summarizes the evolution of vehicle registrations in the world from 1960 to 2012:
| Historical trend of worldwide vehicle registrations 1960-2016 (thousands)[1][12][13][14][15] | ||||||||||
|---|---|---|---|---|---|---|---|---|---|---|
| Type of vehicle | 1960 | 1970 | 1980 | 1990 | 2000 | 2005 | 2010 | 2015 | 2016 | |
| Car registrations(1) | 98,305 | 193,479 | 320,390 | 444,900 | 548,558 | 617,914 | 723,567 | 923,590 | 973,353 | |
| Truck and bus registrations | 28,583 | 52,899 | 90,592 | 138,082 | 203,272 | 245,798 | 309,395 | 337,250 | 348,919 | |
| World total | 126,888 | 246,378 | 410,982 | 582,982 | 751,830 | 863,712 | 1,032,962 | 1,260,840 | 1,322,272 | |
| Note (1) Car registrations do not include U.S. light trucks (SUVs, minivan and pickups) that are used for personal travel. These vehicles are accounted among trucks. | ||||||||||
European Union
The 27 European Union (EU-27) member countries had a fleet of over 256 million in 2008, and passenger cars accounted for 87% of the union's fleet. The five largest markets, Germany (17.7%), Italy (15.4%), France (13.3%), the UK (12.5%), and Spain (9.5%), accounted for 68% of the region's total registered fleet in 2008.[16][17] The EU-27 member countries had in 2009 an estimated ownership rate of 473 passenger cars per 1000 people.[18]
According to Ward's, Italy had the second highest (after the U.S.) vehicle ownership per capita in 2010, with 690 vehicles per 1000 people.[5] Germany had a rate of motorization of 534 vehicles per 1000 people and the UK of 525 vehicles per 1000 people, both in 2008. France had a rate of 575 vehicles per 1000 people and Spain 608 vehicles per 1000 people in 2007.[19] Portugal, between 1991 and 2002 grew up 220% on its motorization rate, having had in 2002, 560 cars per 1000 people.[20]
Italy also leads in alternative fuel vehicles, with a fleet of 779,090 natural gas vehicles as of June 2012, the largest NGV fleet in Europe.[21] Sweden, with 225,000 flexible-fuel vehicles, has the largest flexifuel fleet in Europe by mid-2011.[22]
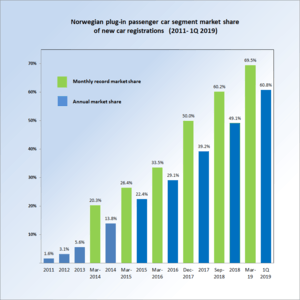
More than one million plug-in electric passenger cars and vans have been registered in Europe by June 2018,[23] the world's second largest regional plug-in stock after China.[24][25][26] Norway is the leading plug-in market with over 296,00 units registered as of December 2018.[27] In October 2018, Norway became the world's first country where 10% of all passenger cars on the road are plug-in electrics.[28][29] Also, the Norwegian plug-in car segment market share has been the highest in the world for several years, achieving 39.2% in 2017, and 49.1% in 2018.[30][31]
United States
| Historical evolution of vehicle ownership rates in the U.S. (Selected years 1900–2016)[1] | |||||
|---|---|---|---|---|---|
| Year | Veh. per 1000 people | Year | Veh. per 1000 people | Year | Veh. per 1000 people |
| 1900 | 0.11 | 1940 | 245.63 | 1990 | 773.4 |
| 1905 | 0.94 | 1945 | 221.80 | 2000 | 800.3 |
| 1910 | 5.07 | 1950 | 323.71 | 2005 | 837.3 |
| 1920 | 86.78 | 1960 | 410.37 | 2010 | 808.4 |
| 1930 | 217.34 | 1970 | 545.35 | 2015 | 821.5 |
| 1935 | 208.6 | 1980 | 710.71 | 2016 | 831.9 |
The United States has the second largest fleet of motor vehicles in the world after China. As of 2016, had a motor vehicles stock of 259.14 million, of which, 246 million were light duty vehicles, consisting of 112.96 million passenger cars and 133 million light trucks (includes SUVs). A total of 11.5 million heavy trucks were registered at the end 2016[1] Vehicle ownership per capita in the U.S. is also the highest in the world, the U.S. Department of Energy (USDoE) reports a motorization rate of 831.9 vehicles in operation per 1000 people in 2016, or a ratio of 1:1.2 vehicles to people.[1]
According to USDoE, the rate of motorization peaked in 2007 at 844.5 vehicles per 1000 people.[1] In terms of licensed drivers, as of 2009 the country had 1.0 vehicle for every licensed driver, and 1.87 vehicles per household.[32] Passenger car registrations in the United States declined -11.5% in 2017 and -12.8% in 2018.[33]
As of 2016, the stock of alternative fuel vehicles in the United States included over 20 million flex-fuel cars and light trucks, the world's second largest flexible-fuel fleet in the world after Brazil.[34] However, actual use of ethanol fuel is significantly limited due to the lack of E85 refueling infrastructure.[35]
Regarding the electrified segment, the fleet of hybrid electric vehicles in the United States is the second largest in the world after Japan, with more than four million units sold through April 2016.[36] Since the introduction of the Tesla Roadster electric car in 2008, cumulative sales of highway legal plug-in electric vehicles in the U.S. passed one million units in September 2018.[37][38] The U.S. stock of plug-in vehicles is the second largest after China (2.21 million by September 2018).[39]
As of 2017, the country's fleet also includes more than 160,000 natural gas vehicles, mainly transit buses and delivery fleets.[40] Despite its relative small size, natural gas use accounted for about 52% of all alternative fuels consumed by alternative transportation fuel vehicles in the U.S. in 2009.[41]
In the US a motor vehicle is specifically defined as a contrivance used for commercial purposes. As defined in US Code 18 U.S.C. § 31 : US Code - Section 31: Definitions (6) Motor vehicle. - The term "motor vehicle" means every description of carriage or other contrivance propelled or drawn by mechanical power and used for commercial purposes on the highways in the transportation of passengers, passengers and property, or property or cargo.
China
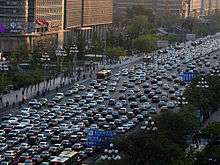
The People's Republic of China had 322 million motor vehicles in use at the end of September 2018, of which, 235 million were passenger cars in 2018, making China the country with largest motor vehicle fleet in the world.[6] In 2016, the motor vehicle fleet consisted of 165.6 million cars and 28.4 million trucks and buses.[1] About 13.6 million vehicles were sold in 2009, and motor vehicle registrations in 2010 increased to more than 16.8 million units, representing nearly half the world's fleet increase in 2010.[4][5] Ownership per capita rose from 26.6 vehicles per 1000 people in 2006 to 141.2 in 2016.[1]
The stock of highway-legal plug-in electric or new energy vehicles in China totaled 2.21 million units by the end of September 2018, of which, 81% are all-electric vehicles. These figures include heavy-duty commercial vehicles such buses and sanitation trucks, which represent about 11% of the total stock.[39] China is also the world's largest electric bus market, reaching about 385,000 units by the end of 2017.[42][43]
The number of cars and motorcycles in China increased 20 times between 2000 and 2010.[44] This explosive growth has allowed China to become the world's largest new car market, overtaking the US in 2009.[4][7] Nevertheless, ownership per capita is 58 vehicles per 1000 people, or a ratio of 1:17.2 vehicles to people, still well below the rate of motorization of developed countries.[5]
Japan
Japan had 73.9 million vehicles by 2010, and had the world's second largest motor vehicle fleet until 2009.[5] As of 2016, the registered motor vehicle fleet totaled 75.81 million vehicles consisting of 61,40 million cars and 14,41 million trucks and buses.[1] Japan has the largest hybrid electric vehicle fleet in the world.[36] As of March 2018, there were 7.51 million hybrids registered in the country, excluding kei cars, and representing 19.0% of all passenger cars on the road.[45]
Brazil
The Brazilian vehicle fleet reached 64.8 million vehicles in 2010, up from 29.5 million units in 2000, representing a 119% growth in ten years, and reaching a motorization rate of 340 vehicles per 1000 people.[47] In 2010 Brazil experienced the second largest fleet increase in the world after China, with 2.5 million vehicle registrations.[5]
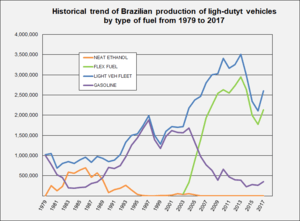
As of 2018, Brazil has the largest alternative fuel vehicle fleet in the world with about 40 million alternative fuel motor vehicles in the road. The clean vehicle stock includes 30.5 million flexible-fuel cars and light utility vehicles and over 6 million flex-fuel motorcycles by March 2018;[48] between 2.4 and 3.0 million neat ethanol vehicles still in use,[49][50] out of 5.7 million ethanol only light-vehicles produced since 1979;[51] and, as of December 2012, a total of 1.69 million natural gas vehicles.[21]
In addition, all the Brazilian gasoline-powered fleet is designed to operate with high ethanol blends, up to 25% ethanol fuel (E25).[52][53][54] The market share of flex fuel vehicles reached 88.6% of all light-duty vehicles registered in 2017.[48]
India
India's vehicle fleet had the second-largest growth rate after China in 2010, with 8.9%. The fleet went from 19.1 million in 2009 to 20.8 million units in 2010.[5] India's vehicle fleet has increased to 210 million in March 2015.[55] India has a fleet of 1.1 million natural gas vehicles as of December 2011 .[21]
Australia
As of January 2011, the Australian motor vehicle fleet had 16.4 million registered vehicles, with an ownership rate of 730 motor vehicles per 1000 people, up from 696 vehicles per 1000 residents in 2006. The motor vehicle fleet grew 14.5% since 2006, for an annual rate of 2.7% during this five-year period.[56]
Comparison by regions
The following table compares vehicle ownership rates by region with the US, the country with the highest motorization rate in the world, and how it has evolved from 1999 to 2016.
| Comparison of motorization rates by region and selected countries (1999 and 2016) (vehicles per 1000 people) | |||
|---|---|---|---|
| Country/Region | 1999[57] | 2006[1] | 2016[1] |
| Africa | 20.9 | 25.2 | 38.9 |
| Asia, Far East | 39.1 | 49.7 | 105.6 |
| Asia, Middle East | 66.2 | 99.8 | 147.4 |
| Brazil | 107.5 | 129.0 | 209.3 |
| Canada | 560.0 | 599.6 | 686.3 |
| Central and South America | 133.6 | 102.4 | 174.7 |
| China | 10.2 | 26.6 | 141.2 |
| Eastern Europe | 370.0 | 254.4 | 362.1 |
| Western Europe | 528.8 | 593.7 | 606.0 |
| India | 8.3 | 11.6 | 36.3 |
| Indonesia | 13.7 | 31.7 | 87.2 |
| Pacific | 513.9 | 524.7 | 634.9 |
| United States | 790.1 | 840.7 | 831.9 |
Production by country
In 2017, a total of 97.3 million cars and commercial vehicles were built worldwide, led by China, with about 29 million motor vehicles manufactured, followed by the United States with 11.2 million, and Japan with 9.7 million.[58] The following table shows the top 15 manufacturing countries for 2017 and their corresponding annual production between 2004 and 2017.
| World rank 2017 | Country | 2017 | 2016 | 2015 | 2014 | 2013 | 2012 | 2011 | 2010 | 2009 | 2008 | 2007 | 2006 | 2005 | 2004 |
|---|---|---|---|---|---|---|---|---|---|---|---|---|---|---|---|
| 1 | China | 29,015,434 | 28,118,794 | 24,503,326 | 23,722,890 | 22,116,825 | 19,271,808 | 18,418,876 | 18,264,761 | 13,790,994 | 9,299,180 | 8,882,456 | 7,188,708 | 5,717,619 | 5,234,496 |
| 2 | United States | 11,189,985 | 12,198,137 | 12,100,095 | 11,660,699 | 11,066,432 | 10,335,765 | 8,661,535 | 7,743,093 | 5,709,431 | 8,672,141 | 10,780,729 | 11,263,986 | 11,946,653 | 11,989,387 |
| 3 | Japan | 9,693,746 | 9,204,590 | 9,278,238 | 9,774,558 | 9,630,181 | 9,943,077 | 8,398,630 | 9,628,920 | 7,934,057 | 11,575,644 | 11,596,327 | 11,484,233 | 10,799,659 | 10,511,518 |
| 4 | Germany | 5,645,581 | 6,062,562 | 6,033,164 | 5,907,548 | 5,718,222 | 5,649,260 | 6,146,948 | 5,905,985 | 5,209,857 | 6,045,730 | 6,213,460 | 5,819,614 | 5,757,710 | 5,569,954 |
| 5 | India | 4,782,896 | 4,488,965 | 4,125,744 | 3,840,160 | 3,898,425 | 4,174,713 | 3,927,411 | 3,557,073 | 2,641,550 | 2,332,328 | 2,253,729 | 2,019,808 | 1,638,674 | 1,511,157 |
| 6 | South Korea | 4,114,913 | 4,228,509 | 4,555,957 | 4,524,932 | 4,521,429 | 4,561,766 | 4,657,094 | 4,271,741 | 3,512,926 | 3,826,682 | 4,086,308 | 3,840,102 | 3,699,350 | 3,469,464 |
| 7 | Mexico | 4,068,415 | 3,597,462 | 3,565,469 | 3,365,306 | 3,054,849 | 3,001,814 | 2,681,050 | 2,342,282 | 1,561,052 | 2,167,944 | 2,095,245 | 2,045,518 | 1,684,238 | 1,577,159 |
| 8 | Spain | 2,848,335 | 2,885,922 | 2,733,201 | 2,402,978 | 2,163,338 | 1,979,179 | 2,373,329 | 2,387,900 | 2,170,078 | 2,541,644 | 2,889,703 | 2,777,435 | 2,752,500 | 3,012,174 |
| 9 | Brazil | 2,699,672 | 2,156,356 | 2,429,463 | 3,146,118 | 3,712,380 | 3,402,508 | 3,407,861 | 3,381,728 | 3,182,923 | 3,215,976 | 2,977,150 | 2,611,034 | 2,530,840 | 2,317,227 |
| 10 | France | 2,227,000 | 2,082,000 | 1,970,000 | 1,817,000 | 1,740,000 | 1,967,765 | 2,242,928 | 2,229,421 | 2,047,693 | 2,568,978 | 3,015,854 | 3,169,219 | 3,549,008 | 3,665,990 |
| 11 | Canada | 2,199,789 | 2,370,271 | 2,283,474 | 2,393,890 | 2,379,834 | 2,463,364 | 2,135,121 | 2,068,189 | 1,490,482 | 2,082,241 | 2,578,790 | 2,572,292 | 2,687,892 | 2,711,536 |
| 12 | Thailand | 1,988,823 | 1,944,417 | 1,915,420 | 1,880,007 | 2,457,057 | 2,429,142 | 1,457,798 | 1,644,513 | 999,378 | 1,393,742 | 1,287,346 | 1,194,426 | 1,122,712 | 927,981 |
| 13 | United Kingdom | 1,749,385 | 1,816,622 | 1,682,156 | 1,598,879 | 1,597,872 | 1,576,945 | 1,463,999 | 1,393,463 | 1,090,139 | 1,649,515 | 1,750,253 | 1,648,388 | 1,803,109 | 1,856,539 |
| 14 | Turkey | 1,695,731 | 1,485,927 | 1,358,796 | 1,170,445 | 1,125,534 | 1,072,978 | 1,189,131 | 1,094,557 | 869,605 | 1,147,110 | 1,099,413 | 987,780 | 879,452 | 823,408 |
| 15 | Russia | 1,551,293 | 1,303,989 | 1,384,399 | 1,886,646 | 2,184,266 | 2,233,103 | 1,990,155 | 1,403,244 | 725,012 | 1,790,301 | 1,660,120 | 1,508,358 | 1,354,504 | 1,386,127 |
| World Total | 97,302,534 | 94,976,569 | 90,780,583 | 89,747,430 | 87,507,027 | 84,236,171 | 79,880,920 | 77,583,519 | 61,762,324 | 70,729,696 | 73,266,061 | 69,222,975 | 66,719,519 | 64,496,220 |
See also
- Effects of the car on societies
- Environmentally friendly vehicle
- History of the automobile
- List of countries by vehicles per capita
- List of countries by motor vehicle production
- List of countries by traffic-related death rate
- List of motor vehicle awards
- Motor vehicle emissions
- Peak car use
- Road traffic safety
- Sustainable transport
- Traffic congestion
References
- Stacy C. Davis; Susan E. Williams & Robert G. Boundy (August 2018). "Transportation Energy Data Book: Edition 36.2" (PDF). Oak Ridge National Laboratory. Retrieved 2018-12-15. See Quick Facts and Tables 3.4 through 3.11
- "ISO 3833:1977". International Organization for Standardization. Retrieved 2011-08-22.
- Sperling, Daniel and Deborah Gordon (2009). Two billion cars: driving toward sustainability. Oxford University Press, New York. pp. 4 and 13. ISBN 978-0-19-537664-7. See Chapter 1, Note 1, pp. 261: the authors use the term cars here to represent all conventional motor vehicles, be they cars, sport utility vehicles, minivans, trucks, buses, motorcycles, scooters, or three-wheeled motorized vehicles."
- "Automobiles and Truck Trends". Plunkett Research. Retrieved 2011-08-18.
- John Sousanis (2011-08-15). "World Vehicle Population Tops 1 Billion Units". Ward AutoWorld. Archived from the original on 2011-08-27. Retrieved 2011-08-18.
- "China car population reaches 235 million units, Ministry of Public Security". Gasgoo. 2018-10-18. Retrieved 2019-01-22. The number of passenger cars in use in China totaled 235 million units as of the end of September 2018, of which, 2.21 million units new energy cars
- "China car sales 'overtook the US' in 2009". BBC News. 2010-01-11. Retrieved 2011-08-19.
- John Voelcker (2012-03-29). "80 Million Vehicles Built Globally Last Year - A New Record". Green Car Reports. Retrieved 2012-03-29.
- Navigant Consulting (2014). "Executive Summary: Transportation Forecast: Light Duty Vehicles (2014-2035)" (PDF). Navigant Research. Retrieved 2015-03-14.
- Ward's (2014). "Motorization Rate 2013 – Worldwide". Organisation Internationale des Constructeurs d'Automobiles (OICA). Retrieved 2015-03-14.
- "Motorization, Demand & City Development". The World Bank. Retrieved 2011-08-21.
- Stacy C. Davis; Susan W. Diegel & Robert G. Boundy (June 2011). "Transportation Energy Data Book: Edition 30" (PDF). Office of Energy Efficiency and Renewable Energy, U.S. Department of Energy. Retrieved 2012-09-24. See Tables 3.1 and 3.2 for figures from 1960 to 2005
- Stacy C. Davis; Susan W. Diegel & Robert G. Boundy (July 2012). "Transportation Energy Data Book: Edition 31" (PDF). Office of Energy Efficiency and Renewable Energy, U.S. Department of Energy. Retrieved 2012-09-25. See Tables 3.2 and 3.3 for 2009 figures
- Stacy C. Davis; Susan W. Diegel & Robert G. Boundy (July 2014). "Transportation Energy Data Book: Edition 33" (PDF). Office of Energy Efficiency and Renewable Energy, U.S. Department of Energy. Archived from the original (PDF) on 2015-06-30. Retrieved 2015-03-14. See Tables 3.2 and 3.3 for 2010 and 2012 figures
- Stacy C. Davis; Susan E. Williams & Robert G. Boundy (July 2016). "Transportation Energy Data Book: Edition 35" (PDF). Vehicle Technologies Office, Office of Energy Efficiency and Renewable Energy, U.S. Department of Energy. Retrieved 2017-08-24. See Tables 3.2 and 3.3 for 2010, 2012 and 2014 figures
- "Vehicles in Use". European Automobile Manufacturers Association. Retrieved 2011-08-23.
- "Car fleet by country 2008" (PDF). European Automobile Manufacturers Association. 2011-08-15. Archived from the original (PDF) on 2011-09-27. Retrieved 2011-08-23.
- "Motorisation rate". Eurostat. Retrieved 2011-08-22. Eurostat defines this indicator "as the number of passenger cars per 1 000 inhabitants. A passenger car is a road motor vehicle, other than a motorcycle, intended for the carriage of passengers and designed to seat no more than nine persons (including the driver); the term "passenger car" therefore covers microcars (need no permit to be driven), taxis and hired passenger cars, provided that they have fewer than 10 seats; this category may also include pick-ups."
- "Energy, transport and environment indicators - eurostat Pocketbooks" (PDF). Eurostat. 2010. Archived from the original (PDF) on 2011-09-16. Retrieved 2011-08-23. See table 2.1.1 (pp. 92) and table 2.1.4 (pp.98) The rates were obtained adding the light vehicle motorization rates with the heavy vehicle rates.
- "Motorization rate". Eurostat. Retrieved 2013-08-07.
- "Natural Gas Vehicle Statistics: Summary Data 2010". International Association for Natural Gas Vehicles. Archived from the original on July 1, 2012. Retrieved 2011-08-02.
- BAFF. "Bought ethanol cars". BioAlcohol Fuel Foundation. Archived from the original on 2011-07-21. Retrieved 2011-08-02. See Graph "Bought flexifuel vehicles"
- "Electric cars exceed 1m in Europe as sales soar by more than 40%". The Guardian. 2018-08-26. Retrieved 2018-10-23.
- Cobb, Jeff (2017-01-16). "The World Just Bought Its Two-Millionth Plug-in Car". HybridCars.com. Retrieved 2017-01-17.
- Cobb, Jeff (2017-01-17). "Top 10 Plug-in Vehicle Adopting Countries of 2016". HybridCars.com. Retrieved 2017-01-18.
- Jose, Pontes (2018-01-28). "Europe December 2017". EVSales.com. Retrieved 2018-02-25. "European sales totaled 306,143 plug-in cars in 2017."
- Norsk Elbilforening (Norwegian Electric Vehicle Association) (January 2019). "Norwegian EV market". Norsk Elbilforening. Retrieved 2019-01-10. Place the pointing device over the graph to show the cumulative number of electric vehicles and plug-in hybrids in Norway at the end of each year. As of 31 December 2018, the registered light-duty plug-in electric stock totaled 296,214 units, consisting of 200,192 battery electric vehicles and 96,022 plug-in hybrids.
- Kane, Mark (2018-10-07). "10% Of Norway's Passenger Vehicles Are Plug Ins". InsideEVs.com. Retrieved 2018-11-07.
- Miley, Jessica (2018-10-02). "45% of New Cars Sold in Norway in September were All-Electric Vehicles". Interesting Engineering. Retrieved 2018-11-10.
Despite the huge increase in new electric cars on the road, EVs still only account for roughly 10% of all of Norway's vehicles.
- Opplysningsrådet for Veitrafikken AS (OFV). "Bilsalget i 2017" [Car sales in 2017] (in Norwegian). OFV. Retrieved 2018-01-11.
- Norwegian Road Federation (OFV) (2019-01-02). "Bilsalget i 2018" [Car sales in 2018] (in Norwegian). OFV. Retrieved 2019-01-03.
- Davis; et al. (2011). "op. cit": 8–6. Cite journal requires
|journal=(help) See Table 8.5 - "OECD Passenger car registrations". Key short-term indicators, Main Economic Indicators. OECD. Retrieved 2019-04-01.
- "Alternative Fuels Data Center: Flexible Fuel Vehicles". Alternative Fuels and Advanced Vehicles Data Center. U.S. Department of Energy. Retrieved 2018-12-15.
- National Renewable Energy Laboratory USDoE (2007-09-17). "Alternative and Advanced Vehicles: Flexible Fuel Vehicles". Alternative Fuels and Advanced Vehicles Data Center. Retrieved 2008-08-19.
- Cobb, Jeff (2016-06-06). "Americans Buy Their Four-Millionth Hybrid Car". HybridCars.com. Retrieved 2016-06-06.
- Kane, Mark (2018-10-06). "Plug-In Electric Cars Sales In U.S. Surpass 1 Million". InsideEVs.com. Retrieved 2018-10-21.
- Argonne National Laboratory (2018-11-26). "FOTW #1057, November 26, 2018: One Million Plug-in Vehicles Have Been Sold in the United States". Vehicle Technologies Office, US DoE. Retrieved 2018-12-01.
- Automotive News China (2018-10-19). "China's electrified vehicle fleet tops 2.21 million". Automotive News China. Retrieved 2018-10-21.
China’s fleet of electric vehicles and plug-in hybrids topped 2.21 million by the end of September as sales of electrified vehicles continued to surge in the country. Of the total, EVs accounted for 1.78 million, or nearly 81 percent. The rest were plug-in hybrids, China’s Ministry of Public Security said this week. Electrified cargo vehicles -- which include trucks, pickups and delivery vans -- approached 254,000, representing 11 percent of the electrified vehicle fleet as of last month.
- "Alternative Fuels Data Center: Natural Gas Vehicles". Alternative Fuels and Advanced Vehicles Data Center. U.S. Department of Energy. Retrieved 2018-12-15.
- "EIA: consumption of alternative transportation fuels held steady in 2009". Green Car Congress. 2011-08-11. Retrieved 2011-08-24.
- Dale Hall, Hongyang Cui, Nic Lutsey (2018-10-30). "Electric vehicle capitals: Accelerating the global transition to electric drive". The International Council on Clean Transportation. Retrieved 2018-11-01.CS1 maint: multiple names: authors list (link) Click on "Download File" to get the full report, 15 pp.
- International Energy Agency (IEA), Clean Energy Ministerial, and Electric Vehicles Initiative (EVI) (May 2016). "Global EV Outlook 2016: Beyond one million electric cars" (PDF). IEA Publications. Archived from the original (PDF) on 2016-08-24. Retrieved 2016-09-07.CS1 maint: multiple names: authors list (link) See pp. 4–5, and 24–25 and Statistical annex, pp. 34–37.
- Jonathan Watts (2011-08-24). "China's love affair with the car shuns green vehicles". The Guardian. Retrieved 2011-08-24.
- "Hybrids account for nearly 20 percent of cars in Japan, automobile association says". The Japan Times. 2018-10-27. Retrieved 2018-12-15.
- Anuário da Indústria Automobilística Brasileira 2018, ANFAVEA
- Ardilhes Moreira (2011-02-13). "Frota de veículos cresce 119% em dez anos no Brasil, aponta Denatran" (in Portuguese). Globo.com. Retrieved 2011-08-23.
- Curcio, Mário (2018-03-23). "Carro flex chega aos 15 anos com 30,5 milhões de unidades" [Flex car arrives at 15 with 30.5 million units]. Automotive Business (in Portuguese). Retrieved 2018-12-15.
- Alfred Szwarc. "Abstract: Use of Bio-fuels in Brazil" (PDF). United Nations Framework Convention on Climate Change. Retrieved 2009-10-24.
- Luiz A. Horta Nogueira (2004-03-22). "Perspectivas de un Programa de Biocombustibles en América Central: Proyecto Uso Sustentable de Hidrocarburos" (PDF) (in Spanish). Comisión Económica para América Latina y el Caribe (CEPAL). Archived from the original (PDF) on 2008-05-28. Retrieved 2008-05-09.
- ANFAVEA. "Anúario da Industria Automobilistica Brasileira 2012: Tabela 2.3 Produção por combustível - 1957/2012" (in Portuguese). ANFAVEA - Associação Nacional dos Fabricantes de Veículos Automotores (Brasil). Retrieved 2013-11-17. pp. 60-61.
- Goettemoeller, Jeffrey; Adrian Goettemoeller (2007). Sustainable Ethanol: Biofuels, Biorefineries, Cellulosic Biomass, Flex-Fuel Vehicles, and Sustainable Farming for Energy Independence. Prairie Oak Publishing, Maryville, Missouri. pp. 56–61. ISBN 978-0-9786293-0-4.
- "Portaria Nº 143, de 27 de Junho de 2007" (in Portuguese). Ministério da Agricultura, Pecuária e Abastecimento. Retrieved 2008-10-05. This decree fixed the mandatory blend at 25% starting July 1, 2007
- "Lei Nº 8.723, de 28 de Outubro de 1993. Dispõe sobre a redução de emissão de poluentes por veículos automotores e dá outras providências" (in Portuguese). Casa Civil da Presidência da República. Archived from the original on 2008-10-06. Retrieved 2008-10-05. See article 9º and modifications approved by Law Nº 10.696, 2003-07-02 increasing the upper limit to 25%
- "Registered Motor Vehicles in India as on 31.03. 2015". Open Government Data (OGD) Platform India. Government of India. Retrieved 1 February 2018.
- "Motor Vehicle Census, Australia, 31 Jan 2011". Australian Bureau of Statistics. 2011-07-28. Retrieved 2011-08-23.
- Davis; et al. (2011). "op. cit": 3-8 and 3-9. Cite journal requires
|journal=(help) See Tables 3.4 and 3.5 - International Organization of Motor Vehicle Manufacturers(OICA). "2017 Production Statistics". OICA. Retrieved 2018-12-15.
External links
| Wikimedia Commons has media related to Motor vehicles. |
| By country |
| ||||||||||||
|---|---|---|---|---|---|---|---|---|---|---|---|---|---|
| Data |
| ||||||||||||
| History |
| ||||||||||||
| Manufacturers |
| ||||||||||||
| Organisations |
| ||||||||||||
| Related topics |
| ||||||||||||
| |||||||||||||