Hertzsprung–Russell diagram
The Hertzsprung–Russell diagram, abbreviated as H–R diagram, HR diagram or HRD, is a scatter plot of stars showing the relationship between the stars' absolute magnitudes or luminosities versus their stellar classifications or effective temperatures. The diagram was created independently in around 1910 by Ejnar Hertzsprung and Henry Norris Russell, and represented a major step towards an understanding of stellar evolution.
Historical background
In the nineteenth-century large-scale photographic spectroscopic surveys of stars were performed at Harvard College Observatory, producing spectral classifications for tens of thousands of stars, culminating ultimately in the Henry Draper Catalogue. In one segment of this work Antonia Maury included divisions of the stars by the width of their spectral lines.[1] Hertzsprung noted that stars described with narrow lines tended to have smaller proper motions than the others of the same spectral classification. He took this as an indication of greater luminosity for the narrow-line stars, and computed secular parallaxes for several groups of these, allowing him to estimate their absolute magnitude.[2]
In 1910 Hans Rosenberg published a diagram plotting the apparent magnitude of stars in the Pleiades cluster against the strengths of the calcium K line and two hydrogen Balmer lines.[3] These spectral lines serve as a proxy for the temperature of the star, an early form of spectral classification. The apparent magnitude of stars in the same cluster is equivalent to their absolute magnitude and so this early diagram was effectively a plot of luminosity against temperature. The same type of diagram is still used today as a means of showing the stars in clusters without having to initially know their distance and luminosity.[4] Hertzsprung had already been working with this type of diagram, but his first publications showing it were not until 1911. This was also the form of the diagram using apparent magnitudes of a cluster of stars all at the same distance.[5]
Russell's early (1913) versions of the diagram included Maury's giant stars identified by Hertzsprung, those nearby stars with parallaxes measured at the time, stars from the Hyades (a nearby open cluster), and several moving groups, for which the moving cluster method could be used to derive distances and thereby obtain absolute magnitudes for those stars.[6]
Forms of diagram
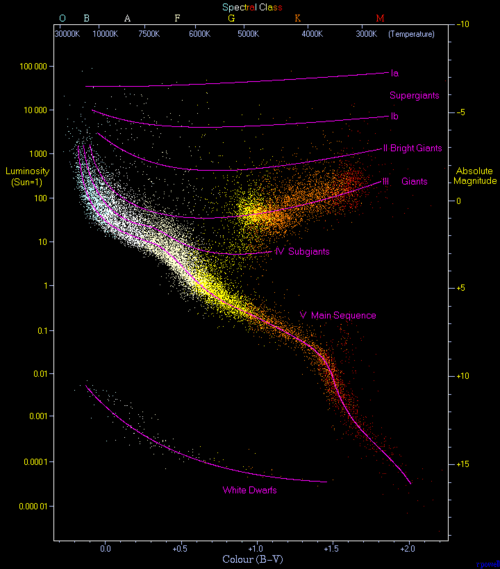
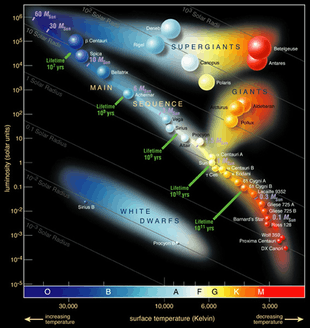
There are several forms of the Hertzsprung–Russell diagram, and the nomenclature is not very well defined. All forms share the same general layout: stars of greater luminosity are toward the top of the diagram, and stars with higher surface temperature are toward the left side of the diagram.
The original diagram displayed the spectral type of stars on the horizontal axis and the absolute visual magnitude on the vertical axis. The spectral type is not a numerical quantity, but the sequence of spectral types is a monotonic series that reflects the stellar surface temperature. Modern observational versions of the chart replace spectral type by a color index (in diagrams made in the middle of the 20th Century, most often the B-V color) of the stars. This type of diagram is what is often called an observational Hertzsprung–Russell diagram, or specifically a color–magnitude diagram (CMD), and it is often used by observers.[7] In cases where the stars are known to be at identical distances such as within a star cluster, a color–magnitude diagram is often used to describe the stars of the cluster with a plot in which the vertical axis is the apparent magnitude of the stars. For cluster members, by assumption there is a single additive constant difference between their apparent and absolute magnitudes, called the distance modulus, for all of that cluster of stars. Early studies of nearby open clusters (like the Hyades and Pleiades) by Hertzsprung and Rosenberg produced the first CMDs, a few years before Russell's influential synthesis of the diagram collecting data for all stars for which absolute magnitudes could be determined.[3][5]
Another form of the diagram plots the effective surface temperature of the star on one axis and the luminosity of the star on the other, almost invariably in a log-log plot. Theoretical calculations of stellar structure and the evolution of stars produce plots that match those from observations. This type of diagram could be called temperature-luminosity diagram, but this term is hardly ever used; when the distinction is made, this form is called the theoretical Hertzsprung–Russell diagram instead. A peculiar characteristic of this form of the H–R diagram is that the temperatures are plotted from high temperature to low temperature, which aids in comparing this form of the H–R diagram with the observational form.
Although the two types of diagrams are similar, astronomers make a sharp distinction between the two. The reason for this distinction is that the exact transformation from one to the other is not trivial. To go between effective temperature and color requires a color–temperature relation, and constructing that is difficult; it is known to be a function of stellar composition and can be affected by other factors like stellar rotation. When converting luminosity or absolute bolometric magnitude to apparent or absolute visual magnitude, one requires a bolometric correction, which may or may not come from the same source as the color–temperature relation. One also needs to know the distance to the observed objects (i.e., the distance modulus) and the effects of interstellar obscuration, both in the color (reddening) and in the apparent magnitude (where the effect is called "extinction"). Color distortion (including reddening) and extinction (obscuration) are also apparent in stars having significant circumstellar dust. The ideal of direct comparison of theoretical predictions of stellar evolution to observations thus has additional uncertainties incurred in the conversions between theoretical quantities and observations.
Interpretation
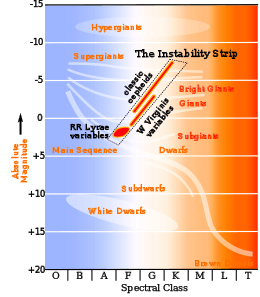
Most of the stars occupy the region in the diagram along the line called the main sequence. During the stage of their lives in which stars are found on the main sequence line, they are fusing hydrogen in their cores. The next concentration of stars is on the horizontal branch (helium fusion in the core and hydrogen burning in a shell surrounding the core). Another prominent feature is the Hertzsprung gap located in the region between A5 and G0 spectral type and between +1 and −3 absolute magnitudes (i.e. between the top of the main sequence and the giants in the horizontal branch). RR Lyrae variable stars can be found in the left of this gap on a section of the diagram called the instability strip. Cepheid variables also fall on the instability strip, at higher luminosities.
The H-R diagram can be used by scientists to roughly measure how far away a star cluster or galaxy is from Earth. This can be done by comparing the apparent magnitudes of the stars in the cluster to the absolute magnitudes of stars with known distances (or of model stars). The observed group is then shifted in the vertical direction, until the two main sequences overlap. The difference in magnitude that was bridged in order to match the two groups is called the distance modulus and is a direct measure for the distance (ignoring extinction). This technique is known as main sequence fitting and is a type of spectroscopic parallax. Not only the turn-off in the main sequence can be used, but also the tip of the red giant branch stars.[8][9]
The diagram seen by ESA's Gaia mission

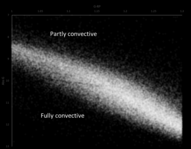
ESA's Gaia mission showed several features in the diagram that were either not known or that were suspected to exist. It found a gap in the main sequence that appears for M-dwarfs and that is explained with the transition from a partly convective core to a fully convective core.[10][11] For white dwarfs the diagram shows several features. Two main concentrations appear in this diagram following the cooling sequence of white dwarfs that are explained with the atmospheric composition of white dwarfs, especially hydrogen versus helium dominated atmospheres of white dwarfs.[12] A third concentration is explained with core crystallization of the white dwarfs interior. This releases energy and delays the cooling of white dwarfs.[13][14]
Diagram's role in the development of stellar physics
Contemplation of the diagram led astronomers to speculate that it might demonstrate stellar evolution, the main suggestion being that stars collapsed from red giants to dwarf stars, then moving down along the line of the main sequence in the course of their lifetimes. Stars were thought therefore to radiate energy by converting gravitational energy into radiation through the Kelvin–Helmholtz mechanism. This mechanism resulted in an age for the Sun of only tens of millions of years, creating a conflict over the age of the Solar System between astronomers, and biologists and geologists who had evidence that the Earth was far older than that. This conflict was only resolved in the 1930s when nuclear fusion was identified as the source of stellar energy.
Following Russell's presentation of the diagram to a meeting of the Royal Astronomical Society in 1912, Arthur Eddington was inspired to use it as a basis for developing ideas on stellar physics. In 1926, in his book The Internal Constitution of the Stars he explained the physics of how stars fit on the diagram.[15] The paper anticipated the later discovery of nuclear fusion and correctly proposed that the star's source of power was the combination of hydrogen into helium, liberating enormous energy. This was a particularly remarkable intuitive leap, since at that time the source of a star's energy was still unknown, thermonuclear energy had not been proven to exist, and even that stars are largely composed of hydrogen (see metallicity), had not yet been discovered. Eddington managed to sidestep this problem by concentrating on the thermodynamics of radiative transport of energy in stellar interiors.[16] Eddington predicted that dwarf stars remain in an essentially static position on the main sequence for most of their lives. In the 1930s and 1940s, with an understanding of hydrogen fusion, came an evidence-backed theory of evolution to red giants following which were speculated cases of explosion and implosion of the remnants to white dwarfs. The term supernova nucleosynthesis is used to describe the creation of elements during the evolution and explosion of a pre-supernova star, a concept put forth by Fred Hoyle in 1954.[17] The pure mathematical quantum mechanics and classical mechanical models of stellar processes enable the Hertzsprung–Russell diagram to be annotated with known conventional paths known as stellar sequences — there continue to be added rarer and more anomalous examples as more stars are analysed and mathematical models considered.
See also
- Asymptotic giant branch – Stars powered by fusion of hydrogen and helium in shell with an inactive core of carbon and oxygen
- Galaxy color–magnitude diagram
- Hayashi track
- Henyey track
- Hess diagram
- Red clump – A clustering of red giants in the Hertzsprung–Russell diagram at around 5,000 K and absolute magnitude +0.5
- Stellar birthline
- Stellar classification – Classification of stars based on their spectral characteristics
- Tip of the red-giant branch
- Color–color diagram
References
- A.C. Maury; E.C. Pickering (1897). "Spectra of bright stars photographed with the 11-inch Draper Telescope as part of the Henry Draper Memorial". Annals of Harvard College Observatory. 28: 1–128. Bibcode:1897AnHar..28....1M.
- Hertzprung, Ejnar (1908). "Über die Sterne der Unterabteilung c und ac nach der Spektralklassifikation von Antonia C. Maury". Astronomische Nachrichten. 179 (24): 373–380. Bibcode:1909AN....179..373H. doi:10.1002/asna.19081792402.
- Rosenberg, Hans (1910). "Über den Zusammenhang von Helligkeit und Spektraltypus in den Plejaden" (PDF). Astronomische Nachrichten. 186 (5): 71–78. Bibcode:1910AN....186...71R. doi:10.1002/asna.19101860503.
- Vandenberg, D. A.; Brogaard, K.; Leaman, R.; Casagrande, L. (2013). "The Ages of 95 Globular Clusters as Determined Using an Improved Method Along with Color-Magnitude Diagram Constraints, and Their Implications for Broader Issues". The Astrophysical Journal. 775 (2): 134. arXiv:1308.2257. Bibcode:2013ApJ...775..134V. doi:10.1088/0004-637X/775/2/134.
- Hertzsprung, E., 1911, Uber die Verwendung Photographischer Effektiver Wellenlaengen zur Bestimmung von Farbenaequivalenten, Publikationen des Astrophysikalischen Observatoriums zu Potsdam, 22. Bd., 1. Stuck = Nr.63
Hertzsprung, E. (1911). "On the Use of Photographic Effective Wavelengths for the Determination of Color Equivalents". Publications of the Astrophysical Observatory in Potsdam. 1. 22 (63). - Russell, Henry Norris (1914). "Relations Between the Spectra and Other Characteristics of the Stars". Popular Astronomy. 22: 275–294. Bibcode:1914PA.....22..275R.
- Palma, Dr. Christopher (2016). "The Hertzsprung-Russell Diagram". ASTRO 801: Planets, Stars, Galaxies, and the Universe. John A. Dutton e-Education Institute: College of Earth and Mineral Sciences: The Pennsylvania State University. Retrieved 2017-01-29.
The quantities that are easiest to measure... are color and magnitude, so most observers ... refer to the diagram as a 'Color–Magnitude diagram' or 'CMD' rather than an HR diagram.
- Da Costa, G. S.; Armandroff, T. E. (July 1990). "Standard globular cluster giant branches in the (MI,(V–I)O) plane". Astronomical Journal. 100: 162–181. Bibcode:1990AJ....100..162D. doi:10.1086/115500. ISSN 0004-6256.
- Müller, Oliver; Rejkuba, Marina; Jerjen, Helmut (July 2018). "Tip of the Red Giant Branch Distances to the Dwarf Galaxies Dw1335-29 and Dw1340-30 in the Centaurus Group". Astronomy & Astrophysics. 615. A96. arXiv:1803.02406. Bibcode:2018A&A...615A..96M. doi:10.1051/0004-6361/201732455.
- "Mind the Gap: Gaia Mission Reveals the Insides of Stars". Sky & Telescope. 2018-08-06. Retrieved 2020-02-19.
- Jao, Wei-Chun; Henry, Todd J.; Gies, Douglas R.; Hambly, Nigel C. (July 2018). "A Gap in the Lower Main Sequence Revealed by Gaia Data Release 2". ApJL. 861 (1): L11. arXiv:1806.07792. doi:10.3847/2041-8213/aacdf6. ISSN 0004-637X.
- Collaboration, Gaia; Babusiaux, C.; van Leeuwen, F.; Barstow, M. A.; Jordi, C.; Vallenari, A.; Bossini, D.; Bressan, A.; Cantat-Gaudin, T.; van Leeuwen, M.; Brown, A. G. A. (August 2018). "Gaia Data Release 2. Observational Hertzsprung-Russell diagrams". A&A. 616: A10. doi:10.1051/0004-6361/201832843. ISSN 0004-6361.
- "ESA Science & Technology - Gaia reveals how Sun-like stars turn solid after their demise". sci.esa.int. Retrieved 2020-02-19.
- Tremblay, Pier-Emmanuel; Fontaine, Gilles; Fusillo, Nicola Pietro Gentile; Dunlap, Bart H.; Gänsicke, Boris T.; Hollands, Mark A.; Hermes, J. J.; Marsh, Thomas R.; Cukanovaite, Elena; Cunningham, Tim (January 2019). "Core crystallization and pile-up in the cooling sequence of evolving white dwarfs". Nature. 565 (7738): 202–205. arXiv:1908.00370. doi:10.1038/s41586-018-0791-x. ISSN 0028-0836.
- Eddington, A. S. (Oct 1920). "The Internal Constitution of the Stars". The Scientific Monthly. 11 (4): 297–303. Bibcode:1920SciMo..11..297E. JSTOR 6491.
- Eddington, A. S. (1916). "On the radiative equilibrium of the stars". Monthly Notices of the Royal Astronomical Society. 77: 16–35. Bibcode:1916MNRAS..77...16E. doi:10.1093/mnras/77.1.16.
- Hoyle, F. (1954). "On Nuclear Reactions Occurring in Very Hot Stars. I. the Synthesis of Elements from Carbon to Nickel". Astrophysical Journal Supplement. 1: 121. Bibcode:1954ApJS....1..121H. doi:10.1086/190005.

Bibliography
- Casagrande, L.; Portinari, L.; Flynn, C. (November 2006). "Accurate fundamental parameters for lower main-sequence stars". MNRAS. 373 (1): 13–44. arXiv:astro-ph/0608504. Bibcode:2006MNRAS.373...13C. doi:10.1111/j.1365-2966.2006.10999.x.
- Porter, Roy (2003). The Cambridge History of Science. Cambridge, UK: Cambridge University Press. p. 518. ISBN 978-0-521-57243-9.
- Sekiguchi, Maki; Fukugita, Masataka (August 2000). "A Study of the B-V Color-Temperature Relation". The Astronomical Journal. 120 (2): 1072–1084. arXiv:astro-ph/9904299. Bibcode:2000AJ....120.1072S. doi:10.1086/301490. Retrieved 2008-09-14.
- Smith, Robert (1995). Observational Astrophysics. Cambridge, UK: Cambridge University Press. p. 236. ISBN 978-0-521-27834-8.
External links
| Wikimedia Commons has media related to Hertzsprung–Russell diagram. |
- Omega Cen H-R animation of a Hertzsprung–Russell diagram created from real Hubble data
- JavaHRD an interactive Hertzsprung–Russell diagram as a Java applet
- BaSTI a Bag of Stellar Tracks and Isochrones, simulations with FRANEC code by Teramo Astronomical Observatory
- Leos Ondra: The first Hertzsprung-Russell diagram
- Who first published a Hertzsprung-Russell diagram? Hertzsprung or Russell? Answer: neither!
| Formation |
|
|---|---|
| Evolution |
|
| Spectral classification |
|
| Remnants |
|
| Hypothetical |
|
| Stellar nucleosynthesis |
|
| Structure |
|
| Properties |
|
| Star systems | |
| Earth-centric observations |
|
| Lists |
|
| Related articles |
|