Cook County, Illinois
Cook County is the most populous county in the U.S. state of Illinois and the second-most-populous county in the United States after Los Angeles County, California. As of 2019, the population was 5,150,233. Its county seat is Chicago, the most populous city in Illinois and the third-most-populous city in the United States. More than 40% of all residents of Illinois live in Cook County.
Cook County, Illinois | |
|---|---|
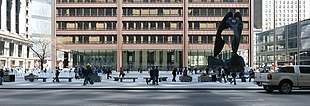 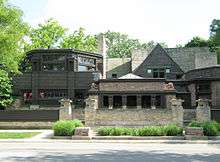  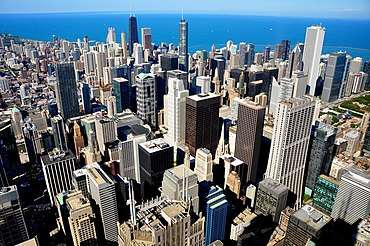 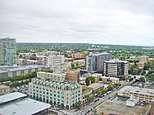 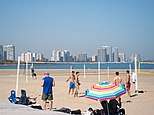 From top, left to right: Cook County Circuit Court at Daley Center, Frank Lloyd Wright's Studio, Forest Preserves, aerial view of Downtown Chicago, Evanston, beach on Lake Michigan | |
 Flag  Seal | |
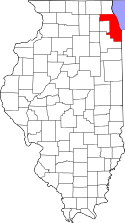 Location within Illinois | |
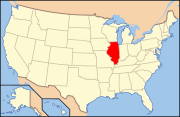 Illinois' location within the United States | |
| Coordinates: 41°48′31″N 87°53′20″W | |
| Country | United States |
| State | Illinois |
| Region | Northern Illinois |
| Metro area | Chicago Metropolitan |
| Incorporated | January 15, 1831 |
| Named for | Daniel Cook |
| County seat | Chicago |
| Largest city | Chicago |
| Incorporated municipalities | 135 (total)
|
| Government | |
| • Type | County |
| • Body | Board of Commissioners |
| • Board President | Toni R. Preckwinkle (D) |
| • County Board | 17 commissioners |
| Area | |
| • County | 1,635 sq mi (4,230 km2) |
| • Land | 945 sq mi (2,450 km2) |
| • Water | 690 sq mi (1,800 km2) |
| • Metro | 10,874 sq mi (28,160 km2) |
| Area rank | 6th largest county in Illinois |
| Highest elevation | 950 ft (290 m) |
| Lowest elevation | 580 ft (180 m) |
| Population (2010) | |
| • County | 5,194,675 |
| • Estimate (2019) | 5,150,233 |
| • Rank | 1st most populous county in Illinois 2nd most populous county in U.S. |
| • Density | 3,200/sq mi (1,200/km2) |
| • Metro | 9,522,434 |
| Time zone | UTC−6 (Central) |
| • Summer (DST) | UTC−5 (Central) |
| ZIP Code prefixes | 600xx–608xx |
| Area codes | 224/847, 312/872, 773/872, 708 |
| Congressional districts | 1st, 2nd, 3rd, 4th, 5th, 6th, 7th, 8th, 9th 10th and 11th |
| FIPS code | 17-031 |
| GNIS feature ID | 1784766 |
| Interstates | |
| U.S. Routes | |
| State Routes | |
| Airports | Chicago O'Hare International Chicago Midway International Chicago Executive Lansing Municipal Schaumburg Regional |
| Major Waterways | Lake Michigan – Chicago River Chicago Sanitary and Ship Canal Calumet River – Des Plaines River North Shore Channel |
| Amtrak stations | Chicago Union Station Glenview – Homewood La Grange – Summit |
| Public transit | Chicago Transit Authority (CTA) Metra – Pace – South Shore Line |
| Website | www.cookcountyil.gov |
| Demographics (2010)[4] | |||
|---|---|---|---|
| White | Black | Asian | |
| 55.4% | 24.8% | 6.2% | |
| Islander | Native | Other | Hispanic (any race) |
| 0.0% | 0.4% | 13.1% | 24.0% |
Cook County was incorporated in 1831 and named for Daniel Pope Cook, an early Illinois statesman, although there is no record of Cook having ever visited the area. It achieved its present boundaries in 1839. During the first half of the 20th century it had the absolute majority of Illinois's population.
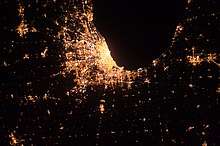
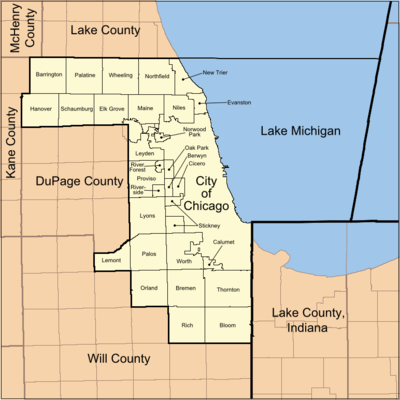
There are 135 municipalities located partially or wholly within Cook County, the largest of which is Chicago, home to approximately 54% of the county's population. The part of the county outside of the Chicago and Evanston city limits is divided into 29 townships; these often divide or share governmental services with local municipalities. Townships within Chicago were abolished in 1902 but are retained for real estate assessment purposes. Evanston Township was formerly coterminous with the City of Evanston but was abolished in 2014.
Geographically, the county is the sixth-largest in Illinois by land area. It shares the state's Lake Michigan shoreline with Lake County. Including its lake area, Cook County has a total area of 1,635 square miles (4,234.6 km2), the largest county in Illinois, of which 945 square miles (2,447.5 km2) is land and 690 square miles (1,787.1 km2) (42.16%) is water. Land-use in Cook County is mainly urban and densely populated.
Cook County's population is larger than that of 28 individual U.S. states, and the combined populations of the seven smallest states.[5] It is included in the Chicago–Naperville–Elgin, IL–IN–WI Metropolitan Statistical Area, and is surrounded by what are known as the five collar counties.
History
Cook County was created on January 15, 1831, out of Putnam County by an act of the Illinois General Assembly. It was the 54th county established in Illinois and was named after Daniel Cook, one of the earliest and youngest statesmen in Illinois history. He served as the second U.S. Representative from Illinois and the state's first Attorney General. In 1839, DuPage County was carved out of Cook County.
 Cook County from 1831 to 1836
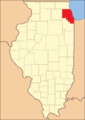 Cook County 1836–39 after the creation of McHenry and Will Counties
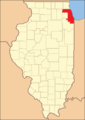 Cook County was reduced to its current size in 1839 by the creation of DuPage County.
Government and politics
Government
The government of Cook County is primarily composed of the Board of Commissioners, other elected officials such as the Sheriff, State's Attorney, Treasurer, Board of Review, Clerk, Assessor, Recorder, Circuit Court judges, and Circuit Court Clerk, as well as numerous other officers and entities. Cook County is the only home rule county in Illinois.[6] The Cook County Code is the codification of Cook County's local ordinances. Cook County's current County Board president is Toni Preckwinkle.
The Circuit Court of Cook County, which is an Illinois state court of general jurisdiction is funded, in part, by Cook County, and accepts more than 1.2 million cases each year for filing.[7] The Cook County Department of Corrections, also known as the Cook County Jail, is the largest single-site jail in the nation. The Cook County Juvenile Detention Center, under the authority of the Chief Judge of the court, is the first juvenile center in the nation and one of the largest in the nation. The Cook County Law Library is the second-largest county law library in the nation.
In the 1980s, Cook County was ground zero to an extensive FBI investigation called Operation Greylord. Ninety-two officials were indicted, including 17 judges, 48 lawyers, eight policemen, 10 deputy sheriffs, eight court officials, and a state legislator.
The Bureau of Health Services administers the county's public health services and is the third-largest public health system in the nation. Three hospitals are part of this system: John H. Stroger, Jr. Hospital of Cook County, Provident Hospital, and Oak Forest Hospital of Cook County, along with over 30 clinics.
The Cook County Department of Transportation is responsible for the design and maintenance of roadways in the county. These thoroughfares are composed mostly of major and minor arterials, with a few local roads. Although the County Department of Transportation was instrumental in designing many of the expressways in the county, today they are under the jurisdiction of the state.
The Cook County Forest Preserves, organized in 1915, is a separate, independent taxing body, but the Cook County Board of Commissioners also acts as its Board of Commissioners. The district is a belt of 69,000 acres (280 km2) of forest reservations surrounding the city of Chicago. The Brookfield Zoo (managed by the Chicago Zoological Society) and the Chicago Botanic Garden (managed by the Chicago Horticultural Society) are located in the forest preserves.
Cook County is the fifth-largest employer in Chicago.[8]
In March 2008, the County Board increased the sales tax by one percent to 1.75 percent. This followed a quarter-cent increase in mass transit taxes. In Chicago, the rate increased to 10.25 percent, the steepest nominal rate of any major metropolitan area in America. In Evanston, sales tax reached 10 percent and Oak Lawn residents pay 9.5 percent.[9] On July 22, 2008, the Cook County board voted against Cook County Commissioner's proposal to repeal the tax increase.[10]
In 2016, Cook County joined Chicago in adopting a $13 hourly minimum wage.[11] Cook County Board chairman John Daley called the wage hike "the moral and right thing to do." In June 2017, however, nearly 75 home rule municipalities passed measures opting themselves out of the increase.[12]
Politics
The county has more Democratic Party members than any other Illinois county and it is one of the most Democratic counties in the United States. Since 1932, the majority of its voters have only supported a Republican candidate in a Presidential election three times, all during national Republican landslides–Dwight Eisenhower over native son Adlai Stevenson II in 1952 and 1956, and Richard Nixon over George McGovern in 1972. Since then, the closest a Republican has come to carrying the county was in 1984, when Ronald Reagan won 48.4 percent of the county's vote.
The Cook County Democratic Party represents Democratic voters in 50 wards in the city of Chicago and 30 suburban townships of Cook County. The organization has dominated County, city, and state politics since the 1930s. The last Republican mayor of Chicago was William Hale "Big Bill" Thompson, who left office in 1931 with a record of corruption. The high-water mark for Republican candidacies for mayor since then was that of Republican candidate Bernard Epton, who in 1983 came within 3.3 percentage points of defeating Democrat Harold Washington.[13]
| Year | Republican | Democratic | Third party |
|---|---|---|---|
| 2016 | 453,287, 20.79% | 1,611,946, 73.93% | 115,111, 5.28% |
| 2012 | 495,542, 24.59% | 1,488,537, 73.88% | 30,740, 1.53% |
| 2008 | 487,736, 22.82% | 1,629,024, 76.21% | 20,706, 0.97% |
| 2004 | 29.2% 597,405 | 70.3% 1,439,724 | 0.6% 12,305 |
| 2000 | 28.7% 534,542 | 68.6% 1,280,547 | 2.7% 50,818 |
| 1996 | 26.7% 461,557 | 66.8% 1,153,289 | 6.5% 111,820 |
| 1992 | 28.2% 605,300 | 58.2% 1,249,533 | 13.6% 291,822 |
| 1988 | 43.4% 878,582 | 55.8% 1,129,973 | 0.9% 17,589 |
| 1984 | 48.4% 1,055,558 | 51.0% 1,112,641 | 0.6% 12,536 |
| 1980 | 39.6% 856,574 | 52.0% 1,124,584 | 8.4% 181,939 |
| 1976 | 44.7% 987,498 | 53.4% 1,180,814 | 1.9% 41,436 |
| 1972 | 53.4% 1,234,307 | 46.0% 1,063,268 | 0.6% 13,462 |
| 1968 | 41.1% 960,493 | 50.6% 1,181,316 | 8.3% 194,729 |
| 1964 | 36.8% 895,718 | 63.2% 1,537,181 | |
| 1960 | 43.3% 1,059,607 | 56.4% 1,378,343 | 0.3% 7,319 |
| 1956 | 56.8% 1,293,223 | 43.0% 977,821 | 0.3% 5,800 |
| 1952 | 50.2% 1,188,973 | 49.5% 1,172,454 | 0.3% 6,512 |
| 1948 | 45.2% 1,015,800 | 54.2% 1,216,636 | 0.6% 13,463 |
| 1944 | 41.9% 924,659 | 57.8% 1,275,367 | 0.3% 6,165 |
| 1940 | 44.4% 938,454 | 55.2% 1,168,141 | 0.4% 8,212 |
| 1936 | 34.9% 701,206 | 62.4% 1,253,164 | 2.7% 55,087 |
| 1932 | 41.5% 690,146 | 55.2% 919,231 | 3.3% 54,855 |
| 1928 | 52.7% 812,063 | 46.5% 716,283 | 0.8% 11,825 |
| 1924 | 61.9% 688,973 | 20.3% 226,141 | 17.8% 198,538 |
| 1920 | 71.1% 635,197 | 22.1% 197,499 | 6.8% 60,441 |
| 1916 | 51.2% 435,695 | 44.6% 379,438 | 4.2% 35,830 |
| 1912 | 17.4% 74,851 | 30.4% 130,702 | 52.2% 223,759 |
| 1908 | 55.5% 230,400 | 36.9% 152,990 | 7.6% 31,701 |
| 1904 | 58.5% 229,848 | 26.4% 103,762 | 15.1% 59,335 |
| 1900 | 50.8% 203,760 | 46.4% 186,193 | 2.8% 11,181 |
| 1896 | 58.4% 221,823 | 40.1% 152,146 | 1.5% 5,639 |
| 1892 | 42.6% 111,254 | 55.3% 144,604 | 2.1% 5,472 |
Secession movements
To establish more localized government control and policies which reflect the often different values and needs of large suburban sections of the sprawling county, several secession movements have been made over the years which called for certain townships or municipalities to form their own independent counties.
In the late 1970s, a movement started which proposed a separation of six northwest suburban townships, Cook County's panhandle (Barrington, Hanover, Palatine, Wheeling, Schaumburg, and Elk Grove) from Cook to form Lincoln County, in honor of the former U.S. president and Illinois resident.[15] It is likely that Arlington Heights would have been the county seat. This northwest suburban region of Cook was at the time moderately conservative and has a population over 500,000. Local legislators, led by State Senator Dave Regnar, went so far as to propose it as official legislation in the Illinois House. The legislation died, however, before coming to a vote.
In 2004, Blue Island Mayor Donald E. Peloquin organized a coalition of fifty-five south and southwest suburban municipalities to form a new county, also proposing the name Lincoln County. The county would include everything south of Burbank, stretching as far west as Orland Park, as far east as Calumet City, and as far south as Matteson, covering an expansive area with a population of over one million residents. Peloquin argued that the south suburbs are often shunned by the city (although Chicago is not bound or required to do anything for other municipalities) and he blamed the Chicago-centric policies of Cook County for failing to jumpstart the somewhat-depressed south suburban local economy. Pending sufficient interest from local communities, Peloquin planned a petition drive to place a question regarding the secession on the general election ballot, but the idea was not met with success.[16]
Talk of secession from Cook County amongst some outlying communities again heated up in mid-2008 in response to a highly controversial 1% sales tax hike which has pushed the tax rates across the county communities up amongst the highest in the nation. Some border towns in particular had been outraged, as people can take their business across the county border (paying, for instance, 7% in Lake County instead of Palatine's 9.5%).[17] The secession issue eventually died down from the nominal tax increase.
In 2011, two downstate Republican state representatives, Bill Mitchell of the 87th district and Adam Brown of the 101st district, proposed statehood for Cook County. Mitchell said that Chicago is "dictating its views" to the rest of the state and Brown added that Chicago "overshadows" the rest of Illinois.[18]
Geography
| Chicago, Illinois | ||||||||||||||||||||||||||||||||||||||||||||||||||||||||||||
|---|---|---|---|---|---|---|---|---|---|---|---|---|---|---|---|---|---|---|---|---|---|---|---|---|---|---|---|---|---|---|---|---|---|---|---|---|---|---|---|---|---|---|---|---|---|---|---|---|---|---|---|---|---|---|---|---|---|---|---|---|
| Climate chart (explanation) | ||||||||||||||||||||||||||||||||||||||||||||||||||||||||||||
| ||||||||||||||||||||||||||||||||||||||||||||||||||||||||||||
| ||||||||||||||||||||||||||||||||||||||||||||||||||||||||||||
According to the U.S. Census Bureau, the county has a total area of 1,635 square miles (4,230 km2), of which 945 square miles (2,450 km2) is land and 690 square miles (1,800 km2) (42.2%) is water.[20] It is the sixth largest county in Illinois by land area, and the largest in total area. Most of the water is in Lake Michigan. The highest point is more than 950 feet (290 m),[1][2] and is in northwest Barrington Township, in the northwest corner of the county. The lowest point is less than 580 feet (180 m),[1][3] along the Lake Michigan shoreline.
Climate and weather
In July, temperatures in Chicago, Cook County average daytime highs of 84 °F (29 °C), and nighttime lows of 68 °F (20 °C); and January daytime highs of 31 °F (−1 °C), and nighttime lows of 18 °F (−8 °C). Winter temperatures will sometimes veer above 40 °F (4 °C), and, although not common, have also risen over 50 °F (10 °C) on some winter days. Average monthly precipitation ranged from 4.30 inches (109 mm) in June to 1.77 inches (45 mm) in February.[19]
Major highways


.svg.png)


Adjacent counties
- McHenry County, Illinois – northwest
- Lake County, Illinois – north
- Berrien County, Michigan – east
- Lake County, Indiana – southeast
- Will County, Illinois – south
- DuPage County, Illinois – west
- Kane County, Illinois – west
Cook County is among the few counties in the United States to border two counties with the same name (Lake County, Illinois and Lake County, Indiana). Illinois has two such counties (Randolph County borders both Perry County, Illinois and Perry County, Missouri).
National protected areas
- Chicago Portage National Historic Site
- Pullman National Monument
Demographics
| Historical population | |||
|---|---|---|---|
| Census | Pop. | %± | |
| 1840 | 10,201 | — | |
| 1850 | 43,385 | 325.3% | |
| 1860 | 144,954 | 234.1% | |
| 1870 | 349,966 | 141.4% | |
| 1880 | 607,524 | 73.6% | |
| 1890 | 1,191,922 | 96.2% | |
| 1900 | 1,838,735 | 54.3% | |
| 1910 | 2,405,233 | 30.8% | |
| 1920 | 3,053,017 | 26.9% | |
| 1930 | 3,982,123 | 30.4% | |
| 1940 | 4,063,342 | 2.0% | |
| 1950 | 4,508,792 | 11.0% | |
| 1960 | 5,129,725 | 13.8% | |
| 1970 | 5,492,369 | 7.1% | |
| 1980 | 5,253,655 | −4.3% | |
| 1990 | 5,105,067 | −2.8% | |
| 2000 | 5,376,741 | 5.3% | |
| 2010 | 5,194,675 | −3.4% | |
| Est. 2019 | 5,150,233 | [21] | −0.9% |
| U.S. Decennial Census[22] 1790–1960[23] 1900–1990[24] 1990–2000[25] 2010–2019[26] | |||
As of the 2010 Census, the population of the county was 5,194,675, White Americans made up 55.4% of Cook County's population; non-Hispanic whites represented 43.9% of the population. African Americans made up 24.8% of the population. Native Americans made up 0.4% of Cook County's population. Asian Americans made up 6.2% of the population (1.8% Indian, 1.2% Filipino, 1.2% Chinese, 0.7% Korean, 0.3% Vietnamese, 0.2% Japanese, 0.8% Other). Pacific Islander Americans made up less than 0.1% of the population. People from other races made up 10.6% of the population; people from two or more races made up 2.5% of the county's population. Hispanics and Latinos (of any race) made up 24.0% of Cook County's population.
As of the 2000 Census,[27] there were 5,376,741 people, 1,974,181 households, and 1,269,398 families residing in the county. The population density was 5,686 people per square mile (2,195/km²). There were 2,096,121 housing units at an average density of 2,216 per square mile (856/km²). The racial makeup of the county was 56.27% white, 26.14% Black or African American, 0.29% Native American, 4.84% Asian, 0.05% Pacific Islanders, 9.88% from other races, and 2.53% from two or more races. 19.93% of the population were Hispanic or Latino of any race. 9.1% were of Polish, 8.1% German, 7.9% Irish and 5.7% Italian ancestry. 17.63% reported speaking Spanish at home; 3.13% speak Polish.[28]
Whites (Hispanic and non-Hispanic) number roughly 2,793,500. There are about 2,372,500 non-Hispanic whites residing in Cook County. Sizeable non-Hispanic white populations are those of German (11.4%), Irish (10.3%), Polish (9.7%), Italian (6.1%), and British (4.1%) descent. There are also significant groups of Swedish (1.5%), Russian (1.5%), French (1.3%), Greek (1.2%), Czech (1.0%), Dutch (1.0%), Lithuanian (0.9%), and Norwegian (0.8%) descent.
Black Americans are the second largest racial group. Black Americans form over one-quarter (25.4%) of Cook County's population. Blacks of non-Hispanic origin form 25.2% of the population; black Hispanics make up the remaining 0.2% of the populace. There are roughly 1,341,000 African Americans of both Hispanic and non-Hispanic origin living in Cook County; 1,328,000 are non-Hispanic blacks. Roughly 52,500 people were of Sub-Saharan African ancestry, making up 1.0% of the total population.
The Native American population is sizeable but small proportionally. Over 10,200 residents of Cook County are of Native American ancestry, equivalent to just 0.2% of the total population. There are 974 Cherokee, 612 Chippewa, 430 Navajo, and 96 Sioux living in Cook County. Native Americans of Hispanic origin represent much of the Native American population group. Some 5,900 Native Americans are of non-Hispanic origin, so some 4,300 are of Hispanic origin. Over 40% of the Native American racial group is of Hispanic descent.
.svg.png)
Asian Americans are a sizeable racial group in the county, numbering over 300,800. The Asian population is ethnically diverse, and includes roughly 87,900 Indians, 61,700 Filipinos, 60,700 Chinese, 35,000 Koreans, 13,700 Vietnamese, and 11,100 Japanese. Roughly 30,800 are of other Asian ethnic groups, such as Thai, Cambodian, and Hmong. Indian Americans make up 1.7% of the population, while Chinese and Filipino Americans make up 1.2% of the population each.
Pacific Islander Americans form the smallest racial group in Cook County. Just over 3,000 are of Pacific Islander heritage. This group includes roughly 780 Native Hawaiians, 670 Guamanians, 120 Samoans, and 1,400 people of other Pacific Islander groups.
Hispanic and Latino Americans make up over one-fifth (22.8%) of Cook County's population. Roughly 1,204,000 Hispanics live in the county. Mexicans are, by far, the most common Hispanic group. Cook County's 925,000 Mexican Americans make up 17.5% of its population. Roughly 127,000 Puerto Ricans make up 2.4% of the population. About 12,200 Cubans form 0.2% of the total population. There are some 140,000 Hispanics and Latinos of other nationalities living in Cook County (i.e. Colombian, Bolivian, etc., and they collectively make up 2.6% of the county's population.[29][30]
According to the 2000 Census there were 1,974,181 households out of which 30.9% had children under the age of 18 living with them, 44.0% were married couples living together, 15.6% had a female householder with no husband present, and 35.7% were non-families. 29.4% of all households were someone living alone including 9.3% who were 65 years of age or older. The average household size was 2.68 and the average family size was 3.38.
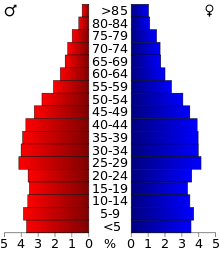
In the county, the population age distribution was: 26.0% under the age of 18, 9.9% from 18 to 24, 31.7% from 25 to 44, 20.7% from 45 to 64, and 11.7% who were 65 years of age or older. The median age was 34 years. For every 100 females, there were 93.9 males. For every 100 females age 18 and over, there were 90.5 males.
The median income for a household in the county was $45,922, and the median income for a family was $53,784. Males had a median income of $40,690 versus $31,298 for females. The per capita income for the county was $23,227. About 10.6% of families and 13.5% of the population were below the poverty line, including 18.9% of those under age 18 and 10.3% of those age 65 or over.
According to Census Bureau estimates, the county's population was down to 5,211,263 in 2017, decreased further by 2010 (5,194,675) and had grown slightly by 2017 (5,211,263).
Religious statistics
In 2010 statistics, the largest religious group in Cook County was the Archdiocese of Chicago, with 1,947,223 Catholics worshipping at 371 parishes, followed by 209,195 non-denominational adherents with 486 congregations, an estimated 201,152 Muslims with 62 congregations, 68,865 NBC Baptists with 99 congregations, 49,925 ELCA Lutherans with 145 congregations, 49,909 SBC Baptists with 181 congregations, 45,979 LCMS Lutherans with 120 congregations, 39,866 UCC Christians with 101 congregations, 33,584 UMC Methodists with 121 congregations, and 32,646 AG Pentecostals with 64 congregations. Altogether, 59.6% of the population was claimed as members by religious congregations, although members of historically African-American denominations were underrepresented due to incomplete information.[31] In 2014, Cook County had 2,001 religious organizations, second only to Los Angeles County out of all US counties.[32]
Communities
| Rank | County | Pop. | |||||||
|---|---|---|---|---|---|---|---|---|---|
.jpg) Chicago |
1 | Chicago | Cook | 2,705,994 | |||||
| 2 | Elgin | Cook / Kane | 111,683 | ||||||
| 3 | Cicero | Cook | 81,597 | ||||||
| 4 | Arlington Heights | Cook | 75,249 | ||||||
| 5 | Evanston | Cook | 73,509 | ||||||
| 6 | Schaumburg | Cook / Dupage | 71,290 | ||||||
| 7 | Palatine | Cook | 68,053 | ||||||
| 8 | Skokie | Cook | 63,280 | ||||||
| 9 | Des Plaines | Cook | 58,959 | ||||||
| 10 | Orland Park | Cook | 58,312 | ||||||
Cities
- Berwyn
- Blue Island
- Burbank
- Calumet City
- Chicago (county seat and largest municipality)
- Chicago Heights
- Country Club Hills
- Countryside
- Des Plaines
- Elgin (part)
- Evanston
- Harvey
- Hickory Hills
- Hometown
- Markham
- Northlake
- Oak Forest
- Orland Park
- Palos Heights
- Palos Hills
- Palos Park
- Park Ridge
- Prospect Heights
- Rolling Meadows
Towns
- Cicero
Villages
- Alsip
- Arlington Heights
- Barrington (partly in Lake County)
- Barrington Hills (mostly)
- Bartlett (mostly in DuPage County)
- Bedford Park
- Bellwood
- Bensenville (mostly in DuPage County)
- Berkeley
- Bridgeview
- Broadview
- Brookfield
- Buffalo Grove (mostly in Lake County)
- Burnham
- Burr Ridge (mostly in DuPage County)
- Calumet Park
- Chicago Ridge
- Crestwood
- Deer Park (mostly in Lake County)
- Deerfield (mostly in Lake County)
- Dixmoor
- Dolton
- East Dundee (mostly in Kane County)
- East Hazel Crest
- Elk Grove Village (partly in DuPage County)
- Elmwood Park
- Evergreen Park
- Flossmoor
- Ford Heights
- Forest Park
- Forest View
- Franklin Park
- Glencoe
- Glenview
- Glenwood
- Golf
- Hanover Park (mostly in DuPage County)
- Harwood Heights
- Hazel Crest
- Hillside
- Hinsdale (mostly in DuPage County)
- Hodgkins
- Hoffman Estates (partly in Kane County)
- Homewood
- Indian Head Park
- Inverness
- Justice
- Kenilworth
- La Grange
- La Grange Park
- Lansing
- Lemont (partly in Will County)
- Lincolnwood
- Lynwood
- Lyons
- Matteson
- Maywood
- McCook
- Melrose Park
- Merrionette Park
- Midlothian
- Morton Grove
- Mount Prospect
- Niles
- Norridge
- North Riverside
- Northbrook
- Northfield
- Oak Forest
- Oak Lawn
- Oak Park
- Olympia Fields
- Orland Hills
- Orland Park (partly in Will County)
- Palatine
- Palos Park
- Park Forest (partly in Will County)
- Phoenix
- Posen
- Richton Park
- River Forest
- River Grove
- Riverdale
- Riverside
- Robbins
- Roselle (mostly in DuPage County)
- Rosemont
- Sauk Village (partly in Will County)
- Schaumburg (partly in DuPage County)
- Schiller Park
- Skokie
- South Barrington
- South Chicago Heights
- South Holland
- Steger (partly in Will County)
- Stickney
- Stone Park
- Streamwood
- Summit
- Thornton
- Tinley Park (partly in Will County)
- University Park (mostly in Will County)
- Westchester
- Western Springs
- Wheeling
- Willow Springs
- Wilmette
- Winnetka
- Worth
Unincorporated communities
- Central Stickney
- Hines
- La Grange Highlands
- Nottingham Park
- Sag Bridge
- Sutton
Townships
The county is divided into 29 townships, in addition to the cities of Chicago and Evanston.
Current townships
The 29 townships of Cook County, with their populations as of the 2010 Census, are:[34]
- Thornton Township – 169,326
- Wheeling Township – 153,630
- Worth Township – 152,633
- Proviso Township – 151,704
- Maine Township – 135,772
- Schaumburg Township – 131,288
- Palatine Township – 112,994
- Lyons Township – 111,688
- Bremen Township – 110,118
- Niles Township – 105,882
- Hanover Township – 99,538
- Orland Township – 97,558
- Elk Grove Township – 92,905
- Leyden Township – 92,890
- Bloom Township – 90,922
- Northfield Township – 85,102
- Cicero Township – 83,891
- Rich Township – 76,727
- Berwyn Township – 56,657
- New Trier Township – 55,424
- Palos Township – 54,615
- Oak Park Township – 51,878
- Stickney Township – 40,772
- Norwood Park Township – 26,385
- Lemont Township – 21,113
- Calumet Township – 20,777
- Barrington Township – 15,636
- Riverside Township – 15,594
- River Forest Township – 11,172
Former townships
Chicago's eight former townships and annexed parts of others no longer have any governmental structure or responsibility since their annexations, but their names and boundaries are still used on property plats and by Cook County for tax assessment purposes.
In 2014, Evanston Township was dissolved by voters and its functions were absorbed by the city of Evanston.[35]
- Evanston Township
- Jefferson Township
- Hyde Park Township
- Lake Township
- Lake View Township
- North Township
- Rogers Park Township
- South Township
- West Township
See also
- Chicago metropolitan area
- Cook County Forest Preserve District
- Metropolitan Water Reclamation District of Greater Chicago
- National Register of Historic Places listings in Cook County, Illinois
References
- "Lowest and Highest Points in Cook County". Illinois State Geological Survey. Retrieved November 30, 2016.
Greater than 950 ft max and Less than 580 ft min
- Streamwood Quadrangle – Illinois – Cook Co (Map). 1:24,000. 7.5-Minute Series (Topographic). United States Geological Survey. 2013.
- Chicago Loop Quadrangle – Illinois – Cook Co (Map). 1:24,000. 7.5-Minute Series (Topographic). United States Geological Survey. 2013.
- U.S. Census Bureau. American Community Survey, Profile of General Population and Housing Characteristics 2010, Table DP-1, 2010 Demographic Profile Data. U.S. Census website . Retrieved June 22, 2014.
- "County Population Estimates". Retrieved April 4, 2014.
- Gove, Samuel Kimball (1996). Illinois Politics and Government: The Expanding Metropolitan Frontier. Politics and Governments of the American States. University of Nebraska Press. p. 156. ISBN 0-8032-7014-3. LCCN 95046017. Retrieved April 4, 2014.CS1 maint: ref=harv (link)
- "Circuit Court of Cook County an Informational Guide" (PDF). 2008. Archived from the original (PDF) on March 1, 2007. Retrieved December 16, 2008.
- "All the extra cost will be no small change". Chicago Tribune. 2008. Retrieved March 2, 2008.
- "Chicago's Largest Employers". ChicagoBusiness.
- "Cook County Board 'rejects' sales tax increase repeal". Chicago Tribune. July 22, 2008. Retrieved July 23, 2008.
- Elejalde-Ruiz, Alexia. "Cook County approves $13 hourly minimum wage affecting suburbs". Chicago Tribune. Retrieved December 6, 2016.
- Slowik, Ted (June 28, 2017). "Slowik: Towns are right to opt out of Cook County minimum wage law". Daily Southtown. Retrieved June 30, 2017.
- "Bernard E. Epton Is Dead at 66; Ran for Mayor of Chicago in '83". The New York Times. December 14, 1987. Retrieved February 11, 2014.
- Leip, David. "Dave Leip's Atlas of U.S. Presidential Elections". uselectionatlas.org.
- Cleveland, Charles (September 1977). "Carving another county out of Cook". Illinois Issues. Archived from the original on September 8, 2006.
- "Blue Island mayor wants to create "Lincoln County"". WLS-TV News (abc7chicago.com). June 25, 2004. Archived from the original on June 29, 2011.
- PinPoint Sales Tax Lookup Archived May 6, 2015, at the Wayback Machine. Zip2tax.com. Retrieved on 2013-07-21.
- "2 GOP legislators propose separating Cook County from Illinois". SJ-R.com. November 22, 2011. Cf. Winston County, Alabama.
- "Monthly Averages for Chicago, Illinois". The Weather Channel. Retrieved January 27, 2011.
- "Population, Housing Units, Area, and Density: 2010 – County". United States Census Bureau. Archived from the original on February 13, 2020. Retrieved July 11, 2015.
- "Population and Housing Unit Estimates". Retrieved March 26, 2020.
- "U.S. Decennial Census". United States Census Bureau. Retrieved July 4, 2014.
- "Historical Census Browser". University of Virginia Library. Retrieved July 4, 2014.
- "Population of Counties by Decennial Census: 1900 to 1990". United States Census Bureau. Retrieved July 4, 2014.
- "Census 2000 PHC-T-4. Ranking Tables for Counties: 1990 and 2000" (PDF). United States Census Bureau. Retrieved July 4, 2014.
- "State & County QuickFacts". United States Census Bureau. Retrieved January 20, 2016.
- "U.S. Census website". United States Census Bureau. Retrieved 2008-01-31.
- "Language Map Data Center". www.mla.org.
- American FactFinder Archived February 10, 2020, at Archive.today
- American FactFinder Archived February 10, 2020, at Archive.today
- "County Membership Report Cook County (Illinois)". The Association of Religion Data Archives. 2010. Retrieved December 31, 2019.
- "Social Capital Variables Spreadsheet for 2014". PennState College of Agricultural Sciences, Northeast Regional Center for Rural Development. December 8, 2017. Retrieved December 30, 2019.
- "U.S. Census Bureau QuickFacts". 2018 Populations.
- "accessed May 17, 2011". Factfinder2.census.gov. October 5, 2010. Retrieved April 4, 2014.
- Matthew Dietrich (September 19, 2014). "Evanston Township ceases to exist". Huffington Post. Retrieved November 17, 2016.
External links
| Wikimedia Commons has media related to Cook County, Illinois. |
- Cook County Government Website
- Cook County Assessor
- Cook County Board of Review
- Circuit Court of Cook County
- Clerk of the Circuit Court of Cook County
- Clerk of Cook County
- Vote! from the Cook County Election Department
- Cook County Recorder of Deeds
- Cook County Sheriff
- Cook County Jail
- Cook County State's Attorney
- Cook County Treasurer
- Forest Preserve District of Cook County
- Cook County History Pages
Places adjacent to Cook County, Illinois | ||||||||||
|---|---|---|---|---|---|---|---|---|---|---|
| ||||||||||
Municipalities and communities of Cook County, Illinois, United States | ||
|---|---|---|
| Cities |
| Map of Illinois highlighting Cook County |
| Town |
| |
| Villages |
| |
| Townships |
Former:
| |
| Unincorporated communities |
| |
| Footnotes | ‡This populated place also has portions in an adjacent county or counties | |
Chicago metropolitan area | ||
|---|---|---|
| Major city |  | |
| Cities (over 30,000 in 2010) |
| |
| Towns and villages (over 30,000 in 2010) |
| |
| Counties |
| |
| Regions |
| |
| Sub-regions |
| |
Springfield (capital) | ||
| Topics |
|  Seal of Illinois |
| Regions |
| |
| Municipalities |
| |
| Counties |
| |
| Authority control |
|---|