Carbon footprint
A carbon footprint is historically defined as the total greenhouse gas (GHG) emissions caused by an individual, event, organization, or product, expressed as carbon dioxide equivalent.[1] Greenhouse gases, including the carbon-containing gases carbon dioxide and methane, can be emitted through the burning of fossil fuels, land clearance and the production and consumption of food, manufactured goods, materials, wood, roads, buildings, transportation and other services.[2]

| Part of a series about |
| Environmental economics |
|---|
| Concepts |
|
| Policies |
|
| Dynamics |
|
| Carbon related |
|
In most cases, the total carbon footprint cannot be calculated exactly because of inadequate knowledge of and data about the complex interactions between contributing processes, including the influence of natural processes that store or release carbon dioxide. For this reason, Wright, Kemp, and Williams proposed the following definition of a carbon footprint:
A measure of the total amount of carbon dioxide (CO2) and methane (CH4) emissions of a defined population, system or activity, considering all relevant sources, sinks and storage within the spatial and temporal boundary of the population, system or activity of interest. Calculated as carbon dioxide equivalent using the relevant 100-year global warming potential (GWP100).[3]
Most of the carbon footprint emissions for the average U.S. household come from "indirect" sources, e.g. fuel burned to produce goods far away from the final consumer[4]. These are distinguished from emissions which come from burning fuel directly in one's car or stove, commonly referred to as "direct" sources of the consumer's carbon footprint.[5]
Measuring carbon footprints
An individual's, nation's, or organization's carbon footprint can be measured by undertaking a GHG emissions assessment, a life cycle assessment, or other calculative activities denoted as carbon accounting. Once the size of a carbon footprint is known, a strategy can be devised to reduce it, e.g. by technological developments, energy efficiency improvements, better process and product management, changed Green Public or Private Procurement (GPP), carbon capture, consumption strategies, carbon offsetting and others[6].
For calculating personal carbon footprints, several free online carbon footprint calculators exist[7][8] including a few supported by publicly available peer-reviewed data and calculations including the University of California, Berkeley's CoolClimate Network research consortium and CarbonStory.[9][10][11] These websites ask you to answer more or less detailed questions about your diet, transportation choices, home size, shopping and recreational activities, usage of electricity, heating, and heavy appliances such as dryers and refrigerators, and so on. The website then estimates your carbon footprint based on your answers to these questions. A systematic literature review was conducted to objectively determine the best way to calculate individual/household carbon footprints. This review identified 13 calculation principles and subsequently used the same principles to evaluate the 15 most popular online carbon footprint calculators. A recent study's results by Carnegie Mellon's Christopher Weber found that the calculation of carbon footprints for products is often filled with large uncertainties. The variables of owning electronic goods such as the production, shipment, and previous technology used to make that product, can make it difficult to create an accurate carbon footprint. It is important to question, and address the accuracy of Carbon Footprint techniques, especially due to its overwhelming popularity.[12]
Calculating the carbon footprint of industry, product, or service is a complex task. One tool industry uses Life-cycle assessment (LCA), where carbon footprint may be one of many factors taken into consideration when assessing a product or service. The International Organization for Standardization has a standard called ISO 14040:2006 that has the framework for conducting an LCA study.[13] ISO 14060 family of standards provides further sophisticated tools for quantifying, monitoring, reporting and validating or verifying of GHG emissions and removals.[14] Another method is through the Greenhouse Gas Protocol, a set of standards for tracking GHG emissions.
Predicting the carbon footprint of a process is also possible through estimations using the above standards. By using Emission intensities/Carbon intensities and the estimated annual use of fuel, chemical, or other inputs, the carbon footprint can be determined while a process is being planned/designed.
Origin of the concept
The concept and name of the carbon footprint derive from the ecological footprint concept,[15] which was developed by William E. Rees and Mathis Wackernagel in the 1990s. While carbon footprints are usually reported in tons of emissions (CO2-equivalent) per year, ecological footprints are usually reported in comparison to what the planet can renew. This assesses the number of "earths" that would be required if everyone on the planet consumed resources at the same level as the person calculating their ecological footprint. The carbon footprint is one part of the ecological footprint. The carbon part was popularized by a large campaign of BP in 2005.[15] Carbon footprints are more focused than ecological footprints since they measure merely emissions of gases that cause climate change into the atmosphere.
Carbon footprint is one of a family of footprint indicators, which also include water footprint and land footprint.
Direct carbon emissions
Direct carbon emissions come from sources that are directly from the site that is producing a product.[16] These emissions can also be referred to as scope 1 and scope 2 emissions.
Scope 1 emissions are emissions that are directly emitted from the site of the process or service.[17] An example for industry would be the emissions related to burning a fuel on site. On the individual level, emissions from personal vehicles or gas burning stoves would fall under scope 1.
Scope 2 emissions are the other emissions related to purchased electricity, heat, and/or steam used on site.[17] In the US, the EPA has broken down electricity emission factors by state.[18]
In the UK, defra provides emission factors going back to 2002 covering scope 1, 2 and 3.[19]
Defra no longer provide international emission factors and refer visitors to the IEA who provide free highlights and paid for details covering Scope 1 and 2.[20]
Indirect carbon emissions
Indirect carbon emissions are emissions from sources upstream or downstream from the process being studied, also known as scope 3 emissions.[16]
Examples of upstream, indirect carbon emissions may include:[21]
- Transportation of materials/fuels
- Any energy used outside of the production facility
- Wastes produced outside of the production facility
Examples of downstream, indirect carbon emissions may include:[21]
- Any end-of-life process or treatments
- Product and waste transportation
- Emissions associated with selling the product
Ways to reduce personal carbon footprint

A July 2017 study published in Environmental Research Letters found that the most significant way individuals could mitigate their own carbon footprint is to have one less child ("an average for developed countries of 58.6 tonnes CO2-equivalent (tCO2e) emission reductions per year"), followed by living car-free (2.4 tonnes CO2-equivalent per year), forgoing air travel (1.6 tonnes CO2-equivalent per trans-Atlantic trip) and adopting a plant-based diet (0.8 tonnes CO2-equivalent per year).[22][23] The study also found that most government resources on climate change focus on actions that have a relatively modest effect on greenhouse gas emissions, and concludes that "a US family who chooses to have one fewer child would provide the same level of emissions reductions as 684 teenagers who choose to adopt comprehensive recycling for the rest of their lives".[23]
Another option is to drive less. Walking, biking, carpooling, mass transportation and combining trips result in burning less fuel and releasing fewer emissions into the atmosphere.
The choice of diet is a major influence on a person's carbon footprint. Animal sources of protein (especially red meat), rice (typically produced in high methane-emitting paddies), foods transported long-distance or via fuel-inefficient transport (e.g., highly perishable produce flown long-distance) and heavily processed and packaged foods are among the major contributors to a high carbon diet. Scientists at the University of Chicago have estimated[24] "that the average American diet – which derives 28% of its calories from animal foods – is responsible for approximately one and a half more tonnes of greenhouse gasses – as CO
2 equivalents – per person, per year than a fully plant-based, or vegan, diet."[25] Their calculations suggest that even replacing one third of the animal protein in the average American's diet with plant protein (e.g., beans, grains) can reduce the diet's carbon footprint by half a tonne. Exchanging two-thirds of the animal protein with plant protein is roughly equivalent to switching from a Toyota Camry to a Prius. Finally, throwing food out not only adds its associated carbon emissions to a person or household's footprint, but it also adds the emissions of transporting the wasted food to the garbage dump and the emissions of food decomposition, mostly in the form of the highly potent greenhouse gas, methane.
Options to reduce the carbon footprint of humans include Reduce, Reuse, Recycle, Refuse. This can be done by using reusable items such as thermoses for daily coffee or plastic containers for water and other cold beverages rather than disposable ones. If that option isn't available, it is best to properly recycle the disposable items after use.[26] When one household recycles at least half of their household waste, they can save 1.2 tons of carbon dioxide annually.
Another option for reducing the carbon footprint of humans is to use less air conditioning and heating in the home. By adding insulation to the walls and attic of one's home, and installing weather stripping, or caulking around doors and windows one can lower their heating costs more than 25 percent. Similarly, one can very inexpensively upgrade the "insulation" (clothing) worn by residents of the home.[27] For example, it's estimated that wearing a base layer of long underwear with top and bottom, made from a lightweight, super-insulating fabric like microfleece, can conserve as much body heat as a full set of clothing, allowing a person to remain warm with the thermostat lowered by over 5 °C.[27][28] These measures all help because they reduce the amount of energy needed to heat and cool the house. One can also turn down the heat while sleeping at night or away during the day, and keep temperatures moderate at all times. Setting the thermostat just 2 degrees lower in winter and higher in summer could save about 1 ton of carbon dioxide each year.[26]
The carbon handprint movement emphasizes individual forms of carbon offsetting, like using more public transportation or planting trees in deforested regions, to reduce one's carbon footprint and increase their "handprint."[29][30] The Handprint is being used around the world to strengthen action towards the fulfillment of the UN Sustainable Development Goals.
Ways to reduce industry's carbon footprint
The most powerful industrial climate actions are:[31] refrigerant management (90 billion tonnes of CO2e 2017–2050,[32] since refrigerants have thousands of times the warming potential of CO2); land-based wind turbines for electricity (85 billion); reduced food waste (71 billion); and restoring tropical forests by ending use of the land for other purposes (61 billion). They calculate benefits cumulatively to 2050, rather than annually, because industrial actions have long lead times[33].
A product, service, or company's carbon footprint can be affected by several factors including, but not limited to:
- Energy sources
- Offsite electricity generation
- Materials
These factors can also change with location or industry. However, there are some general steps that can be taken to reduce carbon footprint on a larger scale.
In 2016, the EIA reported that in the US electricity is responsible for roughly 37% of Carbon Dioxide emissions, making it a potential target for reductions.[34] Possibly the cheapest way to do this is through energy efficiency improvements. The ACEEE reported that energy efficiency has the potential to save the US over 800 billion kWh per year, based on 2015 data.[35] Some potential options to increase energy efficiency include, but are not limited to:[36]
- Waste heat recovery systems
- Insulation for large buildings and combustion chambers
- Technology upgrades, ie different light sources, lower consumption machines
Carbon Footprints from energy consumption can be reduced through the development of alternative energy projects, such as solar and wind energy, which are renewable resources.
Reforestation, the restocking of existing forests or woodlands that have previously been depleted, is an example of Carbon Offsetting, the counteracting of carbon dioxide emissions with an equivalent reduction of carbon dioxide in the atmosphere.[37] Carbon offsetting can reduce a companies overall carbon footprint by offering a carbon credit.
A life cycle or supply chain carbon footprint study can provide useful data which will help the business to identify specific and critical areas for improvement. By calculating or predicting a process’ carbon footprint high emissions areas can be identified and steps can be taken to reduce in those areas.
Schemes to reduce carbon emissions: Kyoto Protocol, carbon offsetting, and certificates
Carbon dioxide emissions into the atmosphere, and the emissions of other GHGs, are often associated with the burning of fossil fuels, like natural gas, crude oil and coal. While this is harmful to the environment, carbon offsets can be purchased in an attempt to make up for these harmful effects.
The Kyoto Protocol defines legally binding targets and timetables for cutting the GHG emissions of industrialized countries that ratified the Kyoto Protocol. Accordingly, from an economic or market perspective, one has to distinguish between a mandatory market and a voluntary market. Typical for both markets is the trade with emission certificates:
- Certified Emission Reduction (CER)
- Emission Reduction Unit (ERU)
- Verified Emission Reduction (VER)
Mandatory market mechanisms
To reach the goals defined in the Kyoto Protocol, with the least economical costs, the following flexible mechanisms were introduced for the mandatory market:
- Clean Development Mechanism (CDM)
- Joint Implementation (JI)
- Emissions trading
The CDM and JI mechanisms requirements for projects which create a supply of emission reduction instruments, while Emissions Trading allows those instruments to be sold on international markets.
- Projects which are compliant with the requirements of the CDM mechanism generate Certified Emissions Reductions (CERs).
- Projects which are compliant with the requirements of the JI mechanism generate Emission Reduction Units (ERUs).
The CERs and ERUs can then be sold through Emissions Trading. The demand for the CERs and ERUs being traded is driven by:
- Shortfalls in national emission reduction obligations under the Kyoto Protocol.
- Shortfalls amongst entities obligated under local emissions reduction schemes.
Nations which have failed to deliver their Kyoto emissions reductions obligations can enter Emissions Trading to purchase CERs and ERUs to cover their treaty shortfalls. Nations and groups of nations can also create local emission reduction schemes which place mandatory carbon dioxide emission targets on entities within their national boundaries. If the rules of a scheme allow, the obligated entities may be able to cover all or some of any reduction shortfalls by purchasing CERs and ERUs through Emissions Trading. While local emissions reduction schemes have no status under the Kyoto Protocol itself, they play a prominent role in creating the demand for CERs and ERUs, stimulating Emissions Trading and setting a market price for emissions.
A well-known mandatory local emissions trading scheme is the EU Emissions Trading Scheme (EU ETS).
New changes are being made to the trading schemes. The EU Emissions Trading Scheme is set to make some new changes within the next year. The new changes will target the emissions produced by flight travel in and out of the European Union.[38]
Other nations are scheduled to start participating in Emissions Trading Schemes within the next few years. These nations include China, India and the United States.[38]
Voluntary market mechanisms
In contrast to the strict rules set out for the mandatory market, the voluntary market provides companies with different options to acquire emissions reductions. A solution, comparable with those developed for the mandatory market, has been developed for the voluntary market, the Verified Emission Reductions (VER). This measure has the great advantage that the projects/activities are managed according to the quality standards set out for CDM/JI projects but the certificates provided are not registered by the governments of the host countries or the Executive Board of the UNO. As such, high quality VERs can be acquired at lower costs for the same project quality. However, at present VERs can not be used in mandatory market.
The voluntary market in North America is divided between members of the Chicago Climate Exchange and the Over The Counter (OTC) market. The Chicago Climate Exchange is a voluntary yet legally binding cap-and-trade emission scheme whereby members commit to the capped emission reductions and must purchase allowances from other members or offset excess emissions. The OTC market does not involve a legally binding scheme and a wide array of buyers from the public and private spheres, as well as special events that want to go carbon neutral. Being carbon neutral refers to achieving net zero carbon emissions by balancing a measured amount of carbon released with an equivalent amount sequestered or offset, or buying enough carbon credits to make up the difference.
There are project developers, wholesalers, brokers, and retailers, as well as carbon funds, in the voluntary market. Some businesses and nonprofits in the voluntary market encompass more than just one of the activities listed above. A report by Ecosystem Marketplace shows that carbon offset prices increase as it moves along the supply chain—from project developer to retailer.[39]
While some mandatory emission reduction schemes exclude forest projects, these projects flourish in the voluntary markets. A major criticism concerns the imprecise nature of GHG sequestration quantification methodologies for forestry projects. However, others note the community co-benefits that forestry projects foster. Project types in the voluntary market range from avoided deforestation, afforestation/reforestation, industrial gas sequestration, increased energy efficiency, fuel switching, methane capture from coal plants and livestock, and even renewable energy. Renewable Energy Certificates (RECs) sold on the voluntary market are quite controversial due to additionality concerns.[40] Industrial Gas projects receive criticism because such projects only apply to large industrial plants that already have high fixed costs. Siphoning off industrial gas for sequestration is considered picking the low hanging fruit; which is why credits generated from industrial gas projects are the cheapest in the voluntary market.
The size and activity of the voluntary carbon market are difficult to measure. The most comprehensive report on the voluntary carbon markets to date was released by Ecosystem Marketplace and New Carbon Finance in July 2007.[39]
ÆON of Japan is firstly approved by the Japanese authority to indicate a carbon footprint on three private brand goods in October 2009.
Average carbon footprint per person by country
.svg.png)
According to The World Bank, the global average carbon footprint in 2014 was 4.97 metric tons CO2/cap.[41] The EU average for 2007 was about 13.8 tons CO2e/cap, whereas for the U.S., Luxembourg and Australia it was over 25 tons CO2e/cap. In 2017, the average for the USA was about 20 metric tons CO2e.[lower-alpha 1]
Mobility (driving, flying & small amount from public transit), shelter (electricity, heating, construction) and food are the most important consumption categories determining the carbon footprint of a person. In the EU, the carbon footprint of mobility is evenly split between direct emissions (e.g. from driving private cars) and emissions embodied in purchased products related to mobility (air transport service, emissions occurring during the production of cars and during the extraction of fuel).[44]
The carbon footprint of U.S. households is about 5 times greater than the global average. For most U.S. households the single most important action to reduce their carbon footprint is driving less or switching to a more efficient vehicle.[45]
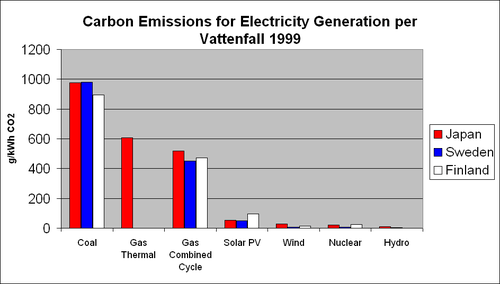
The carbon footprints of energy
The following table compares, from peer-reviewed studies of full life cycle emissions and from various other studies, the carbon footprint of various forms of energy generation: nuclear, hydro, coal, gas, solar cell, peat and wind generation technology. (Studies dated 2006 and 2008)
2 than fossil fuel generation.
| Fuel/ resource |
Thermal (g[CO2-eq]/MJth) |
Energy intensity (Jth/Je) |
Electric (g[CO2-eq]/kW·he) | |
|---|---|---|---|---|
| Coal | B | 91.50–91.72 | 2.62–2.85[46] | 863–941[46] |
| Br | 94.33 | 3.46[46] | 1,175[46] | |
| 88 | 3.01 | 955[47] | ||
| Oil | 73[48] | 3.40 | 893[47] | |
| Natural gas | cc | 68.20 | − | 577[46] |
| oc | 68.4 | 751[46] | ||
| 599[47] | ||||
| Geothermal power |
TL | 3~ | − | 0–1[47] |
| TW | 91–122[47] | |||
| Uranium Nuclear power |
WL | N/A | 0.18[46] | 60[46] |
| WL | 0.20[46] | 65[46] | ||
| Hydroelectricity (run of river) | N/A | 0.046[46] | 15[46] | |
| Conc. solar power | 40±15 | |||
| Photovoltaics | 0.33[46] | 106[46] | ||
| Wind power | 0.066[46] | 21[46] | ||
Note: 3.6 megajoules (MJ) = 1 kilowatt-hour (kW·h), thus 1 g/MJ = 3.6 g/kW·h.
Legend
- B
- Black coal (supercritical)–(new subcritical)
- Br
- Brown coal (new subcritical)
- cc
- combined cycle
- oc
- open cycle
- TL
- Low-temperature/closed-circuit (geothermal doublet)
- TH
- High-temperature/open-circuit
- WL
- Light water reactors
- WH
- Heavy water reactors, estimate.
These three studies thus concluded that hydroelectric, wind, and nuclear power produced the least CO2 per kilowatt-hour of any other electricity sources. These figures do not allow for emissions due to accidents or terrorism. Wind power and solar power, emit no carbon from the operation, but do leave a footprint during construction phase and maintenance during operation. Hydropower from reservoirs also has large footprints from initial removal of vegetation and ongoing methane (stream detritus decays anaerobically to methane in bottom of reservoir, rather than aerobically to CO2 if it had stayed in an unrestricted stream).[49]
The table above gives the carbon footprint per kilowatt-hour of electricity generated, which is about half the world's man-made CO2 output. The CO2 footprint for heat is equally significant and research shows that using waste heat from power generation in combined heat and power district heating, chp/dh has the lowest carbon footprint,[50] much lower than micro-power or heat pumps.
Coal production has been refined to greatly reduce carbon emissions; since the 1980s, the amount of energy used to produce a ton of steel has decreased by 50%.[51]
Passenger transport
_per_passenger_mile_(USA_2008).png)
2 Emissions From Different Transportation Modes, October 2008' (Manchester, NH: M.J. Bradley & Associates, 2008), p. 4, table 1.1[52]
This section gives representative figures for the carbon footprint of the fuel burned by different transport types (not including the carbon footprints of the vehicles or related infrastructure themselves). The precise figures vary according to a wide range of factors.
Flight
Some representative figures for CO2 emissions are provided by LIPASTO's survey of average direct emissions (not accounting for high-altitude radiative effects) of airliners expressed as CO2 and CO2 equivalent per passenger kilometre:[53]
- Domestic, short distance, less than 463 km (288 mi): 257 g/km CO2 or 259 g/km (14.7 oz/mile) CO2e
- Long distance flights: 113 g/km CO2 or 114 g/km (6.5 oz/mile) CO2e
However, emissions per unit distance travelled is not necessarily the best indicator for the carbon footprint of air travel, because the distances covered are commonly longer than by other modes of travel. It is the total emissions for a trip that matters for a carbon footprint, not merely the rate of emissions. For example, because air travel makes rapid long-distance travel feasible, a holiday destination may be chosen that is much more distant than if another mode of travel were used.[54]
Road
CO2 emissions per passenger-kilometre (pkm) for all road travel for 2011 in Europe as provided by the European Environment Agency:[55]
- 109 g/km CO2 (Figure 2)
For vehicles, average figures for CO2 emissions per kilometer for road travel for 2013 in Europe, normalized to the NEDC test cycle, are provided by the International Council on Clean Transportation:[56]
- Newly registered passenger cars: 127 g CO2/km
- Hybrid-electric vehicles: 92 g CO2/km
- Light commercial vehicles (LCV): 175 g CO2/km
Average figures for the United States are provided by the US Environmental Protection Agency,[57] based on the EPA Federal Test Procedure, for the following categories:
- Passenger cars: 200 g CO2/km (322 g/mi)
- Trucks: 280 g CO2/km (450 g/mi)
- Combined: 229 g CO2/km (369 g/mi)
Rail
In 2005, the US company Amtrak's carbon dioxide equivalent emissions per passenger kilometre were 116 g,[58][59] about twice as high as the UK rail average (where much more of the system is electrified),[60] and about eight times a Finnish electric intercity train.[61]
Sea
Average carbon dioxide emissions by ferries per passenger-kilometre seem to be 0.12 kg (4.2 oz).[62] However, 18-knot ferries between Finland and Sweden produce 0.221 kg (7.8 oz) of CO2, with total emissions equalling a CO2 equivalent of 0.223 kg (7.9 oz), while 24–27-knot ferries between Finland and Estonia produce 0.396 kg (14.0 oz) of CO2 with total emissions equalling a CO2 equivalent of 0.4 kg (14 oz).[63]
The carbon footprints of products
Several organizations offer footprint calculators for public and corporate use, and several organizations have calculated carbon footprints of products.[64] The US Environmental Protection Agency has addressed paper, plastic (candy wrappers), glass, cans, computers, carpet and tires. Australia has addressed lumber and other building materials. Academics in Australia, Korea and the US have addressed paved roads. Companies, nonprofits and academics have addressed mailing letters and packages. Carnegie Mellon University has estimated the CO2 footprints of 46 large sectors of the economy in each of eight countries. Carnegie Mellon, Sweden and the Carbon Trust have addressed foods at home and in restaurants.
The Carbon Trust has worked with UK manufacturers on foods, shirts and detergents, introducing a CO2 label in March 2007. The label is intended to comply with a new British Publicly Available Specification (i.e. not a standard), PAS 2050,[65] and is being actively piloted by The Carbon Trust and various industrial partners.[66] As of August 2012 The Carbon Trust state they have measured 27,000 certifiable product carbon footprints.[67]
Evaluating the package of some products is key to figuring out the carbon footprint.[68] The key way to determine a carbon footprint is to look at the materials used to make the item. For example, a juice carton is made of an aseptic carton, a beer can is made of aluminum, and some water bottles either made of glass or plastic. The larger the size, the larger the footprint will be.
Food
In a 2014 study by Scarborough et al., the real-life diets of British people were surveyed and their dietary greenhouse gas footprints estimated.[69] Average dietary greenhouse-gas emissions per day (in kilograms of carbon dioxide equivalent) were:
- 7.19 for high meat-eaters
- 5.63 for medium meat-eaters
- 4.67 for low meat-eaters
- 3.91 for fish-eaters
- 3.81 for vegetarians
- 2.89 for vegans
Textiles
The precise carbon footprint of different textiles varies considerably according to a wide range of factors. However, studies of textile production in Europe suggest the following carbon dioxide equivalent emissions footprints per kilo of textile at the point of purchase by a consumer:[70]
- Cotton: 8
- Nylon: 5.43
- PET (e.g. synthetic fleece): 5.55
- Wool: 5.48
Accounting for durability and energy required to wash and dry textile products, synthetic fabrics generally have a substantially lower carbon footprint than natural ones.[71]
Materials
The carbon footprint of materials (also known as embodied carbon) varies widely. The carbon footprint of many common materials can be found in the Inventory of Carbon & Energy database,[72] the GREET databases and models,[73] and LCA databases via openLCA Nexus.[74] The carbon footprint of any manufactured product should be verified by a third-party.[75]
Cement
Cement production gives a major contribution to CO2 emissions. Cement production and carbon footprint resulting from soil sealing in Italy as of 2003 was 8.0 tonne per person CO2 emissions. The balance between carbon loss due to soil sealing and carbon stocked in man-made infrastructures resulted in a net loss to the atmosphere, minus 0.6 tonne CO2 per hectare and year.[76]
See also
- 2000-watt society
- Avoiding dangerous climate change
- Carbon accounting
- Carbon cycle
- Carbon diet
- Carbon intensity
- Carbon literacy
- Carbon lock-in
- Climate footprint
- Ecological footprint
- Ecosharing
- Energy neutral design
- Energy policy
- Enterprise carbon accounting
- Environmental impact of aviation
- Food miles
- Greenhouse debt
- Greenhouse gas emissions accounting
- Global warming
- Greenhouse gas inventory
- Hyper-mobile travellers
- Land footprint
- Life cycle assessment
- List of countries by carbon dioxide emissions per capita
- List of countries by greenhouse gas emissions per capita
- Low carbon diet
- Telecommuting
- Veganism
- Water footprint
- Weighted average cost of carbon
References
Notes
- The footprints per capita of countries in Africa and India were well below average. To set these numbers into context, assuming a global population around 9–10 billion by 2050 a carbon footprint of about 2–2.5 tons CO2e per capita is needed to stay within a 2 °C target. The carbon footprint calculations are based on a consumption based approach using a Multi-Regional[42] Input-Output database, which accounts for all greenhouse gas (GHG) emissions in the global supply chain and allocates them to the final consumer of the purchased commodities. GHG emissions related to land use cover change are not included.[43]
Citations
- "What is a carbon footprint?". Archived from the original on 11 May 2009. Retrieved 24 July 2009.
- "The CO2 list (and original sources cited therein)". Retrieved 18 March 2011.
- Wright, L.; Kemp, S.; Williams, I. (2011). "'Carbon footprinting': towards a universally accepted definition". Carbon Management. 2 (1): 61–72. doi:10.4155/CMT.10.39.
- Pertsova, Carolyn C. (2007). Ecological Economics Research Trends. Nova Publishers. ISBN 978-1-60021-941-2.
- "Graph of the Average Carbon Footprint of a U.S. Household". Retrieved 4 May 2012.
- Sundarakani, Balan; Goh, Mark; Souza, Robert de; Shun, Cai (1 January 2008). "Measuring carbon footprints across the supply chain". University of Wollongong in Dubai - Papers: 555–562.
- "My Carbon Plan - Carbon Footprint Calculator, which provides a calculator using ONS data in the UK". mycarbonplan.org. Retrieved 4 April 2020.
- "CO2List.org which shows CO2 coming from common products and activities". co2list.org. Retrieved 4 October 2019.
- "CoolClimate Carbon Footprint Calculator for U.S. Households and Individuals". Retrieved 4 May 2012.
- "Online supporting data, calculations & methodologies for paper: Jones, Kammen "Quantifying Carbon Footprint Reduction Opportunities for U.S. Households and Communities" ES&T, 2011 (publicly available)". Retrieved 4 May 2012.
- "Calculator". carbonstory.org. Archived from the original on 12 March 2014. Retrieved 12 March 2014.
- Collin, Robert William; Schwartz, Debra Ann (2011). "Carbon Offsets". In Michael Shally-Jensen (ed.). Encyclopedia of Contemporary American Social Issues, vol. 4: Environment, Science, and Technology. ABC-CLIO. pp. 1311–1314. ISBN 978-0-3133-9204-7.
- "Environmental management -- Life cycle assessment -- Principles and framework". International Organization for Standardization.
- DIN EN ISO 14067:2019-02, Treibhausgase_- Carbon Footprint von Produkten_- Anforderungen an und Leitlinien für Quantifizierung (ISO_14067:2018); Deutsche und Englische Fassung EN_ISO_14067:2018, Beuth Verlag GmbH, doi:10.31030/2851769
- Safire, William (17 February 2008). "Footprint". The New York Times. Retrieved 30 December 2019.
- "Product Life Cycle Accounting and Reporting Standard" (PDF). GHG Protocol. Retrieved 25 February 2019.
- Bellassen, Valentin (2015). Accounting for Carbon Monitoring, Reporting and Verifying Emissions in the Climate Economy. Cambridge University Press. p. 6. ISBN 9781316162262.
- "Emission Factors for Greenhouse Gas Inventories" (PDF). EPA.
- "Government emission conversion factors for greenhouse gas company reporting". GOV.UK.
- "CO2 Emissions from Fuel Combustion". IEA.
- "Scope 2 Calculation Guidance" (PDF). GHG Protocol.
- Perkins, Sid (11 July 2017). "The best way to reduce your carbon footprint is one the government isn't telling you about". Science. Retrieved 31 December 2017.
- Wynes, Seth; Nicholas, Kimberly A (2017). "The climate mitigation gap: education and government recommendations miss the most effective individual actions". Environmental Research Letters. 12 (7): 074024. Bibcode:2017ERL....12g4024W. doi:10.1088/1748-9326/aa7541.
- Eshel, Gidon; Martin, Pamela A. (2006). "Diet, Energy, and Global Warming". Earth Interactions. 10 (9): 1–17. Bibcode:2006EaInt..10i...1E. CiteSeerX 10.1.1.394.3094. doi:10.1175/EI167.1.
- Syd Baumel (27 April 2007). Presentation to the Manitoba Clean Environment Commission "Hog Production Industry Review" (PDF) (Report). Archived (PDF) from the original on 5 October 2013.
- Larry West. "Personal Steps You Can Take to Fight Global Warming". About.com News & Issues.
- "Dressed Not to Chill". Enlighten Up! with The Aquarian.
- "LOW-TECH MAGAZINE". lowtechmagazine.com.
- Daniel Goleman (12 March 2012). "Handprints, Not Footprints". Time. Retrieved 4 June 2019.
- Jones, Christopher M.; Kammen, Daniel M. (March 2011). "Quantifying Carbon Footprint Reduction Opportunities for U.S. Households and Communities". Environ. Sci. Technol. 45 (9): 4088–4095. Bibcode:2011EnST...45.4088J. doi:10.1021/es102221h. PMID 21449584.
- "Solutions". Drawdown. 7 February 2017. Retrieved 6 September 2019.
- 90 billion estimate from Project Drawdown, 98 billion estimate fromShah, Nihar; Wei, Max; Letschert, Virginie; Phadke, Amol (1 October 2015). Benefits of Leapfrogging to Superefficiency and Low Global Warming Potential Refrigerants in Room Air Conditioning (Report). Lawrence Berkeley National Lab. (LBNL), Berkeley, CA (United States).
- Hua, Guowei; Cheng, T. C. E.; Wang, Shouyang (1 August 2011). "Managing carbon footprints in inventory management". International Journal of Production Economics. 132 (2): 178–185. doi:10.1016/j.ijpe.2011.03.024. ISSN 0925-5273.
- Easterlyn, Jonah. "U.S. Energy Information Administration - EIA - Independent Statistics and Analysis." How Much of U.S. Carbon Dioxide Emissions Are Associated with Electricity Generation? - FAQ - U.S. Energy Information Administration (EIA). N.p., 1 April 2016. Web. 5 December 2016.
- Molina, Maggie (October 2016). "The Greatest Energy Story You Haven't Heard: How Investing in Energy Efficiency Changed the US Power Sector and Gave Us a Tool to Tackle Climate Change" (PDF). ACEEE.
- o'Rielly, K.; Jeswiet, J. (January 2014). "Strategies to Improve Industrial Energy Efficiency". Procedia Cirp. 15: 325–330. doi:10.1016/j.procir.2014.06.074.
- Corbett, James (2008). "Carbon Footprint". In Brenda Wilmoth Lerner; K. Lee Lerner (eds.). Climate Change: In Context, vol. 1. Gale. pp. 162–164. ISBN 978-1-4144-3708-8.
- Callick, Rowan. "Nations Split on Route to Reduce Carbon Emissions." The Australian. 2 March 2011. Web. 1 March 2011.
- "Archived copy" (PDF). Archived from the original (PDF) on 10 July 2011. Retrieved 21 August 2007.CS1 maint: archived copy as title (link)
- "Archived copy". Archived from the original on 7 July 2007. Retrieved 21 August 2007.CS1 maint: archived copy as title (link)
- "CO2 emissions (metric tons per capita)". The World Bank. Retrieved 4 March 2019.
- "Inventory of U.S. Greenhouse Gas Emissions and Sinks". EPA. Retrieved 1 April 2019.
- Tukker, Arnold; Bulavskaya, Tanya; Giljum, Stefan; de Koning, Arjan; Lutter, Stephan; Simas, Moana; Stadler, Konstantin; Wood, Richard (2016). "Environmental and resource footprints in a global context: Europe's structural deficit in resource endowments". Global Environmental Change. 40: 171–181. doi:10.1016/j.gloenvcha.2016.07.002.
- Ivanova, Diana; Stadler, Konstantin; Steen-Olsen, Kjartan; Wood, Richard; Vita, Gibran; Tukker, Arnold; Hertwich, Edgar (2016). "Environmental Impact Assessment of Household Consumption". Journal of Industrial Ecology. 20 (3): 526–536. doi:10.1111/jiec.12371.
- Jones, Christopher; Kammen, Daniel (2011). "Quantifying Carbon Footprint Reduction Opportunities for U.S. Households and Communities". Environmental Science & Technology. 45 (9): 4088–4095. Bibcode:2011EnST...45.4088J. doi:10.1021/es102221h. PMID 21449584.
- Bilek, Marcela; Hardy, Clarence; Lenzen, Manfred; Dey, Christopher (2008). "Life-cycle energy balance and greenhouse gas emissions of nuclear energy: A review" (PDF). SLS. 49 (8): 2178–2199. Archived from the original (PDF) on 25 October 2009. Retrieved 4 November 2009.
-
Fridleifsson, Ingvar B.; Bertani, Ruggero; Huenges, Ernst; Lund, John W.; Ragnarsson, Arni; Rybach, Ladislaus (11 February 2008). O. Hohmeyer and T. Trittin (ed.). "The possible role and contribution of geothermal energy to the mitigation of climate change" (PDF). Luebeck, Germany: 59–80. Archived from the original (PDF) on 22 July 2011. Retrieved 6 April 2009. Cite journal requires
|journal=(help) - Hanova, J; Dowlatabadi, H (9 November 2007). "Strategic GHG reduction through the use of ground source heat pump technology" (PDF). Environmental Research Letters. 2. UK: IOP Publishing. pp. 044001 8pp. doi:10.1088/1748-9326/2/4/044001. ISSN 1748-9326. Retrieved 22 March 2009.
- "Hydroelectricity". CO2List. Retrieved 30 September 2013.
- "Carbon footprints of various sources of heat - CHPDH comes out lowest - Claverton Group". claverton-energy.com.
- Aldridge, Susan (2016). "Coal and Steel". In Brenda Wilmoth Lerner; K. Lee Lerner; Thomas Riggs (eds.). Energy: In Context, vol. 1. Gale. pp. 111–113. ISBN 978-1-4103-1751-3.
- "Archived copy" (PDF). Archived from the original (PDF) on 15 May 2013. Retrieved 23 November 2012.CS1 maint: archived copy as title (link)
- "Average passenger aircraft emissions and energy consumption per passenger kilometre in Finland 2008". lipasto.vtt.fi. Retrieved 3 July 2009.
- Gössling S., Upham P. (2009). Climate change and aviation: Issues, challenges and solutions. EarthScan. 386pp.
- "Energy efficiency and specific CO2 emissions (TERM 027) - Assessment published Jan 2013". europa.eu.
- EU pocketbook 2014 (PDF). theicct.org. p. 28.
- Light-Duty Automotive Technology, Carbon Dioxide Emissions, and Fuel Economy Trends: 1975 Through 2014 (PDF). EPA (Report). October 2014. EPA-420-R-14-023a. Archived from the original (PDF) on 2 April 2015.
- "table 1.1, figures from 2005. Cf" (PDF). Archived from the original (PDF) on 15 May 2013.
- "sheet 8, cell C33 (figures from 2002)". Archived from the original on 12 January 2016. Retrieved 5 July 2014.
- "figures from 2008–9" (PDF). Archived from the original (PDF) on 24 March 2009. Retrieved 23 November 2012.
- "figures for 2007". vtt.fi.
- Holthof, Philippe (10 April 2009). "SOx and CO2 Emissions once again Hot Topic at Ferry Shipping Conference" (PDF). Ferry Shipping Conference 08: Building Bridges in the Industry. p. 3.
- "Archived copy". Archived from the original on 19 July 2011. Retrieved 5 July 2014.CS1 maint: archived copy as title (link)
- "CO2 Released when Making & Using Products". Retrieved 27 October 2009.
- "PAS 2050". bsigroup.com.
- "Certification - Carbon Trust". carbontrust.co.uk. Archived from the original on 16 May 2008.
- "Footprint measurement". The Carbon Trust. Retrieved 14 August 2012.
- Pasqualino, Jorgelina; Meneses, Montse; Castells, Francesc (1 April 2011). "The carbon footprint and energy consumption of beverage packaging selection and disposal". Journal of Food Engineering. 103 (4): 357–365. doi:10.1016/j.jfoodeng.2010.11.005.
- Scarborough, Peter; Appleby, Paul N.; Mizdrak, Anja; Briggs, Adam D. M.; Travis, Ruth C.; Bradbury, Kathryn E.; Key, Timothy J. (2014). "Dietary greenhouse gas emissions of meat-eaters, fish-eaters, vegetarians and vegans in the UK". Climatic Change. 125 (2): 179–192. Bibcode:2014ClCh..125..179S. doi:10.1007/s10584-014-1169-1. PMC 4372775. PMID 25834298.
- Berners-Lee, Mike (9 December 2010). How Bad are Bananas? The Carbon Footprint of Everything (London: Profile, 2010), pp. 93, 112 (table 6.1). ISBN 978-1847651822.
- Berners-Lee, Mike (9 December 2010). How Bad are Bananas? The Carbon Footprint of Everything. London: Profile. pp. 93–94. ISBN 978-1847651822.
- G.P.Hammond and C.I.Jones (2011) Embodied energy and carbon footprint database
- GREET databases GREET databases and models
- LCA databases via openLCA Nexus LCA databases via openLCA Nexus
- Shapiro, Gideon Fink (15 January 2020). "How to Measure Embodied Carbon". Architect Magazine. Retrieved 16 March 2020.
- Scalenghe, R.; Malucelli, F.; Ungaro, F.; Perazzone, L.; Filippi, N.; Edwards, A.C. (2011). "Influence of 150 years of land use on anthropogenic and natural carbon stocks in Emilia-Romagna Region (Italy)". Environmental Science & Technology. 45 (12): 5112–5117. Bibcode:2011EnST...45.5112S. doi:10.1021/es1039437. PMID 21609007.
Sources
- Wright, L., Kemp, S., Williams, I. (2011) 'Carbon footprinting': towards a universally accepted definition. Carbon Management, 2 (1): 61–72.
- UK Carbon Trust (2008) "Carbon Footprinting".
- "Carbon footprint of electricity generation,October 2006". researchbriefings.parliament.uk. Parliamentary Office of Science and Technology. October 2006. Retrieved 14 September 2016.
October 2006, Number 268
- Wiedmann, T. and J. Minx (2008). A Definition of 'Carbon Footprint'. Ecological Economics Research Trends. C. C. Pertsova: Chapter 1, pp. 1–11. Nova Science Publishers, Inc, Hauppauge NY, USA. catalog also available as ISA-UK Research Report 07/01
- World Energy Council Report (2004). Comparison of energy systems using life cycle assessment.
- Energetics (2007). The reality of carbon neutrality.
- The GHG Protocol
- Walkers Carbon Footprint
- Generally accepted definition: Carbon Footprint
External links
| Wikinews has related news: New words added to Webster's dictionary |
| |
| Principles |
|
| Consumption |
|
| Population |
|
| Technology |
|
| Biodiversity | |
| Energy |
|
| Food |
|
| Water |
|
| Accountability |
|
| Applications |
|
| Management | |
| Agreements and conferences |
|
| |
| |||||||||||||
| |||||||||||||
| |||||||||||||
| |||||||||||||
| |||||||||||||
| |||||||||||||
| |||||||||||||
| |||||||||||||
| Major topics |
|
|---|---|
| Biological and related topics |
|
| Human impact on the environment |
|
Population ecology |
|
| Literature |
|
| Publications |
|
| Lists |
|
Events and organizations |
|
| Related topics |
|
| |