Black Monday (1987)
Black Monday on October 19, 1987[upper-alpha 1] is the name commonly attached to a sudden, severe, and largely unexpected[1] stock market crash that struck the global financial market system. In the United States, the Dow Jones Industrial Average (DJIA) fell exactly 508 points (22.6%), accompanied by crashes in the futures and options markets.[2] This was one of the largest one-day percentage drops in the history of Dow Jones. Significant selling created steep price declines throughout the day, particularly during the last hour and a half of trading. The S&P 500 and Wilshire 5000 indices each declined more than 18 percent, and the S&P 500 futures contract declined 29 percent.[3] Total trading volume was so large that the computer and communications systems in place at the time were overwhelmed, leaving orders unfilled for an hour or more. Large funds transfers were delayed for hours and the Fedwire and NYSE DOT systems shut down for extended periods of time, further compounding traders' confusion.[4]

All of the twenty-three major world markets experienced a similar decline that October. When measured in a common currency (US dollars), eight of them declined by 20 to 29%, three by 30 to 39% (Malaysia, Mexico and New Zealand), and three by more than 40% (Hong Kong, Australia and Singapore).[5][upper-alpha 2] Worldwide losses were estimated at $1.7 trillion US dollars.[6] The severity of the crash sparked fears of extended economic instability[7] or even a reprise of the Great Depression.[8] Across nations, the degree to which the financial markets' distress spread to the wider economy (the "real economy") was directly related to the monetary policy each nation pursued in response. The central banks of the United States, West Germany and Japan provided liquidity to prevent debt defaults among financial institutions, and the impact on the real economy was relatively limited and short-lived. The Reserve Bank of New Zealand's refusal to loosen monetary policy in response to the crisis, however, had sharply negative and relatively long-term consequences for both financial markets and the real economy.[9]
In finance, the crash of 1987 also apparently had the ongoing effect of altering implied volatility patterns that arise in pricing financial options. Equity options traded in American markets did not show a volatility smile before the crash but began showing one afterward.[10]
United States
Background
In late 1985 and early 1986, the United States economy shifted from a rapid recovery from the early 1980s recession to a slower expansion, resulting in a brief "soft landing" period as the economy slowed and inflation dropped. The stock market advanced significantly, with the Dow peaking in August 1987 at 2,722 points, or 44% over the previous year's closing of 1,895 points.
The crash was preceded by significant drops in the prior week. Two events in the news on the morning of October 14 have sometimes been singled out as possible triggers for the crash.[11] The United States House Committee on Ways and Means introduced a tax bill that would reduce the tax benefits associated with financing mergers and leveraged buyouts.[12] Second, unexpectedly high trade deficit figures announced by the Department of Commerce had a negative impact on the value of the US dollar while pushing interest rates upward and also put downward pressure on stock prices.[11] However, other sources have questioned the impact of these news events. For example, Nobel-prize winning economist Robert J. Shiller surveyed 889 investors (605 individual investors and 284 institutional investors) immediately after the crash regarding several aspects of their experience at the time. Only three institutional investors and no individual investors reported a belief that the news regarding proposed tax legislation was a trigger for the crash. According to Shiller, the most common responses were related to a general mindset of investors at the time: a "gut feeling" of an impending crash, perhaps brought on by "too much indebtedness".[13]
On Wednesday, the DJIA dropped 95.46 points (3.8%) (a then record) to 2,412.70, and it fell another 58 points (2.4%) the next day, down over 12% from the August 25 all-time high. On Friday, October 16, the DJIA fell 108.35 points (4.6%) to close at 2,246.74 on record volume. That was again a one-day record at the time.[14] Though the markets were closed for the weekend, significant selling pressure still existed. The computer models of portfolio insurers continued to dictate very large sales.[15] Moreover, some large mutual fund groups had procedures that enabled customers to easily redeem their shares during the weekend at the same prices that existed at the close of market on Friday.[16] The amount of these redemption requests was far greater than the firms' cash reserves, requiring them to make large sales of shares as soon as the market opened on the following Monday. Finally, some traders anticipated these pressures and tried to get ahead of the market by selling early and aggressively Monday, before the anticipated price drop.[15]
De-linked markets and index arbitrage
Before the New York Stock Exchange (NYSE) opened on Monday the 19th there was pent-up pressure to sell stocks. When the market opened, a large imbalance immediately arose between the volume of sell orders and buy orders, placing considerable downward pressure on stock prices. Regulations at the time permitted designated market makers (also known as "specialists") to delay or suspend trading in a stock if the order imbalance exceeded that specialist's ability to fulfill orders in an orderly manner.[17] The order imbalance on the 19th was so large that 95 stocks on the S&P 500 Index (S&P) opened late, as also did 11 of the 30 Dow Jones Industrial Average (DJIA) stocks.[18] Importantly, however, the futures market opened on time across the board, with heavy selling.[18]
Under normal circumstances the stock market and those of its main derivatives–futures and options–are functionally a single market, given that the price of any particular stock is closely connected to the prices of its counterpart in both the futures and options market.[19] Prices in the derivative markets are typically tightly connected to those of the underlying stock, though they differ somewhat (as for example, prices of futures are typically higher than that of their particular cash stock).[20] During the crisis this link was broken.[21]
When the futures market opened while the stock market was closed, it created a pricing imbalance: the listed price of those stocks which opened late had no chance to change from their closing price of the day before. The quoted prices were thus "stale" and did not reflect current economic conditions; they were generally listed higher than they should have been[22] (and dramatically higher than their respective futures, which are typically higher than stocks).[22]
The decoupling of these markets meant that futures prices had temporarily lost their validity as a vehicle for price discovery; they no longer could be relied upon to inform traders of the direction or degree of stock market expectations. This had harmful effects: it added to the atmosphere of uncertainty and confusion at a time when investor confidence was sorely needed; it discouraged investors from "leaning against the wind" and buying stocks since the discount in the futures market logically implied that investors could wait and purchase stocks at an even lower price; and it encouraged portfolio insurance investors to sell in the stock market, putting further downward pressure on stock prices.[23]
The gap between the futures and stocks was quickly noted by index arbitrage traders who tried to profit through sell at market orders. Index arbitrage, a form of program trading,[24] added to the confusion and the downward pressure on prices:[18]
...reflecting the natural linkages among markets, the selling pressure washed across to the stock market, both through index arbitrage and direct portfolio insurance stock sales. Large amounts of selling, and the demand for liquidity associated with it, cannot be contained in a single market segment. It necessarily overflows into the other market segments, which are naturally linked. There are, however, natural limits to Intermarket liquidity which were made evident on October 19 and 20.[25]
Although arbitrage between index futures and stocks placed downward pressure on prices, it does not explain why the surge in sell orders that brought steep price declines began in the first place.[26] Moreover, the markets "performed most chaotically" during those times when the links that index arbitrage program trading creates between these markets was broken.[27]
Portfolio insurance hedges
Portfolio insurance is a hedging technique which attempts to manage risk and limit losses by buying and selling financial instruments (for example, stocks or futures) in reaction to changes in market price rather than changes in market fundamentals. Specifically, they buy when the market is rising, and sell when the market is falling, without regard for any fundamental information about why the market is rising or falling.[28] Thus it is an example of an "informationless trade"[29] that has the potential to create a market-destabilizing feedback loop.[30]
This strategy became a source of downward pressure when portfolio insurers whose computer models noted that stocks opened lower and continued their steep price. The models recommended even further sales.[18] The potential for computer-generated feedback loops that these hedges created has been discussed as a factor compounding the severity of the crash, but not as an initial trigger.[31] Economist Hayne Leland argues against this interpretation, suggesting that the impact of portfolio hedging on stock prices was probably relatively small.[32] Similarly, the report of the Chicago Mercantile Exchange found the influence of "other investors – mutual funds, broker-dealers, and individual shareholders – was thus three to five times greater than that of the portfolio insurers" during the crash.[33] Numerous econometric studies have analyzed the evidence to determine whether portfolio insurance exacerbated the crash, but the results have been unclear.[34] Markets around the world that did not have portfolio insurance trading experienced as much turmoil and loss as the U.S. market;[35]. More to the point, the cross-market analysis of Richard Roll, for example, found that markets with a greater prevalence of computerized trading (including portfolio insurance) actually experienced relatively less severe losses (in percentage terms) than those without.[36]
Noise trading
The crisis affected markets around the world; however, no international news event or change in market fundamentals has been shown to have had a strong effect on investor behavior.[37] Instead, contemporaneous causality and feedback behavior between markets increased dramatically during this period.[38] In an environment of increased volatility, confusion and uncertainty, investors not only in the US but also across the world[39] were inferring information from changes in stock prices and communication with other investors[40] in a self-reinforcing contagion of fear.[41] This pattern of basing trading decisions largely on psychological factors is often referred to as one form of "noise trading", which occurs when ill-informed investors "[trade] on noise as if it were news".[42] If noise is misinterpreted as bad news, then the reactions of risk-averse traders and arbitrageurs will bias the market, preventing it from establishing prices that accurately reflect the fundamental state of the underlying stocks.[43] For example, on October 19 rumors that the New York Stock Exchange would close created additional confusion and drove prices further downward, while rumors the next day that two Chicago Mercantile Exchange clearinghouses were insolvent deterred some investors from trading in that marketplace.[44]
A feedback loop of noise-induced-volatility has been cited by some analysts as the major reason for the severe depth of the crash. It does not, however, explain what initially triggered the market break.[45] Moreover, Lawrence A. Cunningham has suggested that while noise theory is "supported by substantial empirical evidence and a well-developed intellectual foundation", it makes only a partial contribution toward explaining events such as the crash of October 1987.[46] Informed traders, not swayed by psychological or emotional factors, have room to make trades they know to be less risky.[47]
Margin calls and liquidity
Frederic Mishkin suggested that the greatest economic danger was not events on the day of the crash itself, but the potential for "spreading collapse of securities firms" if an extended liquidity crisis in the securities industry began to threaten the solvency and viability of brokerage houses and specialists. This possibility first loomed on the day after the crash.[48] At least initially, there was a very real risk that these institutions could fail.[49] If that happened, spillover effects could sweep over the entire financial system, with negative consequences for the real economy as a whole.[50]
The source of these liquidity problems was a general increase in margin calls; after the market's plunge, these were about ten times their average size and three times greater than the highest previous morning variation call.[51] Several firms had insufficient cash in customers' accounts (that is, they were "undersegregated"). Firms drawing funds from their own capital to meet the shortfall sometimes became undercapitalized; for example, 11 firms had a margin call from a single customer that exceeded that firm's adjusted net capital, sometimes by as much as two-to-one.[49] Investors needed to repay end-of-day margin calls made on the 19th before the opening of the market on the 20th. Clearinghouse member firms called on lending institutions to extend credit to cover these sudden and unexpected charges, but the brokerages requesting additional credit began to exceed their credit limit. Banks were also worried about increasing their involvement and exposure to a chaotic market.[52] The size and urgency of the demands for credit placed upon banks was unprecedented.[53] In general, counterparty risk increased as the creditworthiness of counterparties and the value of collateral posted became highly uncertain.[54]
Federal Reserve response
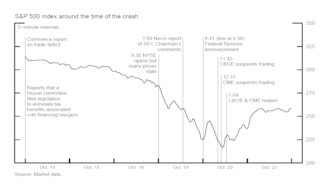
The U.S. central banking system (the Federal Reserve or "the Fed") acted swiftly and decisively as lender of last resort to counter the crisis.[55] The Fed utilized tools it had at its disposal to meet the market disruption: crisis management via public pronouncements, supplying liquidity through open market operations,[56][upper-alpha 3] persuading banks to lend to securities firms, and intervening directly in a few cases.[58]
On the morning of October 20, Fed Chairman Alan Greenspan made a brief statement: "The Federal Reserve, consistent with its responsibilities as the Nation's central bank, affirmed today its readiness to serve as a source of liquidity to support the economic and financial system".[59] Fed sources suggested that the brevity was deliberate, in order to avoid misinterpretations.[56] This "extraordinary"[60] announcement probably had a calming effect on markets[61] that were facing an equally unprecedented demand for liquidity[53] and the immediate potential for a liquidity crisis.[62]
The Fed then acted to provide market liquidity and prevent the crisis from expanding into other markets. It immediately began injecting its reserves into the financial system via purchases on the open market. This rapidly pushed the federal funds rate down by 0.5%. The Fed continued its expansive open market purchases of securities for weeks. The Fed also repeatedly began these interventions an hour before the regularly scheduled time, notifying dealers of the schedule change on the evening beforehand. This was all done in a very high-profile and public manner, similar to Greenspan's initial announcement, to restore market confidence that liquidity was forthcoming.[63] Although the Fed's holdings expanded appreciably over time, the speed of expansion was not excessive.[64] Moreover, the Fed later disposed of these holdings so that its long-term policy goals would not be adversely affected.[56]
Finally, and very importantly, the Fed successfully met the unprecedented demands for credit[65] by pairing a strategy of moral suasion that motivated nervous banks to lend to securities firms alongside its moves to reassure those banks by actively supplying them with liquidity.[66] As economist Ben Bernanke (who was later to become Chairman of the Federal Reserve) wrote:
The Fed's key action was to induce the banks (by suasion and by the supply of liquidity) to make loans, on customary terms, despite chaotic conditions and the possibility of severe adverse selection of borrowers. In expectation, making these loans must have been a money-losing strategy from the point of view of the banks (and the Fed); otherwise, Fed persuasion would not have been needed.[67]
The Fed's two-part strategy was thoroughly successful, since lending to securities firms by large banks in Chicago and especially in New York increased substantially, often nearly doubling.[68]
Regulation
After Black Monday, regulators overhauled trade-clearing protocols to bring uniformity to all prominent market products. They also developed new rules, known as "trading curbs" or colloquially as circuit breakers, allowing exchanges to temporarily halt trading in instances of exceptionally large price declines in some indexes; for instance, the DJIA.[69] These trading curbs were first used multiple times during the 2020 stock market crash.[70]
UK
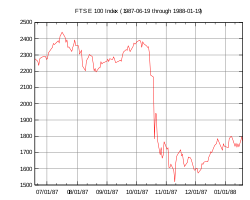
On Friday, October 16, all the markets in London were unexpectedly closed due to the Great Storm of 1987. After London re-opened, the speed of the crash accelerated in London, partially attributed by some to the storm closure. By 9:30 a.m., the FTSE100 had fallen over 136 points.[71] The abrupt drop of the FTSE index brought it down 23 percent in two days, roughly the same percentage that the NYSE dropped on the day of the crash. Stocks then continued to fall, albeit at a less precipitous rate, until reaching a trough in mid-November at an accumulative 36% below its pre-crash peak. Stocks did not begin to recover until 1989.[72]
Japan
In Japan the October 1987 crash is sometimes referred to as "Blue Tuesday", in part because of the time zone difference, and in part because its effects after the initial crash were relatively mild.[6] In both places, according to economist Ulrike Schaede, the initial market break was severe: the Tokyo market declined 14.9% in one day, and Japan's losses of US$421 billion ranked next to New York's $500 billion, out of a worldwide total loss of $1.7 trillion. However, systemic differences between the US and Japanese financial systems led to significantly different outcomes during and after the crash on Tuesday, October 20. In Japan the ensuing panic was no more than mild at worst. The Nikkei 225 Index returned to its pre-crash levels after only five months. Other global markets performed less well in the aftermath of the crash, with New York, London and Frankfurt all needing more than a year to achieve the same level of recovery.[73]
Several of Japan's distinctive institutional characteristics already in place at the time, according to economist David D. Hale, helped it dampen volatility. These included trading curbs such as a sharp limit on price movements of a share of more than 10–15 percent; restrictions and institutional barriers to short-selling by domestic and international traders; frequent adjustments of margin requirements in response to changes in volatility; strict guidelines on mutual fund redemptions; and actions of the Ministry of Finance to control the total shares of stock and exert moral suasion on the securities industry.[74] An example of the latter occurred when the ministry invited representatives of the four largest securities firms to tea in the early afternoon of the day of the crash.[75] After tea at the ministry, these firms began to make large purchases of Nippon Telephone and Telegraph (NTT) stocks.[75]
New Zealand
The crash of the New Zealand stock market was notably long and deep, continuing its decline for an extended period of time after other global markets had recovered.[76] Unlike other nations, moreover, for New Zealand the effects of the October 1987 crash spilled over into its real economy, contributing to a prolonged recession.[77]
The effects of the worldwide economic boom of the mid-1980s had been amplified in New Zealand by a recent relaxation of foreign exchange controls and a wave of banking deregulation. Deregulation in particular suddenly gave financial institutions considerably more freedom to lend, though they had little experience in doing so.[78] The finance industry was in a state of increasing optimism that approached euphoria.[79] This created an atmosphere conducive to greater risk taking, which investors took advantage of through increased speculation in the stock market and real estate. Foreign investors were notably active in this trend, attracted by New Zealand's relatively high interest rates. From around the end of 1984 until the date of the crash, commercial property prices and commercial construction rose sharply, while share prices in the stock market tripled.[78]
New Zealand's stock market fell nearly 15% on the first day of the crash.[80] In the first three-and-a-half months following the crash, the value of New Zealand's market shares was cut in half.[81] By the time it reached its trough in February 1988 the market had lost 60 percent of its value.[80] The financial crisis triggered a wave of deleveraging with significant macro-economic consequences. Investment companies and property developers began a fire sale of their properties, partially to help offset their share price losses, and partially because the crash had exposed overbuilding. Moreover, these firms had been using property as collateral for their increased borrowing. Thus when property values collapsed, the health of balance sheets of lending institutions was damaged.[80] The Reserve Bank of New Zealand declined to loosen monetary policy in response to the crisis, however, which would have helped firms settle their obligations and remain in operation.[9] As the harmful effects spread over the next few years, major corporations and financial institutions went out of business, and the banking systems of New Zealand and Australia were impaired.[81] Access to credit was reduced.[80] The combination of these contributed significantly to a long recession running from 1987 until 1993.[80]
See also
- 2010 Flash Crash
- Black Friday (October 13, 1989)
- List of largest daily changes in the Dow Jones Industrial Average
- Stock market crashes in Hong Kong
- Wall Street Crash of 1929 (Black Tuesday)
- Black Monday (2019 TV Series)
- Black Monday (2020)
Footnotes
- In Australia and New Zealand, the 1987 crash is also referred to as "Black Tuesday" because of the time zone difference.
- The markets were: Australia, Austria, Belgium, Canada, Denmark, France, Germany, Hong Kong, Ireland, Italy, Japan, Malaysia, Mexico, the Netherlands, New Zealand, Norway, Singapore, South Africa, Spain, Sweden, Switzerland, and the United States.
- Discount window borrowing did not play a major role in the Federal Reserve's response to the crisis.[57]
References
- Bates 1991; Seyhun 1990.
- Brady Report 1988, p. 1.
- Carlson 2007, pp. 8–9.
- Carlson 2007, p. 9; Bernanke 1990, p. 146.
- Roll 1988, pp. 20 (table 1), 21.
- Schaede 1991, p. 42.
- Group of 33.
- Lobb 2007.
- Grant 1997, p. 330; Hunt 2009.
- Hull 2003, p. 335.
- Carlson 2007, p. 6.
- Carlson 2007, p. 6; Malliaris & Urrutia 1992, p. 354.
- Shiller 1988, pp. 292–293.
- Bernhardt & Eckblad 2013, pp. 2, 6 note 5.
- Lindsey & Pecora 1998, pp. 3–4.
- Brady Report 1988, p. 29.
- Carlson 2007, p. 8, note 11.
- Carlson 2007, p. 8.
- Kleidon & Whaley 1992, pp. 851–52; Brady Report 1988, p. 55 & 57.
- Kleidon & Whaley 1992, p. 851.
- Kleidon & Whaley 1992, pp. 851–52.
- Kleidon & Whaley 1992, pp. 859–60.
- Macey, Mitchell & Netter 1988, p. 832.
- Carlson 2007, p. 5.
- Brady Report 1988, p. 56.
- Harris 1988, p. 933.
- Miller et al. 1989, pp. 12–13.
- Leland 1988; Leland 1992.
- Macey, Mitchell & Netter 1988, p. 819, note 84.
- Leland 1992, p. 55.
- Brady Report 1988, p. v.
- Leland 1988, pp. 83–84.
- Miller et al. 1989, p. 6.
- MacKenzie 2004, p. 10.
- Miller et al. 1989, pp. 6–7.
- Roll 1988, pp. 29–30.
- Shiller 1987, p. 23; Bernanke 1990, p. 133.
- Malliaris & Urrutia 1992, pp. 362–63.
- King & Wadhwani 1990.
- Shiller 1987, p. 23.
- Goodhart 1988.
- Black 1988, pp. 273–74.
- Cunningham 1994, p. 10.
- Carlson 2007, pp. 9, 10, 17.
- Shleifer & Summers 1990, p. 30; Black 1988, pp. 273–74.
- Cunningham 1994, pp. 3, 10.
- Cunningham 1994, p. 26.
- Mishkin 1988, pp. 29–30.
- Brady Report 1988, Study VI, p. 73
- Cecchetti & Disyatat 2009, p. 1; Carlson 2007, p. 20.
- Brady Report 1988, Study VI, p. 70; Carlson 2007, pp. 12–13.
- Carlson 2007, pp. 12–13.
- Garcia 1989, p. 153.
- Kohn 2006; Bernanke 1990, pp. 146–47.
- Garcia 1989.
- Garcia 1989, p. 151.
- Carlson 2007, p. 18, note 17; Garcia 1989, p. 159.
- Bernanke 1990, p. 148.
- Greenspan 1987, p. 915.
- Mishkin 1988, p. 30.
- Carlson 2007, p. 10.
- Mishkin 1988, pp. 29–30; Brady Report 1988, Study VI, p. 73
- Carlson 2007, pp. 17–18.
- Carlson 2007, p. 18.
- Carlson 2007, pp. 13–14; Garcia 1989, p. 153.
- Garcia 1989, p. 153; Bernanke 1990, p. 149.
- Bernanke 1990, p. 149.
- Carlson 2007, p. 14; Bernanke 1990, p. 149.
- Bernhardt & Eckblad 2013, p. 3; Lindsey & Pecora 1998.
- Shieber 2020.
- Black Monday 10th 1997.
- Roberts 2008, pp. 53–54.
- Schaede 1991, pp. 42–45.
- Hale 1988, pp. 182–83.
- Schaede 1991, p. 45.
- Grant 1997, p. 329.
- Hunt 2009, p. 36; Grant 1997, p. 337.
- Hunt 2009, p. 35; Reddell & Sleeman 2008, p. 14.
- Hunt 2009, p. 35.
- Hunt 2009, p. 36.
- Reddell & Sleeman 2008, p. 14.
Sources
- Bates, David S. (1991). "The Crash of ʼ87: Was It Expected? The Evidence from Options Markets". The Journal of Finance. 46 (3): 1009–1044. doi:10.1111/j.1540-6261.1991.tb03775.x.CS1 maint: ref=harv (link)
- Bernanke, Ben S. (1990). "Clearing and Settlement during the Crash". The Review of Financial Studies. 3 (1): 133–151. doi:10.1093/rfs/3.1.133.CS1 maint: ref=harv (link)
- Bernhardt, Donald; Eckblad, Marshall (2013). "Black Monday: The Stock Market Crash of 1987". Federal Reserve History. Retrieved September 1, 2019.CS1 maint: ref=harv (link)
- "Black Monday 10th Anniversary 1987 Timeline". The Motley Fool. October 19, 1997. Archived from the original on March 6, 2007. Retrieved October 15, 2007.
- Black, Fischer (1988). "An equilibrium model of the crash". NBER Macroeconomics Annual. 3: 269–275. doi:10.1086/654089.CS1 maint: ref=harv (link)
- Carlson, Mark A. (2007). A Brief History of the 1987 Stock Market Crash with a Discussion of the Federal Reserve Response (PDF) (Technical report). Finance and Economics Discussion Series. Washington, D.C.: Federal Reserve Board. 13.CS1 maint: ref=harv (link)
- Cecchetti, Stephen Giovanni; Disyatat, Piti (2009). Central bank tools and liquidity shortages (PDF) (Technical report). Federal Reserve Bank of New York.CS1 maint: ref=harv (link)
- Cunningham, Lawrence A. (1994). "From random walks to chaotic crashes: The linear genealogy of the efficient capital market hypothesis". George Washington Law Review. 62: 546–.CS1 maint: ref=harv (link)
- Garcia, Gillian (1989). "The lender of last resort in the wake of the crash". The American Economic Review. 79 (2): 151–155.CS1 maint: ref=harv (link)
- Goodhart, Charles (1988). "The international transmission of asset price volatility". Financial Market Volatility: 79–120.CS1 maint: ref=harv (link)
- Grant, David Malcolm (1997). Bulls, Bears and Elephants: A History of the New Zealand Stock Exchange. Wellington: Victoria University Press. ISBN 0-86473-308-9. Retrieved July 18, 2016.CS1 maint: ref=harv (link)
- Greenspan, Alan (1987). "Statement by Chairman Greenspan on providing liquidity to the financial system". Federal Reserve Bulletin. 73 (12): 915.CS1 maint: ref=harv (link)
- "Group of 7, Meet the Group of 33". The New York Times. December 26, 1987. Retrieved October 26, 2019.
- Hale, David D. (August 17–19, 1988). Commentary on 'Policies to Curb Stock Market Volatility' (PDF). Symposium on Financial Market Volatility. Jackson Hole, Wyoming: The Federal Reserve Bank of Kansas City. pp. 167–173.CS1 maint: ref=harv (link)
- Harris, Lawrence (1988). "Dangers of Regulatory Overreaction to the October 1987 Crash". Cornell Law Review. 74: 927–42.CS1 maint: ref=harv (link)
- Hunt, Chris (2009). "Banking crises in New Zealand–an historical perspective" (PDF). Reserve Bank of New Zealand Bulletin. 72 (4): 26–41.CS1 maint: ref=harv (link)
- Hull, John C. (2003). Options, Futures and Other Derivatives (5th ed.). Prentice-Hall. ISBN 0-13-046592-5.CS1 maint: ref=harv (link)
- King, Mervyn A.; Wadhwani, Sushil (1990). "Transmission of volatility between stock markets" (PDF). The Review of Financial Studies. 3 (1): 5–33. doi:10.1093/rfs/3.1.5.CS1 maint: ref=harv (link)
- Kohn, Donald L. (May 18, 2006). The Evolving Nature of the Financial System: Financial Crises and the Role of the Central Bank (Speech). Conference on New Directions for Understanding Systemic Risk, Federal Reserve Bank of New York and The National Academy of Science. New York, NY: Board of Governors of the Federal Reserve System.CS1 maint: ref=harv (link)
- Kleidon, Allan W.; Whaley, Robert E. (1992). "One Market? Stocks, Futures, and Options During October 1987". The Journal of Finance. 47 (3, Papers and Proceedings of the Fifty-Second Annual Meeting of the American Finance Association, New Orleans, Louisiana January 3–5, 1992): 851–877. doi:10.1111/j.1540-6261.1992.tb03997.x. JSTOR 2328969.CS1 maint: ref=harv (link)
- Leland, Hayne E. (1988). "Portfolio insurance and October 19th". California Management Review. 30 (44): 80–89. doi:10.2307/41166528. JSTOR 41166528.CS1 maint: ref=harv (link)
- Leland, Hayne E. (October 14, 1992). "portfolio insurance". In Eatwell, John; Milgate, Murray; Newman, Peter (eds.). The New Palgrave Dictionary of Money and Finance: 3 Volume Set. Palgrave Macmillan UK. pp. 154–56. ISBN 978-1-349-11721-5.CS1 maint: ref=harv (link)
- Lindsey, Richard R.; Pecora, Anthony P. (1998). "Ten years after: Regulatory developments in the securities markets since the 1987 market break" (PDF). In Stoll, Hans R. (ed.). Stock Market Policy Since the 1987 Crash: A Special Issue of the Journal of Financial Services Research. Boston, MA: Springer Science & Business Media. pp. 101–132.CS1 maint: ref=harv (link)
- Lobb, Annelena (October 15, 2007). "Looking Back at Black Monday:A Discussion With Richard Sylla". The Wall Street Journal Online. Dow Jones & Company. Retrieved October 15, 2007.CS1 maint: ref=harv (link)
- Macey, Jonathan R.; Mitchell, Mark; Netter, Jeffry (1988). "Restrictions on Short Sales: An Analysis of the Uptick Rule and Its Role in View of the October 1987 Stack Market Crash". Cornell Law Review. 74: 799–835.CS1 maint: ref=harv (link)
- MacKenzie, Donald (2004). "The big, bad wolf and the rational market: portfolio insurance, the 1987 crash and the performativity of economics". Economy and Society. 33 (3): 303–334. doi:10.1080/0308514042000225680.CS1 maint: ref=harv (link)
- Maley, Matt (October 16, 2017). "The real reason for 1987 crash, as told by a Salomon Brothers veteran". cnbc.com.
- Malliaris, Anastasios G.; Urrutia, Jorge L. (1992). "The international crash of October 1987: causality tests". Journal of Financial and Quantitative Analysis. 27 (3): 353–364. doi:10.2307/2331324. JSTOR 2331324.CS1 maint: ref=harv (link)
- Miller, M; Hawke, J; Malkiel, B; Scholes, M (1989). Final report of the Committee of Inquiry appointed by the Chicago Mercantile Exchange to examine the events surrounding October 1987. The Black Monday and the Futures of Financial Markets (Report).CS1 maint: ref=harv (link)
- Mishkin, Frederic S. (August 17–19, 1988). Commentary on 'Causes of Changing Financial Market Volatility' (PDF). Symposium on Financial Market Volatility. Jackson Hole, Wyoming: The Federal Reserve Bank of Kansas City. pp. 23–32.CS1 maint: ref=harv (link)
- Reddell, Michael; Sleeman, Cath (2008). "Some perspectives on past recessions" (PDF). Reserve Bank of New Zealand Bulletin. 71 (2): 5–21.CS1 maint: ref=harv (link)
- Roberts, Richard (May 8, 2008). The City: A Guide to London's Global Financial Centre. John Wiley & Sons. ISBN 978-1-86197-858-5.CS1 maint: ref=harv (link)
- Roll, Richard (1988). "The international crash of October 1987". Financial Analysts Journal. 44 (5): 19–35. doi:10.2469/faj.v44.n5.19.CS1 maint: ref=harv (link)
- Schaede, Ulrike (1991). "Black Monday in New York, Blue Tuesday in Tokyo: The October 1987 Crash in Japan". California Management Review. 33 (2): 39–57. doi:10.2307/41166649. JSTOR 41166649.CS1 maint: ref=harv (link)
- Seyhun, H. Nejat (1990). "Overreaction or fundamentals: Some lessons from insiders' response to the market crash of 1987". The Journal of Finance. 45 (5): 1363–1388. doi:10.1111/j.1540-6261.1990.tb03719.x.CS1 maint: ref=harv (link)
- Shiller, Robert J. (1987). Investor Behavior in the October 1987 Stock Market Crash: Survey Evidence (PDF) (Technical report). NBER Working Paper Series. Cambridge, MA 02138: National Bureau of Economic Research. 2446.CS1 maint: location (link) CS1 maint: ref=harv (link)
- Shieber, Jonathan (March 16, 2020). "Stock markets halted for unprecedented third time due to coronavirus scare". TechCrunch. Retrieved March 16, 2020.CS1 maint: ref=harv (link)
- Shiller, Robert J. (1988). "Portfolio insurance and other investor fashions as factors in the 1987 stock market crash". NBER Macroeconomics Annual. 3: 287–297. doi:10.1086/654091.CS1 maint: ref=harv (link)
- Shleifer, Andrei; Summers, Lawrence H. (1990). "The noise trader approach to finance". Journal of Economic Perspectives. 4 (2): 19–33. doi:10.1257/jep.4.2.19.CS1 maint: ref=harv (link)
- United States Presidential Task Force on Market Mechanisms; Brady, Nicholas F. (1988). Report of the presidential task force on market mechanisms (Technical report). US Government Printing Office.
Further reading
- Securities and Exchange Commission (1988): The October 1987 Market Break. Washington: U.S. Securities and Exchange Commission (SEC).
- Robert Sobel Panic on Wall Street: A Classic History of America's Financial Disasters – With a New Exploration of the Crash of 1987 (E P Dutton; Reprint edition, May 1988) ISBN 0-525-48404-3.
- Greenspan, Alan (2008) [2007]. The Age of Turbulence: Adventures in a New World. New York: Penguin Books. pp. 104–110. ISBN 978-0143114161.
- Woodward, Bob (2000). Maestro: Greenspan's Fed and the American Boom. New York: Simon & Schuster. pp. 36–49. ISBN 978-0743204125.
External links
| Wikimedia Commons has media related to Black Monday (1987). |
| |||||||||||||||||||||||
| Banknotes |
|  | |||||||||||||||||||||
| Reports |
| ||||||||||||||||||||||
| Federal funds |
| ||||||||||||||||||||||
| History |
| ||||||||||||||||||||||
| Chairs |
| ||||||||||||||||||||||
| Current governors |
| ||||||||||||||||||||||
| Current presidents |
| ||||||||||||||||||||||