Walkability
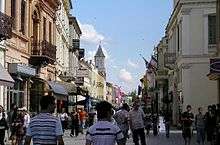
Walkability is a measure of how friendly an area is to walking. Walkability has health, environmental, and economic benefits.[1] Factors influencing walkability include the presence or absence and quality of footpaths, sidewalks or other pedestrian rights-of-way, traffic and road conditions, land use patterns, building accessibility, and safety, among others.[2] Walkability is an important concept in sustainable urban design.[3]
%2C_Montreal_2005-10-21.JPG)
Definitions
One proposed definition for walkability is: "The extent to which the built environment is friendly to the presence of people living, shopping, visiting, enjoying or spending time in an area".[4] Factors affecting walkability include, but are not limited to:
- Street connectivity
- Land use mix
- Residential density (residential units per area of residential use)
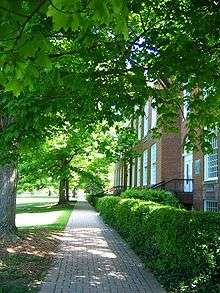
- Presence of trees and vegetation
- Frequency and variety of buildings
- Entrances and other sensations along street frontages
- Transparency, which includes amount of glass in windows and doors, orientation and proximity of homes, and buildings to watch over the street
- Plenty of places to go to near the majority of homes
- Placemaking, such as street designs that work for people, not just cars
- Retail floor area ratio[5]
Major infrastructural factors include access to mass transit, presence and quality of footpaths, buffers to moving traffic (planter strips, on-street parking or bike lanes) and pedestrian crossings, aesthetics, nearby local destinations, air quality, shade or sun in appropriate seasons, street furniture, traffic volume and speed.[2][6] and wind conditions.
Walkability is also examined based on the surrounding built environment. Reid Ewing and Robert Cervero's five D's of the built environment—density, diversity, design, destination accessibility, and distance to transit—heavily influence an area's walkability.[7] Combinations of these factors influence an individual's decision to walk.[8]
History
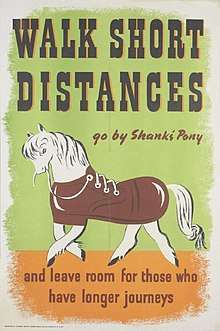
Before cars and bicycles were mass-produced, walking was the main way to travel. It was the only way to get from place to place for much of human history.[9] In the 1930s, economic growth led to increased automobile manufacturing. Cars were also becoming more affordable, leading to the rise of the automobile during the Post–World War II economic expansion.[10] The detrimental effects of automobile emissions soon led to public concern over pollution. Alternatives, including improved public transportation and walking infrastructure, have attracted more attention from planners and policymakers.
Benefits
Health
Walkability indices have been found to correlate with both Body Mass Index (BMI) and physical activity of local populations.[5][11] Physical activity can prevent chronic diseases, such as cardiovascular disease, diabetes, hypertension, obesity, depression, and osteoporosis.[12] Thus for instance, an increase in neighborhood Walk Score has linked with both better Cardio metabolic risk profiles[13] and a decreased risk of heart-attacks.[14] The World Cancer Research Fund and American Institute for Cancer Research released a report that new developments should be designed to encourage walking, on the grounds that walking contributes to a reduction of cancer.[15] A further justification for walkability is founded upon evolutionary and philosophical grounds, contending that gait is important to the cerebral development in humans.[16]
Due to discrepancies between residents' health in inner city neighborhoods and suburban neighborhoods with similar walkability measures, further research is needed to find additional built environment factors in walkability indices.[17]
Environmental

One of most important benefits of walkability is the decrease of the automobile footprint in the community. Carbon emissions can be reduced if more people choose to walk rather than drive or use public transportation. The benefits of less emissions include improved health conditions and quality of life, less smog, and less of a contribution to global climate change.
Socioeconomic
Walkability has also been found to have many socioeconomic benefits, including accessibility, cost savings both to individuals and to the public, student transport (which can include walking buses), increased efficiency of land use, increased livability, economic benefits from improved public health, and economic development, among others.[18] The benefits of walkability are best guaranteed if the entire system of public corridors is walkable - not limited to certain specialized routes. More sidewalks and increased walkability can promote tourism and increase property value.[19]
In recent years, the demand for housing in a walkable urban context has increased. The term "Missing Middle Housing" as coined by Daniel Parolek of Opticos Design, Inc.,[20] refers to multi-unit housing types (such as duplexes, fourplexes, bungalow courts, and mansion apartments not bigger than a large house), which are integrated throughout most walkable Pre-1940s neighborhoods, but became much less common after World War II, hence the term "missing." These housing types are often integrated into blocks with primarily single-family homes, to provide diverse housing choices and generate enough density to support transit and locally-serving commercial amenities.
Auto-focused street design diminishes walking and needed "eyes on the street"[21] provided by the steady presence of people in an area. Walkability increases social interaction, mixing of populations, the average number of friends and associates where people live, reduced crime (with more people walking and watching over neighborhoods, open space and main streets), increased sense of pride, and increased volunteerism.
Socioeconomic factors contribute to willingness to choose walking over driving. Income, age, race, ethnicity, education, household status, and having children in a household all influence walking travel.[22]
Increasing walkability
Many communities have embraced pedestrian mobility as an alternative to older building practices that favor automobiles. Reasons for this shift include a belief that dependency on automobiles is ecologically unsustainable. Automobile-oriented environments engender dangerous conditions to both motorists and pedestrians, and are generally bereft of aesthetics.[23] A tool that some American cities, like Cincinnati, OH, are employing to improve walkability is a type of zoning called Form-based coding.[24][25]
There are several ways to make a community more walkable:
- Sidewalks can be implemented where there are "sidewalk gaps", with priority to areas where walking is encouraged, such as around schools or transit stations. Campaigns such as Atlanta, Georgia's safe routes to transit are providing safer access to transit stops for pedestrians.[26] When implementing new sidewalks, there are several aspects to consider such as sidewalk width. The Americans with Disabilities Act (ADA) requires that sidewalks be at least five feet in width.[27]
- Moving obstructions, like sign posts and utility poles, can increase the walkable width of the sidewalk. Quality maintenance and proper lighting of sidewalks reduces obstructions, improves safety, and encourages walking.
- Buffers, areas of grass between the street and the sidewalk, also make sidewalks safer. Vegetation from buffers absorbs the carbon dioxide from automobile emissions and assists with water drainage.
- Improving crosswalk safety also increases walkability. Curb extensions decrease the radii of the corners of the curb at intersections, calm traffic and decrease the distance pedestrians have to cross. On streets with parking, curb extensions allow pedestrians to see oncoming traffic better where they otherwise would be forced to walk into the street to see past parked cars. Striped crosswalks, or zebra crossings, also provide safer crossings because they provide better visibility for both drivers and pedestrians.
- New infrastructure and pedestrian zones replace roads for better walkability. Cities undertake pedestrian projects for better traffic flow by closing automobile access and only allowing pedestrians to travel through. Projects such as the High Line and the 606 Trail increase walkability by connecting neighborhoods, using landscape architectural elements to create visually aesthetic green space, and allow for physical activity. Towns can also be modified to be pedestrian villages.
- Monitoring and improving safety in neighborhoods can make walking a more attractive option. Safety is a main concern among children when choosing how to get to and from school.[28] Ensuring safer walking areas by keeping paths well-maintained and well-lit can encourage walkability.
- Walkability increases with density. Density allows for the creation of affordable housing that is closer to an individuals workplace, and other basic needs. This encourages people to walk from place to place which increases their health, and decreases their carbon footprint.[29] Denser cities also create a higher chance for the creating social interactions with communities and social events.[30]
Measuring walkability
One way of assessing and measuring walkability is to undertake a walking audit. An established and widely used walking audit tool is PERS (Pedestrian Environment Review System) which has been used extensively in the UK.[31]
A simple way to determine the walkability of a block, corridor or neighborhood is to count the number of people walking, lingering and engaging in optional activities within a space.[32] This process is a vast improvement upon pedestrian level of service (LOS) indicators, recommended within the Highway Capacity Manual.[33] However it may not translate well to non-Western locations where the idea of "optional" activities may be different.[34] In any case, the diversity of people, and especially the presence of children, seniors and people with disabilities, denotes the quality, completeness and health of a walkable space.[35]
A number of commercial walkability scores also exist:
- Walk Score is a walkability index based on the distance to amenities such as grocery stores, schools, parks, libraries, restaurants, and coffee shops.[36] Walk Score's algorithm awards maximum points to amenities within 5 minutes' walk (.25 mi), and a decay function assigns points for amenities up to 30 minutes away.[37] Scores are normalized from 0 to 100.
- Walkability is a customizable set of three walk rating indexes with an algorithm that considers factors including street type, intersection complexity, point-of-interest accessibility, population density, freeways and bodies of water.[38] Add-on scores include other factors like crime, weather, or public transit, among others.
- Walkonomics is a web app that combines open data and crowdsourcing to rate and review the walkability of each street. As of 2011, Walkonomics claimed to have ratings for every street in England (over 600,000 streets) and New York City.[39]
- RateMyStreet is a website that uses crowdsourcing, Google Maps and a five star rating system to allow users to rate the walkability of their local streets. Users can rate a street using eight different categories: Crossing the street, pavement/sidewalk width, trip hazards, wayfinding, safety from crime, road safety, cleanliness/attractiveness, and disabled peoples' access.
- Walkability App developed by Clean Air Asia allows users to rate the walkability of a street qualitatively through 9 parameters. The individual scores are converted to a total out of 100. The average of all the street scores in a city becomes the city score. The parameters assessed include modal conflict, disability infrastructure, perception of safety, availability of crossing points, and motorist behavior, among others.
- State of Place is a predictive analytics software that forecasts the benefits of making places more walkable and livable and allows users to prioritize changes most likely to maximize their specific development goals. The algorithm aggregates over 290 urban design features into an index from 0-100, and breaks that down into individual scores for 10 urban design dimensions known to impact people’s location and consumption choices. The forecast helps cities and developers make the data-driven case for developing better places by quantifying their ROI. State of Place’s IP includes proprietary algorithms and forecasting models, as well as a growing database of 1.7 million data points and counting across 7000+ blocks.
Mapping walkability
A newly developing concept is the transit time map (sometimes called a transit shed map), which is a type of isochrone map.[40] These are maps (often online and interactive) that display the areas of a metropolis which can be reached from a given starting point, in a given amount of travel time. Such maps are useful for evaluating how well-connected a given address is to other possible urban destinations, or conversely, how large a territory can quickly get to a given address. The calculation of transit time maps is computationally intensive, and considerable work is being done on more efficient algorithms for quickly producing such maps. To be useful, the production of a transit time map must take into consideration detailed transit schedules, service frequency, time of day, and day of week.[41][42][43][44][45]
See also
References
- Walkability Is Good for You
- Online TDM Encyclopedia chapter on pedestrian improvements
- "S. Grignaffini, S. Cappellanti, A. Cefalo, "Visualizing sustainability in urban conditions", WIT Transactions on Ecology and the Environment, Vol. 1, pp. 253-262, 10 Jun 2008". Archived from the original on 23 February 2012. Retrieved 26 February 2009.
- Abley, Stephen. "Walkability Scoping Paper" 21 March 2005. Retrieved 4/21/08
- Frank; et al. (Winter 2006). "Many Pathways from Land Use to Health" (PDF). Journal of the American Planning Association. p. 77.
- Ramirez; et al. (December 2006). "Indicators of Activity-Friendly Communities: An Evidence-Based Consensus Process". American Journal of Preventive Medicine. pp. 515–24.
- Ewing, Reid and Cervero, Robert. "Travel and the Built Environment: A Meta-Analysis", Journal of the American Planning Association, vol 76, no 3 (2010): 265-294.
- Wang, Ke. "Causality Between Built Environment and Travel Behavior: Structural Equations Model Applied to Southern California." Transportation Research Record, no 2397 (2013): 80- 88.
- Rich, Nathaniel (April 23, 2015). "The History of a City Underfoot". The New York Times Magazine. The New York Times Company. Retrieved November 22, 2015.
- Hendee, Caitlin. "More on the cover story: A short history of walkable urbanism and transit-oriented development". Denver Business Journal.
- Frank; et al. (February 2005). "Linking objectively measured physical activity with objectively measured urban form: Findings from SMARTRAQ". American Journal of Preventive Medicine. pp. 117–25.
- Gase, Lauren N., Paul A. Simon, et al.. "Public Awareness of and Support for Infrastructure Changes Designed to Increase Walking and Biking in Los Angeles County." Preventive Medicine 72 (2015): 70-75.
- Méline, Julie; Chaix, Basile; Pannier, Bruno; Ogedegbe, Gbenga; Trasande, Leonardo; Athens, Jessica; Duncan, Dustin T. (2017-12-19). "Neighborhood walk score and selected Cardiometabolic factors in the French RECORD cohort study". BMC Public Health. 17 (1): 960. doi:10.1186/s12889-017-4962-8. ISSN 1471-2458. PMC 5735827. PMID 29258476.
- Mazumdar, Soumya; Learnihan, Vincent; Cochrane, Thomas; Phung, Hai; O'Connor, Bridget; Davey, Rachel (2016-12-01). "Is Walk Score associated with hospital admissions from chronic diseases? Evidence from a cross-sectional study in a high socioeconomic status Australian city-state". BMJ Open. 6 (12): e012548. doi:10.1136/bmjopen-2016-012548. ISSN 2044-6055. PMC 5168632. PMID 27932340.
- Miranda Hitti, "Report: Good Diet, Physical Activity, and Healthy Weight May Prevent 34% of 12 Common Cancers in the U.S.", WebMD Health News, Feb. 26, 2009.
- Stanford, Craig (2003) Upright: The Evolutionary Key to Becoming Human, Houghton-Mifflin: New York, pp. 122-171
- Lopez, Russel P. and H. Patricia Hynes (2006). "Obesity, physical activity, and the urban environment: public health research needs". Environmental Health: A Global Access Science Source. doi:10.1186/1476-069X-5-25.
- Todd Littman, "Economic Value of Walkability", Transportation Research Board of the National Academies, Vol. 1828, 2003., Litman, Todd Alexander (2004-10-12). "Economic Value of Walkability" (PDF). Victoria Transport Policy Institute.
- Parolek, Daniel. "Missing Middle Housing: Responding to the Demand for Walkable Urban Living". Opticos Design, Inc. Retrieved April 6, 2012.
- Jacobs, Jane (1961) The Death and Life of Great American Cities, p. 35
- Joh, Kenneth, Sandip Chakrabarti, Marlon G Boarnet, and Ayoung Woo. "The Walking Renaissance: A Longitudinal Analysis of Walking Travel in the Greater Los Angeles Area, USA." Sustainability 7, no. 7 (2015): 8985-9011.
- Zehner, Ozzie (2012). Green Illusions. Lincoln and London: University of Nebraska Press. pp. 263–300.
- "Cincinnati Form-Based Code". Form-Based Codes Institute.
- Yung, John. "Here's how Cincinnati's form-based codes are designed to spur redevelopment". Retrieved April 16, 2018.
- safe routes to transit
- "Accessible Rights-of-Way: A Design Guide," 1999
- Banerjee, Tridib et al. "Walking to School: The Experience of Children in Inner City Los Angeles and Implications for Policy." Journal of Planning Education and Research 34, no 2 (2014): 123-140.
- Robertson, Margaret (2014). Sustainability Principles and Practice. Routledge. pp. ppl: 208–222. ISBN 9780203768747.
- Mariana Darling, Emily (2017). Space for Community: Cohousing as an Alternative Density Model for Housing Seattle (PhD). University Of Washington.
- Davies, A. and Clark, S. (2009) Identifying and prioritising walking investment through the PERS audit tool - Walk21 Proceedings, 10th International Conference for Walking, New York, USA, October 2009
- Gehl, J. and Gemzoe, L. (1996). Public spaces and public life. Copenhagen: Danish Architectural Press
- Transportation Research Board (2000). Highway capacity manual: HCM2000. Washington D.C.: National Research Council
- Hutabarat Lo, R. (2009). "Walkability: what is it?", Journal of Urbanism Vol. 2, No. 2, pp 145-166.
- Zehner, Ozzie (2012). Green Illusions. Lincoln and London: University of Nebraska Press. pp. 250–51, 265–66.
- ceosforcities.org, Walking the Walk (2009)
- Walk Score Methodology
- http://www.maponics.com/products/gis-map-data/context/walkability
- Rating Walkability by combining Open Data and Crowdsourcing - Walkonomics Blog
- Dovey, K., Woodcock, I. & Pike, L. (2017) 'Isochrone Mapping of Urban Transport', Planning Practice & Research, 32(4): 402-416. doi: 10.1080/02697459.2017.1329487
- "Transit Time Map: Bay Area, 9:00am". Walk Score. Walk Score. Retrieved 25 February 2013.
- Wehrmeyer, Stefan. "Dynamic Public Transport Travel Time Maps". Mapnificent. Stefan Wehrmeyer. Retrieved 25 February 2013.
- Roth, Matthew. "Walk Score Updates Transit Travel Map for Bay Area". sf.streetsblog.org. streetsblog.org. Retrieved 25 February 2013.
- Walker, Jarrett. "Beyond "transit scores": an exchange with Matt Lerner". Human Transit. humantransit.org. Retrieved 25 February 2013.
- Wehrmeyer, Stefan (31 October 2010). "A Mapnificent World". On the Things I Do. stefanwehrmeyer.com. Retrieved 25 February 2013.
Further reading
- Dovey, Kim & Pafka, Elek (2019). "What is walkability? The urban DMA", Urban Studies.
- Leyden, Kevin M. (2003). "Social Capital and the Built Environment: The Importance of Walkable Neighborhoods." American Journal of Public Health. Volume 93: 1546-1551
- Speck, Jeff. (2012). Walkable City: How Downtown Can Save America, One Step at a Time. Macmillan.