van 't Hoff equation
The Van 't Hoff equation relates the change in the equilibrium constant, Keq, of a chemical reaction to the change in temperature, T, given the standard enthalpy change, ΔH⊖, for the process. It was proposed by Dutch chemist Jacobus Henricus van 't Hoff in 1884 in his book Études de dynamique chimique (Studies in Dynamic Chemistry).[1] This equation is sometimes also referred to as the Vukančić–Vuković equation.[2][3][4]
The van 't Hoff equation has been widely utilized to explore the changes in state functions in a thermodynamic system. The van 't Hoff plot, which is derived from this equation, is especially effective in estimating the change in enthalpy, or total energy, and entropy, or number of accessible microstates, of a chemical reaction.
Equation
Under standard conditions
Under standard conditions, the van 't Hoff equation is[5][6]

where ln denotes natural logarithm and R is the ideal gas constant. This equation is exact at any one temperature. In practice, the equation is often integrated between two temperatures under the assumption that the reaction enthalpy ΔH is constant. Since in reality ΔH and the reaction entropy ΔS do vary with temperature for most processes,[7] the integrated equation is only approximate.
A major use of the integrated equation is to estimate a new equilibrium constant at a new absolute temperature assuming a constant standard enthalpy change over the temperature range.
To obtain the integrated equation, it is convenient to first rewrite the van 't Hoff equation as[5]

The definite integral between temperatures T1 and T2 is then

In this equation K1 is the equilibrium constant at absolute temperature T1, and K2 is the equilibrium constant at absolute temperature T2.
Development from thermodynamics
Combining the definition of Gibbs free energy:

where S is the entropy of the system, and the Gibbs free energy isotherm equation:[8]

we obtain

Differentiation of this expression with respect to the variable T yields the van 't Hoff equation.
Provided that ΔH⊖ and ΔS⊖ are constant, the preceding equation gives ln K as a linear function of 1/T and hence is known as the linear form of the van 't Hoff equation. Therefore, when the range in temperature is small enough that the standard reaction enthalpy and reaction entropy are essentially constant, a plot of the natural logarithm of the equilibrium constant versus the reciprocal temperature gives a straight line. The slope of the line may be multiplied by the gas constant R to obtain the standard enthalpy change of the reaction, and the intercept may be multiplied by R to obtain the standard entropy change.
van 't Hoff isotherm
The Gibbs free energy changes with the temperature and pressure of the thermodynamic system. The van 't Hoff isotherm can be used to determine the Gibbs free energy for non-standard state reactions at a constant temperature:[9]

where ΔrG is the Gibbs free energy for the reaction, and Qr is the reaction quotient. When a reaction is at equilibrium, Qr = Keq. The van 't Hoff isotherm can help estimate the equilibrium reaction shift. When ΔrG < 0, the reaction moves in the forward direction. When ΔrG > 0, the reaction moves in the backwards directions. See Chemical equilibrium.
van 't Hoff plot
For a reversible reaction, the equilibrium constant can be measured at a variety of temperatures. This data can be plotted on a graph with ln Keq on the y-axis and 1/T on the x axis. The data should have a linear relationship, the equation for which can be found by fitting the data using the linear form of the van 't Hoff equation
This graph is called the van 't Hoff plot and is widely used to estimate the enthalpy and entropy of a chemical reaction. From this plot, −ΔH/R is the slope, and ΔS/R is the intercept of the linear fit.
By measuring the equilibrium constant, Keq, at different temperatures, the van 't Hoff plot can be used to assess a reaction when temperature changes.[10][11] Knowing the slope and intercept from the van 't Hoff plot, the enthalpy and entropy of a reaction can be easily obtained using

The van 't Hoff plot can be used to quickly determine the enthalpy of a chemical reaction both qualitatively and quantitatively. Change in enthalpy can be positive or negative, leading to two major forms of the van 't Hoff plot.
Endothermic reactions
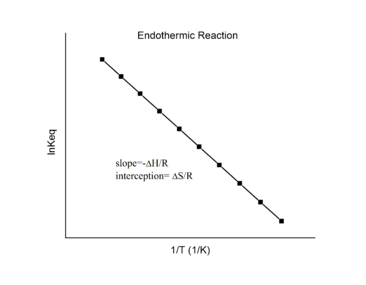
For an endothermic reaction, heat is absorbed, making the net enthalpy change positive. Thus, according to the definition of the slope:

for an endothermic reaction, ΔH > 0 (and the gas constant R > 0), so

Thus, for an endothermic reaction, the van 't Hoff plot should always have a negative slope.
Exothermic reactions
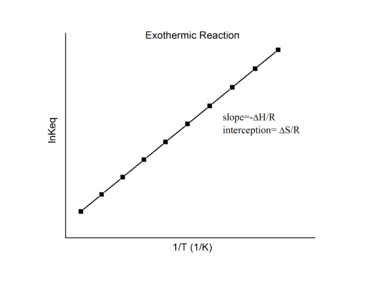
For an exothermic reaction, heat is released, making the net enthalpy change negative. Thus, according to the definition of the slope:
from an exothermic reaction, ΔH < 0, so

Thus, for an exothermic reaction, the van 't Hoff plot should always have a positive slope.
Error propagation
Using the fact that ΔG⊖ = −RT ln K = ΔH⊖ − TΔS⊖, it would appear that two measurements of K would suffice to be able to obtain a value of ΔH⊖:

where K1 and K2 are the equilibrium constant values obtained at temperatures T1 and T2 respectively. The precision of ΔH⊖ values obtained in this way is highly dependent on the precision of the equilibrium constant values. A typical pair of temperatures might be 25 and 35 °C (298 and 308 K). For these temperatures

Inserting this value into the expression for ΔH⊖:

Now, error propagation shows that the error on ΔH⊖ will be about 76 kJ/mol times the error on (ln K1 − ln K2), or about 110 kJ/mol times the error on the ln K values. Assume for example that the error on each ln K is σ ≈ 0.05, a small but reasonable value. The error on ΔH⊖ will be about 5 kJ/mol. So, even though the individual stability constants were determined with good precision, the enthalpy calculated in this way is subject to a significant error.
The entropy will then be obtained from ΔS⊖ = 1/T(ΔH⊖ + RT ln K). In this expression the error on the second term is negligible compared to the error on the first term. The magnifying factor is then 76 kJ/mol ÷ 298 K, so for an error of 0.05 in the logarithms the error on ΔS⊖ will be of the order of 17 J/(K mol).
When equilibrium constants are measured at three or more temperatures, values of ΔH⊖ will be obtained by straight-line fitting. In this case the error on the standard enthalpy will be magnified to a somewhat lesser, but still substantial, extent.
Applications of the van 't Hoff plot
van 't Hoff analysis
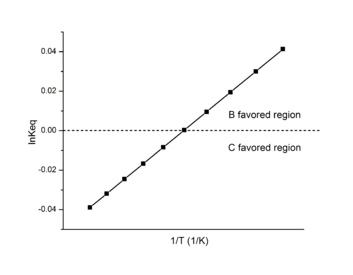
In biological research, the van 't Hoff plot is also called van 't Hoff analysis.[12] It is most effective in determining the favored product in a reaction.
Assume two products B and C form in a reaction:
- a A + d D → b B,
- a A + d D → c C.
In this case, Keq can be defined as ratio of B to C rather than the equilibrium constant.
When B/C > 1, B is the favored product, and the data on the van 't Hoff plot will be in the positive region.
When B/C < 1, C is the favored product, and the data on the van 't Hoff plot will be in the negative region.
Using this information, a van 't Hoff analysis can help determine the most suitable temperature for a favored product.
In 2010, a van 't Hoff analysis was used to determine whether water preferentially forms a hydrogen bond with the C-terminus or the N-terminus of the amino acid proline.[13] The equilibrium constant for each reaction was found at a variety of temperatures, and a van 't Hoff plot was created. This analysis showed that enthalpically, the water preferred to hydrogen bond to the C-terminus, but entropically it was more favorable to hydrogen bond with the N-terminus. Specifically, they found that C-terminus hydrogen bonding was favored by 4.2–6.4 kJ/mol. The N-terminus hydrogen bonding was favored by 31–43 J/(K mol).
This data alone could not conclude which site water will preferentially hydrogen-bond to, so additional experiments were used. It was determined that at lower temperatures, the enthalpically favored species, the water hydrogen-bonded to the C-terminus, was preferred. At higher temperatures, the entropically favored species, the water hydrogen-bonded to the N-terminus, was preferred.
Mechanistic studies
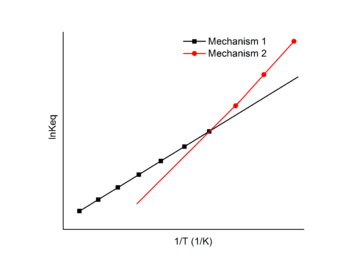
A chemical reaction may undergo different reaction mechanisms at different temperatures.[14]
In this case, a van 't Hoff plot with two or more linear fits may be exploited. Each linear fit has a different slope and intercept, which indicates different changes in enthalpy and entropy for each distinct mechanisms. The van 't Hoff plot can be used to find the enthalpy and entropy change for each mechanism and the favored mechanism under different temperatures.

In the example figure, the reaction undergoes mechanism 1 at high temperature and mechanism 2 at low temperature.
Temperature dependence

The van 't Hoff plot is linear based on the tacit assumption that the enthalpy and entropy are constant with temperature changes. However, in some cases the enthalpy and entropy do change dramatically with temperature. A first-order approximation is to assume that the two different reaction products have different heat capacities. Incorporating this assumption yields an additional term c/T2 in the expression for the equilibrium constant as a function of temperature. A polynomial fit can then be used to analyze data that exhibits a non-constant standard enthalpy of reaction:[15]

where

Thus, the enthalpy and entropy of a reaction can still be determined at specific temperatures even when a temperature dependence exists.
Surfactant self-assembly
The van 't Hoff relation is particularly useful for the determination of the micellization enthalpy ΔH⊖
m of surfactants from the temperature dependence of the critical micelle concentration (CMC):

However, the relation loses its validity when the aggregation number is also temperature-dependent, and the following relation should be used instead:[16]

with GN + 1 and GN being the free energies of the surfactant in a micelle with aggregation number N + 1 and N respectively. This effect is particularly relevant for nonionic ethoxylated surfactants[17] or polyoxypropylene–polyoxyethylene block copolymers (Poloxamers, Pluronics, Synperonics).[18] The extended equation can be exploited for the extraction of aggregation numbers of self-assembled micelles from differential scanning calorimetric thermograms.[19]
See also
References
- Biography on Nobel prize website. Nobelprize.org (1911-03-01). Retrieved on 2013-11-08.
- Journal on Modeling Prograde TiO2 Activity and its significance for Ti in Quartz Thermobarometry of Pelitic Metamorphic Rocks. Academia.edu. p. 2.
- Journal on Indirect spectrophotometric determination of folic acid based on the oxidation reaction and studying some of the thermodynamic parameters. Academia.edu. p. 67.
- PNAS Supporting Information Correction. (PNAS) Proceedings of the National Academy of Sciences of the United States of America. November 30, 2012. p. 3.
- Atkins, Peter; De Paula, Julio (10 March 2006). Physical Chemistry (8th ed.). W. H. Freeman and Company. p. 212. ISBN 978-0-7167-8759-4.
- Ives, D. J. G. (1971). Chemical Thermodynamics. University Chemistry. Macdonald Technical and Scientific. ISBN 978-0-356-03736-3.
- Craig, Norman (1996). "Entropy Diagrams". J. Chem. Educ. 73 (8): 710. Bibcode:1996JChEd..73..710C. doi:10.1021/ed073p710.
- Dickerson, R. E.; Geis, I. (1976). Chemistry, Matter, and the Universe. USA: W. A. Benjamin Inc. ISBN 978-0-19-855148-5.
- Monk, Paul (2004). Physical Chemistry: Understanding our Chemical World. Wiley. p. 162. ISBN 978-0471491811.
- Kim, Tae Woo (2012). "Dynamic [2]Catenation of Pd(II) Self-assembled Macrocycles in Water". Chem. Lett. 41: 70. doi:10.1246/cl.2012.70.
- Ichikawa, Takayuki (2010). "Thermodynamic properties of metal amides determined by ammonia pressure-composition isotherms" (PDF). J. Chem. Thermodynamics. 42: 140. doi:10.1016/j.jct.2009.07.024.
- "Van't Hoff Analysis". Protein Analysis and Design Group.
- Prell, James; Williams E. (2010). "Entropy Drives an Attached Water Molecule from the C- to N-Terminus on Protonated Proline". J. Am. Chem. Soc. 132 (42): 14733–5. doi:10.1021/ja106167d. PMID 20886878.
- Chatake, Toshiyuki (2010). "An Approach to DNA Crystallization Using the Thermal Reversible Process of DNA Duplexes". Cryst. Growth Des. 10 (3): 1090. doi:10.1021/cg9007075.
- David, Victor (28 April 2011). "Deviation from van't Hoff dependence in RP-LC induced by tautomeric interconversion observed for four compounds". Journal of Separation Science. 34 (12): 1423–8. doi:10.1002/jssc.201100029. PMID 21538875.
- Holtzer, Alfred; Holtzer, Marilyn F. (1 May 2002). "Use of the van't Hoff relation in determination of the enthalpy of micelle formation". The Journal of Physical Chemistry. 78 (14): 1442–1443. doi:10.1021/j100607a026.
- Heerklotz, Heiko; Tsamaloukas, Alekos; Kita-Tokarczyk, Katarzyna; Strunz, Pavel; Gutberlet, Thomas (25 November 2004). "Structural, Volumetric, and Thermodynamic Characterization of a Micellar Sphere-to-Rod Transition". Journal of the American Chemical Society. 126 (50): 16544–16552. doi:10.1021/ja045525w. PMID 15600359.
- Taboada, Pablo; Mosquera, Victor; Attwood, David; Yang, Zhuo; Booth, Colin (5 June 2003). "Enthalpy of micellisation of a diblock copoly(oxyethylene/oxypropylene) by isothermal titration calorimetry. Comparison with the van't Hoff value". Physical Chemistry Chemical Physics. 5 (12): 2625–2627. Bibcode:2003PCCP....5.2625T. doi:10.1039/b303108j.
- Chiappisi, Leonardo; Lazzara, Giuseppe; Gradzielski, Michael; Milioto, Stefana (6 December 2012). "Quantitative Description of Temperature Induced Self-Aggregation Thermograms Determined by Differential Scanning Calorimetry" (PDF). Langmuir. 28 (51): 17609–17616. doi:10.1021/la303599d. hdl:10447/96872. PMID 23171124.