Utah's 2nd congressional district
Utah's 2nd Congressional District currently serves Salt Lake City and the largely rural western and southern portions of Utah, including Saint George and Tooele. The current U.S. House Representative is Republican Chris Stewart.
| Utah's 2nd congressional district | |||
|---|---|---|---|
.tif.png) Utah's 2nd congressional district - since January 3, 2013. | |||
| Representative |
| ||
| Median income | $61,561[1] | ||
| Cook PVI | R+16[2] | ||
A map of current 2012 district boundaries can be found at the Utah Lieutenant Governor's office page: http://elections.utah.gov/map/district-maps.[3]
Voting
Election results from presidential races[4]
| Year | Office | Result |
|---|---|---|
| 2000 | President | Bush 67 - 31% |
| 2004 | President | Bush 66 - 31% |
| 2008 | President | McCain 57 - 39% |
| 2012 | President | Romney 68 - 29% |
| 2016 | President | Trump 46 - 32% |
List of members representing the district
District borders are periodically redrawn and some district residences may no longer be in the current 2nd district.
| Member | Party | Years | Cong ress |
District Home | Electoral history |
|---|---|---|---|---|---|
| District created March 4, 1913 | Districts were created from the former at-large district | ||||
 Jacob Johnson |
Republican | March 4, 1913 – March 3, 1915 |
63rd | Salt Lake City | Elected in 1912. Lost party renomination |
 James Henry Mays |
Democratic | March 4, 1915 – March 3, 1921 |
64th 65th 66th |
Salt Lake City | Elected in 1914. Retired. |
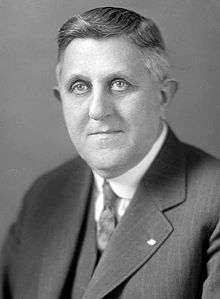 Elmer O. Leatherwood |
Republican | March 4, 1921 – December 24, 1929 |
67th 68th 69th 70th 71st |
Salt Lake City | Elected in 1920. Died. |
| Vacant | December 24, 1929 – November 4, 1930 |
71st | |||
| Frederick C. Loofbourow | Republican | November 4, 1930 – March 3, 1933 |
71st 72nd |
Salt Lake City | Elected to finish Leatherwood's term. Elected the same day to the next term. Lost re-election. |
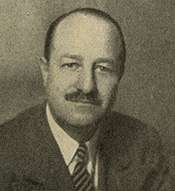
.jpg) J. W. Robinson |
Democratic | March 4, 1933 – January 3, 1947 |
73rd 74th 75th 76th 77th 78th 79th |
Salt Lake City | Elected in 1932. Lost re-election. |
 William A. Dawson |
Republican | January 3, 1947 – January 3, 1949 |
80th | Salt Lake City | Elected in 1946. Lost re-election. |
 Reva Beck Bosone |
Democratic | January 3, 1949 – January 3, 1953 |
81st 82nd |
Salt Lake City | Elected in 1948. Lost re-election. |
William A. Dawson |
Republican | January 3, 1953 – January 3, 1959 |
83rd 84th 85th |
Salt Lake City | Re-elected in 1952. Lost re-election |
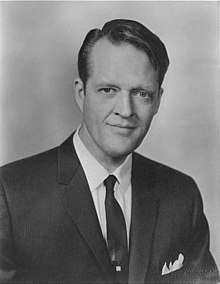 David S. King |
Democratic | January 3, 1959 – January 3, 1963 |
86th 87th |
Salt Lake City | Elected in 1958. Retired to run for U.S. Senator |
 Sherman P. Lloyd |
Republican | January 3, 1963 – January 3, 1965 |
88th | Salt Lake City | Elected in 1962. Retired to run for U.S. Senator |
David S. King |
Democratic | January 3, 1965 – January 3, 1967 |
89th | Salt Lake City | Re-elected in 1964. Lost re-election |
Sherman P. Lloyd |
Republican | January 3, 1967 – January 3, 1973 |
90th 91st 92nd |
Salt Lake City | Re-elected in 1966. Lost re-election. |
 Wayne Owens |
Democratic | January 3, 1973 – January 3, 1975 |
93rd | Salt Lake City | Elected in 1972. Retired to run for U.S. Senator |
 Allan Turner Howe |
Democratic | January 3, 1975 – January 3, 1977 |
94th | Salt Lake City | Elected in 1974. Lost re-election. |
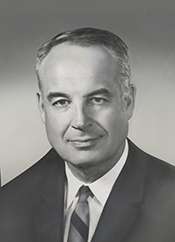
 David Daniel Marriott |
Republican | January 3, 1977 – January 3, 1985 |
95th 96th 97th 98th |
Salt Lake City | Elected in 1976. Retired to run for Governor of Utah. |
 David Smith Monson |
Republican | January 3, 1985 – January 3, 1987 |
99th | Salt Lake City | Elected in 1984. Retired. |
Wayne Owens |
Democratic | January 3, 1987 – January 3, 1993 |
100th 101st 102nd |
Salt Lake City | Re-elected in 1986. Retired to run for U.S. Senator. |
 Karen Shepherd |
Democratic | January 3, 1993 – January 3, 1995 |
103rd | Salt Lake City | Elected in 1992. Lost re-election. |
 Enid Greene |
Republican | January 3, 1995 – January 3, 1997 |
104th | Salt Lake City | Elected in 1994. Retired. |
 Merrill Cook |
Republican | January 3, 1997 – January 3, 2001 |
105th 106th |
Salt Lake City | Elected in 1996. Lost renomination. |
 Jim Matheson |
Democratic | January 3, 2001 – January 3, 2013 |
107th 108th 109th 110th 111th 112th |
Salt Lake City | Elected in 2000. Redistricted to the 4th district. |
 Chris Stewart |
Republican | January 3, 2013 – present |
113th 114th 115th 116th |
Farmington | Elected in 2012. |
Election results
|
1912 • 1914 • 1916 • 1918 • 1920 • 1922 • 1924 • 1926 • 1928 • 1930 (Special) • 1930 • 1932 • 1934 • 1936 • 1938 • 1940 • 1942 • 1944 • 1946 • 1948 • 1950 • 1952 • 1954 • 1956 • 1958 • 1960 • 1962 • 1964 • 1966 • 1968 • 1970 • 1972 • 1974 • 1976 • 1978 • 1980 • 1982 • 1984 • 1986 • 1988 • 1990 • 1992 • 1994 • 1996 • 1998 • 2000 • 2002 • 2004 • 2006 • 2008 • 2010 • 2012 • 2014 • 2016 • 2018 |
1912
Note: The 1912 election consisted of an all-party election to the two at-large seats. Howell was elected to the first at-large seat, while Johnson was elected to the second at-large seat.
| Party | Candidate | Votes | % | ||
|---|---|---|---|---|---|
| Republican | Joseph Howell | 43,133 | 19.45 | ||
| Republican | Jacob Johnson | 42,047 | 18.96 | ||
| Democratic | Mathonihah Thomas | 37,192 | 16.77 | ||
| Democratic | Tollman D. Johnson | 36,640 | 16.52 | ||
| Progressive | S.H. Love | 22,358 | 10.08 | ||
| Progressive | Lewis Larson | 21,934 | 9.89 | ||
| Socialist | Murray E. King | 8,971 | 4.05 | ||
| Socialist | William M. Knerr | 8,953 | 4.04 | ||
| Socialist Labor | Elias Anderson | 505 | 0.23 | ||
| Total votes | 221,733 | 100.0 | |||
| Republican win (new seat) | |||||
1914
| Party | Candidate | Votes | % | |||
|---|---|---|---|---|---|---|
| Democratic | James Henry Mays | 25,617 | 47.49 | |||
| Republican | Elmer O. Leatherwood | 25,459 | 47.20 | |||
| Socialist | A.H. Kempton | 2,861 | 5.31 | |||
| Total votes | 53,937 | 100.0 | ||||
| Democratic gain from Republican | ||||||
1916
| Party | Candidate | Votes | % | |
|---|---|---|---|---|
| Democratic | James Henry Mays (incumbent) | 39,847 | 56.87 | |
| Republican | Charles R. Mabey | 27,778 | 39.65 | |
| Socialist | Murray E. King | 2,440 | 3.48 | |
| Total votes | 70,065 | 100.0 | ||
| Democratic hold | ||||
1918
| Party | Candidate | Votes | % | |
|---|---|---|---|---|
| Democratic | James Henry Mays (incumbent) | 23,931 | 58.68 | |
| Republican | William Spry | 16,134 | 39.56 | |
| Socialist | A.H. Kempton | 719 | 1.76 | |
| Total votes | 40,784 | 100.0 | ||
| Democratic hold | ||||
1920
| Party | Candidate | Votes | % | |||
|---|---|---|---|---|---|---|
| Republican | Elmer O. Leatherwood | 39,239 | 54.82 | |||
| Democratic | Mathonihah Thomas | 28,201 | 39.40 | |||
| Farmer–Labor | Marvin P. Bales | 2,437 | 3.40 | |||
| Socialist | C.T. Stoney | 1,696 | 2.38 | |||
| Total votes | 71,573 | 100.0 | ||||
| Republican gain from Democratic | ||||||
1922
| Party | Candidate | Votes | % | |
|---|---|---|---|---|
| Republican | Elmer O. Leatherwood (incumbent) | 28,591 | 50.43 | |
| Democratic | David C. Dunbar | 26,145 | 46.12 | |
| Farmer–Labor | E. G. Locke | 1,959 | 3.45 | |
| Total votes | 56,695 | 100.0 | ||
| Republican hold | ||||
1924
| Party | Candidate | Votes | % | |
|---|---|---|---|---|
| Republican | Elmer O. Leatherwood (incumbent) | 41,888 | 56.66 | |
| Democratic | James H. Waters | 32,045 | 43.34 | |
| Total votes | 73,933 | 100.0 | ||
| Republican hold | ||||
1926
| Party | Candidate | Votes | % | |
|---|---|---|---|---|
| Republican | Elmer O. Leatherwood (incumbent) | 42,073 | 60.18 | |
| Democratic | William R. Wallace, Jr. | 27,006 | 38.63 | |
| Socialist | Otto E. Parsons | 835 | 1.19 | |
| Total votes | 69,914 | 100.0 | ||
| Republican hold | ||||
1928
| Party | Candidate | Votes | % | |
|---|---|---|---|---|
| Republican | Elmer O. Leatherwood (incumbent) | 46,866 | 50.22 | |
| Democratic | Joshua H. Paul | 46,025 | 49.31 | |
| Socialist | T. F. Eynon | 439 | 0.47 | |
| Total votes | 93,330 | 100.0 | ||
| Republican hold | ||||
1930 (Special)
| Party | Candidate | Votes | % | |
|---|---|---|---|---|
| Republican | Frederick C. Loofbourow | 35,349 | 44.13 | |
| Democratic | Joshua H. Paul | 33,915 | 42.34 | |
| Liberty | George N. Lawrence | 10,591 | 13.22 | |
| Socialist | Otto E. Parsons | 253 | 0.32 | |
| Total votes | 80,108 | 100.0 | ||
| Republican hold | ||||
1930
| Party | Candidate | Votes | % | |
|---|---|---|---|---|
| Republican | Frederick C. Loofbourow | 35,106 | 44.29 | |
| Democratic | Joshua H. Paul | 33,618 | 42.41 | |
| Liberty | George N. Lawrence | 10,303 | 13.00 | |
| Socialist | Otto E. Parsons | 239 | 0.30 | |
| Total votes | 79,266 | 100.0 | ||
| Republican hold | ||||
1932
| Party | Candidate | Votes | % | |||
|---|---|---|---|---|---|---|
| Democratic | J. W. Robinson | 62,400 | 57.08 | |||
| Republican | Frederick C. Loofbourow (incumbent) | 46,919 | 42.92 | |||
| Total votes | 109,319 | 100.0 | ||||
| Democratic gain from Republican | ||||||
1934
| Party | Candidate | Votes | % | |
|---|---|---|---|---|
| Democratic | J. W. Robinson (incumbent) | 58,175 | 62.30 | |
| Republican | Frederick C. Loofbourow | 34,007 | 36.42 | |
| Communist | Carl Bjork | 788 | 0.84 | |
| Socialist | A. L. Porter | 405 | 0.43 | |
| Total votes | 93,375 | 100.0 | ||
| Democratic hold | ||||
1936
| Party | Candidate | Votes | % | |
|---|---|---|---|---|
| Democratic | J. W. Robinson (incumbent) | 81,119 | 69.75 | |
| Republican | A. V. Watkins | 34,855 | 29.97 | |
| Socialist | Joseph L. Hansen | 318 | 0.28 | |
| Total votes | 116,292 | 100.0 | ||
| Democratic hold | ||||
1938
| Party | Candidate | Votes | % | |
|---|---|---|---|---|
| Democratic | J. W. Robinson (incumbent) | 58,456 | 62.31 | |
| Republican | Dean F. Brayton | 35,359 | 37.69 | |
| Total votes | 93,815 | 100.0 | ||
| Democratic hold | ||||
1940
| Party | Candidate | Votes | % | |
|---|---|---|---|---|
| Democratic | J. W. Robinson (incumbent) | 86,874 | 63.32 | |
| Republican | A. Sherman Christenson | 50,332 | 36.68 | |
| Total votes | 137,206 | 100.0 | ||
| Democratic hold | ||||
1942
| Party | Candidate | Votes | % | |
|---|---|---|---|---|
| Democratic | J. W. Robinson (incumbent) | 43,582 | 55.75 | |
| Republican | Reed E. Vetterli | 34,586 | 44.25 | |
| Total votes | 78,168 | 100.0 | ||
| Democratic hold | ||||
1944
| Party | Candidate | Votes | % | |
|---|---|---|---|---|
| Democratic | J. W. Robinson (incumbent) | 89,844 | 62.27 | |
| Republican | Quayle Cannon, Jr. | 54,440 | 37.73 | |
| Total votes | 144,284 | 100.0 | ||
| Democratic hold | ||||
1946
| Party | Candidate | Votes | % | |||
|---|---|---|---|---|---|---|
| Republican | William A. Dawson | 56,402 | 52.71 | |||
| Democratic | J. W. Robinson (incumbent) | 50,598 | 47.29 | |||
| Total votes | 107,000 | 100.0 | ||||
| Republican gain from Democratic | ||||||
1948
| Party | Candidate | Votes | % | |||
|---|---|---|---|---|---|---|
| Democratic | Reva Beck Bosone | 92,770 | 57.46 | |||
| Republican | William A. Dawson (incumbent) | 68,693 | 42.54 | |||
| Total votes | 161,463 | 100.0 | ||||
| Democratic gain from Republican | ||||||
1950
| Party | Candidate | Votes | % | |
|---|---|---|---|---|
| Democratic | Reva Beck Bosone (incumbent) | 84,283 | 53.40 | |
| Republican | Ivy Baker Priest | 73,535 | 46.60 | |
| Total votes | 157,818 | 100.0 | ||
| Democratic hold | ||||
1952
| Party | Candidate | Votes | % | |||
|---|---|---|---|---|---|---|
| Republican | William A. Dawson | 105,296 | 52.55 | |||
| Democratic | Reva Beck Bosone (incumbent) | 95,084 | 47.45 | |||
| Total votes | 200,380 | 100.0 | ||||
| Republican gain from Democratic | ||||||
1954
| Party | Candidate | Votes | % | |
|---|---|---|---|---|
| Republican | William A. Dawson (incumbent) | 90,864 | 57.16 | |
| Democratic | Reva Beck Bosone | 68,090 | 42.84 | |
| Total votes | 158,954 | 100.0 | ||
| Republican hold | ||||
1956
| Party | Candidate | Votes | % | |
|---|---|---|---|---|
| Republican | William A. Dawson (incumbent) | 119,683 | 57.64 | |
| Democratic | Oscar W. McConkie, Jr. | 87,970 | 42.36 | |
| Total votes | 207,653 | 100.0 | ||
| Republican hold | ||||
1958
| Party | Candidate | Votes | % | |||
|---|---|---|---|---|---|---|
| Democratic | David S. King | 91,213 | 51.11 | |||
| Republican | William A. Dawson (incumbent) | 87,234 | 48.89 | |||
| Total votes | 178,447 | 100.0 | ||||
| Democratic gain from Republican | ||||||
1960
| Party | Candidate | Votes | % | |
|---|---|---|---|---|
| Democratic | David S. King (incumbent) | 120,771 | 50.82 | |
| Republican | Sherman P. Lloyd | 116,881 | 49.18 | |
| Total votes | 237,652 | 100.0 | ||
| Democratic hold | ||||
1962
| Party | Candidate | Votes | % | |||
|---|---|---|---|---|---|---|
| Republican | Sherman P. Lloyd | 108,385 | 53.92 | |||
| Democratic | Bruce Sterling Jenkins | 92,631 | 46.08 | |||
| Total votes | 201,016 | 100.0 | ||||
| Republican gain from Democratic | ||||||
1964
| Party | Candidate | Votes | % | |||
|---|---|---|---|---|---|---|
| Democratic | David S. King | 149,754 | 57.54 | |||
| Republican | Thomas G. Judd | 110,512 | 42.46 | |||
| Total votes | 260,266 | 100.0 | ||||
| Democratic gain from Republican | ||||||
1966
| Party | Candidate | Votes | % | |||
|---|---|---|---|---|---|---|
| Republican | Sherman P. Lloyd | 96,426 | 61.25 | |||
| Democratic | David S. King (incumbent) | 61,001 | 38.75 | |||
| Total votes | 157,427 | 100.0 | ||||
| Republican gain from Democratic | ||||||
1968
| Party | Candidate | Votes | % | |
|---|---|---|---|---|
| Republican | Sherman P. Lloyd (incumbent) | 130,127 | 61.65 | |
| Democratic | Galen J. Ross | 80,948 | 38.35 | |
| Total votes | 211,075 | 100.0 | ||
| Republican hold | ||||
1970
| Party | Candidate | Votes | % | |
|---|---|---|---|---|
| Republican | Sherman P. Lloyd (incumbent) | 97,549 | 52.27 | |
| Democratic | Adolph Herman Nance | 87,000 | 46.61 | |
| American Independent | Stephen D. Marsh | 2,094 | 1.12 | |
| Total votes | 186,643 | 100.0 | ||
| Republican hold | ||||
1972
| Party | Candidate | Votes | % | |||
|---|---|---|---|---|---|---|
| Democratic | Wayne Owens | 132,832 | 48.89 | |||
| Republican | Sherman P. Lloyd (incumbent) | 107,185 | 39.45 | |||
| American | Bruce R. Bangerter | 31,685 | 11.66 | |||
| Total votes | 271,702 | 100.0 | ||||
| Democratic gain from Republican | ||||||
1974
| Party | Candidate | Votes | % | |
|---|---|---|---|---|
| Democratic | Allan Howe | 105,739 | 49.48 | |
| Republican | Stephen Harmsen | 100,259 | 46.92 | |
| American | Roben J. Schafer | 6,482 | 3.03 | |
| Libertarian | Karl J. Bray | 1,218 | 0.57 | |
| Total votes | 213,698 | 100.0 | ||
| Democratic hold | ||||
1976
| Party | Candidate | Votes | % | |||
|---|---|---|---|---|---|---|
| Republican | David Daniel Marriott | 144,861 | 52.43 | |||
| Democratic | Allan Howe (incumbent) | 110,931 | 40.15 | |||
| Independent | Darrell McCarty (as a write-in) | 20,508 | 7.42 | |||
| Total votes | 276,300 | 100.0 | ||||
| Republican gain from Democratic | ||||||
1978
| Party | Candidate | Votes | % | |
|---|---|---|---|---|
| Republican | David Daniel Marriott (incumbent) | 121,492 | 62.26 | |
| Democratic | Edwin Brown Firmage | 68,899 | 35.30 | |
| American Independent | Lawrence Rey Tophman | 1,940 | 0.99 | |
| Independent | Bruce Bangerter | 1,512 | 0.77 | |
| Independent | William C. Hoyle | 1,323 | 0.68 | |
| Total votes | 195,166 | 100.0 | ||
| Republican hold | ||||
1980
| Party | Candidate | Votes | % | |
|---|---|---|---|---|
| Republican | David Daniel Marriott (incumbent) | 194,885 | 67.02 | |
| Democratic | Arthur L. Monson | 87,967 | 30.25 | |
| Independent | Stan Larsen | 5,411 | 1.86 | |
| American | Steven Ray Montgomery | 1,520 | 0.52 | |
| Socialist Workers | David P. Hurst | 982 | 0.34 | |
| Total votes | 290,765 | 100.0 | ||
| Republican hold | ||||
1982
| Party | Candidate | Votes | % | |
|---|---|---|---|---|
| Republican | David Daniel Marriott (incumbent) | 92,109 | 53.84 | |
| Democratic | Frances Farley | 78,981 | 46.16 | |
| Total votes | 171,090 | 100.0 | ||
| Republican hold | ||||
1984
| Party | Candidate | Votes | % | |
|---|---|---|---|---|
| Republican | David Smith Monson | 105,540 | 49.37 | |
| Democratic | Frances Farley | 105,044 | 49.13 | |
| Libertarian | Hugh A. Butler | 1,456 | 0.68 | |
| Independent | James Waters | 962 | 0.45 | |
| American | Maryellen Gardner | 791 | 0.37 | |
| Total votes | 213,793 | 100.0 | ||
| Republican hold | ||||
1986
| Party | Candidate | Votes | % | |||
|---|---|---|---|---|---|---|
| Democratic | Wayne Owens | 76,921 | 55.18 | |||
| Republican | M. Tom Shimizu | 60,967 | 43.74 | |||
| Libertarian | Stephen Carmichael Carr | 1,302 | 0.93 | |||
| Socialist Workers | Scott Alan Breen | 200 | 0.14 | |||
| Total votes | 139,390 | 100.0 | ||||
| Democratic gain from Republican | ||||||
1988
| Party | Candidate | Votes | % | |
|---|---|---|---|---|
| Democratic | Wayne Owens (incumbent) | 112,129 | 57.40 | |
| Republican | Richard Snelgrove | 80,212 | 41.06 | |
| Libertarian | Michael Lee | 2,997 | 1.54 | |
| Total votes | 195,338 | 100.0 | ||
| Democratic hold | ||||
1990
| Party | Candidate | Votes | % | |
|---|---|---|---|---|
| Democratic | Wayne Owens (incumbent) | 85,167 | 57.60 | |
| Republican | Genevieve Atwood | 58,869 | 39.81 | |
| Independent | Lawrence Rey Topham | 3,424 | 2.31 | |
| Socialist Workers | Eleanor Garcia | 411 | 0.28 | |
| Total votes | 147,871 | 100.0 | ||
| Democratic hold | ||||
1992
| Party | Candidate | Votes | % | |
|---|---|---|---|---|
| Democratic | Karen Shepherd | 127,738 | 50.50 | |
| Republican | Enid Greene | 118,037 | 46.66 | |
| Independent | A. Peter Crane | 6,274 | 2.48 | |
| Socialist Workers | Eileen Koschak | 650 | 0.26 | |
| Total votes | 252,969 | 100.0 | ||
| Democratic hold | ||||
1994
| Party | Candidate | Votes | % | |||
|---|---|---|---|---|---|---|
| Republican | Enid Greene | 85,507 | 45.83 | |||
| Democratic | Karen Shepherd (incumbent) | 66,911 | 35.86 | |||
| Independent | Merrill Cook | 34,167 | 18.31 | |||
| Total votes | 186,585 | 100.0 | ||||
| Republican gain from Democratic | ||||||
1996
| Party | Candidate | Votes | % | |
|---|---|---|---|---|
| Republican | Merrill Cook | 129,963 | 54.99 | |
| Democratic | Rocky Anderson | 100,283 | 42.44 | |
| Independent American | Arly H. Pedersen | 3,070 | 1.30 | |
| Natural Law | Catherine Carter | 2,981 | 1.26 | |
| Write-in | 24 | 0.01 | ||
| Total votes | 236,321 | 100.0 | ||
| Republican hold | ||||
1998
| Party | Candidate | Votes | % | |
|---|---|---|---|---|
| Republican | Merrill Cook (incumbent) | 93,718 | 52.76 | |
| Democratic | Lily Eskelsen | 77,198 | 43.46 | |
| Independent | Ken Larsen | 3,998 | 2.25 | |
| Libertarian | Brian E. Swim | 1,390 | 0.78 | |
| Independent American | Arly H. Pedersen | 813 | 0.46 | |
| Natural Law | Robert C. Lesh | 524 | 0.29 | |
| Total votes | 177,641 | 100.0 | ||
| Republican hold | ||||
2000
| Party | Candidate | Votes | % | |||
|---|---|---|---|---|---|---|
| Democratic | Jim Matheson | 145,021 | 55.86 | |||
| Republican | Derek W. Smith | 107,114 | 41.26 | |||
| Independent American | Bruce Bangerter | 4,704 | 1.81 | |||
| Libertarian | Peter Pixton | 2,165 | 0.83 | |||
| Independent | Steven Alberts Voris | 597 | 0.23 | |||
| Total votes | 259,601 | 100.0 | ||||
| Democratic gain from Republican | ||||||
2002
| Party | Candidate | Votes | % | |
|---|---|---|---|---|
| Democratic | Jim Matheson (incumbent) | 110,764 | 49.43 | |
| Republican | John Swallow | 109,123 | 48.69 | |
| Green | Patrick S. Diehl | 2,589 | 1.16 | |
| Libertarian | Ron Copier | 1,622 | 0.72 | |
| Total votes | 224,098 | 100.0 | ||
| Democratic hold | ||||
2004
| Party | Candidate | Votes | % | |
|---|---|---|---|---|
| Democratic | Jim Matheson (incumbent) | 187,250 | 54.76 | |
| Republican | John Swallow | 147,778 | 43.21 | |
| Constitution | Jeremy Paul Petersen | 3,541 | 1.04 | |
| Green | Patrick S. Diehl | 2,189 | 0.64 | |
| Personal Choice | Ronald R. Amos | 1,210 | 0.35 | |
| Total votes | 341,968 | 100.0 | ||
| Democratic hold | ||||
2006
| Party | Candidate | Votes | % | |
|---|---|---|---|---|
| Democratic | Jim Matheson (incumbent) | 133,231 | 59.00 | |
| Republican | LaVar Christensen | 84,234 | 37.30 | |
| Constitution | W. David Perry | 3,395 | 1.50 | |
| Green | Bob Brister | 3,338 | 1.48 | |
| Libertarian | Austin Sherwood Lett | 1,620 | 0.72 | |
| Total votes | 225,818 | 100.0 | ||
| Democratic hold | ||||
2008
| Party | Candidate | Votes | % | |
|---|---|---|---|---|
| Democratic | Jim Matheson (incumbent) | 220,666 | 63.36 | |
| Republican | Bill Dew | 120,083 | 34.47 | |
| Libertarian | Matthew Arndt | 4,576 | 1.31 | |
| Constitution | Dennis Ray Emery | 3,000 | 0.86 | |
| Total votes | 348,325 | 100.0 | ||
| Democratic hold | ||||
2010
| Party | Candidate | Votes | % | |
|---|---|---|---|---|
| Democratic | Jim Matheson (incumbent) | 127,151 | 50.49 | |
| Republican | Morgan Philpot | 116,001 | 46.06 | |
| Constitution | Randall Hinton | 4,578 | 1.82 | |
| Independent | Dave Glissmeyer | 2,391 | 0.95 | |
| Independent | Wayne L. Hill | 1,726 | 0.69 | |
| Total votes | 251,847 | 100.0 | ||
| Democratic hold | ||||
2012
| Party | Candidate | Votes | % | |||
|---|---|---|---|---|---|---|
| Republican | Chris Stewart | 154,523 | 62.17 | |||
| Democratic | Jay Seegmiller | 83,176 | 33.47 | |||
| Constitution | Jonathan D. Garrard | 5,051 | 2.03 | |||
| Independent | Joseph Andrade | 2,971 | 1.20 | |||
| Independent | Charles E. Kimball | 2,824 | 1.14 | |||
| Total votes | 248,545 | 100.0 | ||||
| Republican gain from Democratic | ||||||
2014
| Party | Candidate | Votes | % | |
|---|---|---|---|---|
| Republican | Chris Stewart (incumbent) | 88,915 | 60.82 | |
| Democratic | Luz Robles | 47,585 | 32.55 | |
| Constitution | Shaun McCausland | 4,509 | 3.08 | |
| Independent American | Wayne L. Hill | 3,328 | 2.28 | |
| Independent | Bill Barron | 1,734 | 1.19 | |
| Write-in | Warren Rogers | 117 | 0.08 | |
| Total votes | 146,188 | 100.0 | ||
| Republican hold | ||||
2016
| Party | Candidate | Votes | % | |
|---|---|---|---|---|
| Republican | Chris Stewart (incumbent) | 170,524 | 61.60 | |
| Democratic | Charlene Albarran | 93,778 | 33.88 | |
| Constitution | Paul J. McCollaum, Jr. | 12,517 | 4.52 | |
| Total votes | 276,819 | 100.0 | ||
| Republican hold | ||||
2018
| Party | Candidate | Votes | % | |
|---|---|---|---|---|
| Republican | Chris Stewart (incumbent) | 151,489 | 56.10 | |
| Democratic | Shireen Ghorbani | 105,051 | 38.90 | |
| Libertarian | Jeffrey Whipple | 13,504 | 5.00 | |
| Total votes | 270,044 | 100.0 | ||
| Republican hold | ||||
Historical district boundaries
References
- Martis, Kenneth C. (1989). The Historical Atlas of Political Parties in the United States Congress. New York: Macmillan Publishing Company.
- Martis, Kenneth C. (1982). The Historical Atlas of United States Congressional Districts. New York: Macmillan Publishing Company.
- Congressional Biographical Directory of the United States 1774–present
- https://www.census.gov/mycd/?st=49&cd=02
- "Partisan Voting Index – Districts of the 115th Congress" (PDF). The Cook Political Report. April 7, 2017. Retrieved April 7, 2017.
- "District Map of Congressional Voting Districts for Utah". Utah.gov. Retrieved 2012-09-2012. Check date values in:
|accessdate=(help) - Presidential Election Results, by district, swingstateproject.com
- 1912 Election Results
- 1914 Election Results
- 1916 Election Results
- 1918 Election Results
- 1920 Election Results
- 1922 Election Results
- 1924 Election Results
- 1926 Election Results
- 1928 Election Results
- 1930 Special Election Results
- 1930 Election Results
- 1932 Election Results
- 1934 Election Results
- 1936 Election Results
- 1938 Election Results
- 1940 Election Results
- 1942 Election Results
- 1944 Election Results
- 1946 Election Results
- 1948 Election Results
- 1950 Election Results
- 1952 Election Results
- 1954 Election Results
- 1956 Election Results
- 1958 Election Results
- 1960 Election Results
- 1962 Election Results
- 1964 Election Results
- 1966 Election Results
- 1968 Election Results
- 1970 Election Results
- 1972 Election Results
- 1974 Election Results
- 1976 Election Results
- 1978 Election Results
- 1980 Election Results
- 1982 Election Results
- 1984 Election Results
- 1986 Election Results
- 1988 Election Results
- 1990 Election Results
- 1992 Election Results
- 1994 Election Results
- 1996 Election Results
- 1998 Election Results
- 2000 Election Results
- 2002 Election Results
- 2004 Election Results
- 2006 Election Results
- 2008 Election Results
- 2010 Election Results
- 2012 Election Results
- 2014 Election Results
- 2016 Election Results
- 2018 Election Results