Ternary plot
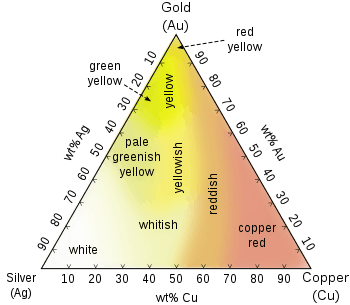
A ternary plot, ternary graph, triangle plot, simplex plot, Gibbs triangle or de Finetti diagram is a barycentric plot on three variables which sum to a constant. It graphically depicts the ratios of the three variables as positions in an equilateral triangle. It is used in physical chemistry, petrology, mineralogy, metallurgy, and other physical sciences to show the compositions of systems composed of three species. In population genetics, it is often called a de Finetti diagram. In game theory, it is often called a simplex plot.[1] Ternary plots are tools for analyzing compositional data in the three-dimensional case.
In a ternary plot, the values of the three variables a, b, and c must sum to some constant, K. Usually, this constant is represented as 1.0 or 100%. Because a + b + c = K for all substances being graphed, any one variable is not independent of the others, so only two variables must be known to find a sample's point on the graph: for instance, c must be equal to K − a − b. Because the three numerical values cannot vary independently—there are only two degrees of freedom—it is possible to graph the combinations of all three variables in only two dimensions.
Reading values on the ternary plot
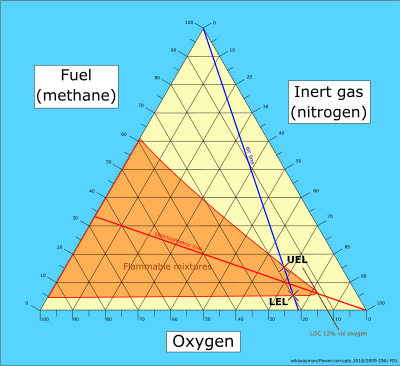
The advantage of using a ternary plot for depicting chemical compositions is that three variables can be conveniently plotted in a two-dimensional graph. Ternary plots can also be used to create phase diagrams by outlining the composition regions on the plot where different phases exist.
Every point on a ternary plot represents a different composition of the three components.
A parallel to a side of the triangle is the locus of points representing systems with constant chemical composition in the component situated in the vertex opposed to the side.
There are three common methods used to determine the ratios of the three species in the composition.
The first method is an estimation based upon the phase diagram grid. The concentration of each species is 100% (pure phase) in each corner of the triangle and 0% at the line opposite it. The percentage of a specific species decreases linearly with increasing distance from this corner, as seen in figures 3–8. By drawing parallel lines at regular intervals between the zero line and the corner (as seen in the images), fine divisions can be established for easy estimation of the content of a species. For a given point, the fraction of each of the three materials in the composition can be determined by the first.
For phase diagrams that do not possess grid lines, the easiest way to determine the composition is to set the altitude of the triangle to 100% and determine the shortest distances from the point of interest to each of the three sides. By Viviani's theorem, the distances (the ratios of the distances to the total height of 100%) give the content of each of the species, as shown in figure 1.
The third method is based upon a larger number of measurements, but does not require the drawing of perpendicular lines. Straight lines are drawn from each corner, through the point of interest, to the opposite side of the triangle. The lengths of these lines, as well as the lengths of the segments between the point and the corresponding sides, are measured individually. Ratios can then be determined by dividing these segments by the entire corresponding line as shown in the figure 2. (The sum of the ratios should add to 1).
 Figure 1. Altitude method
 Figure 2. Intersection method
 Figure 3. An example ternary diagram, without any points plotted.
 Figure 4. An example ternary diagram, showing increments along the first axis.
 Figure 5. An example ternary diagram, showing increments along the second axis.
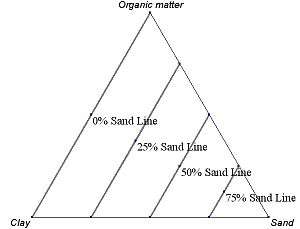 Figure 6. An example ternary diagram, showing increments along the third axis.
 Figure 7. Empty ternary plot
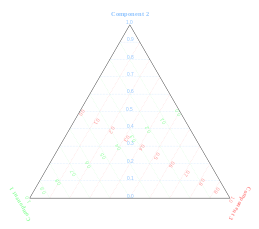 Figure 8. Indication of how the three axes work.
Derivation from Cartesian coordinates
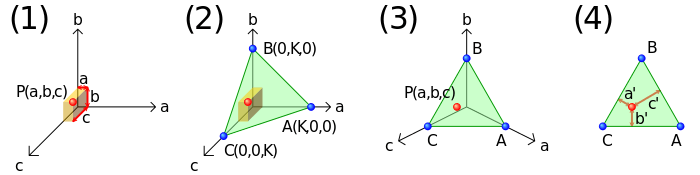 Derivation of a ternary plot from Cartesian coordinates
Figure (1) shows an oblique projection of point P(a,b,c) in a 3-dimensional Cartesian space with axes a, b and c, respectively.
If a + b + c = K (a positive constant), P is restricted to a plane containing A(K,0,0), B(0,K,0) and C(0,0,K). If a, b and c each cannot be negative, P is restricted to the triangle bounded by A, B and C, as in (2).
In (3), the axes are rotated to give an isometric view. The triangle, viewed face-on, appears equilateral.
In (4), the distances of P from lines BC, AC and AB are denoted by a′, b′ and c′, respectively.
For any line l = s + t n̂ in vector form (n̂ is a unit vector) and a point p, the perpendicular distance from p to l is

In this case, point P is at

Line BC has

Using the perpendicular distance formula,

Substituting K = a + b + c,

Similar calculation on lines AC and AB gives

This shows that the distance of the point from the respective lines is linearly proportional to the original values a, b and c.[2]
Plotting a ternary plot
Cartesian coordinates are useful for plotting points in the triangle. Consider an equilateral ternary plot where a = 100% is placed at (x,y) = (0,0) and b = 100% at (1,0). Then c = 100% is (1/2,√3/2), and the triple (a,b,c) is

Example
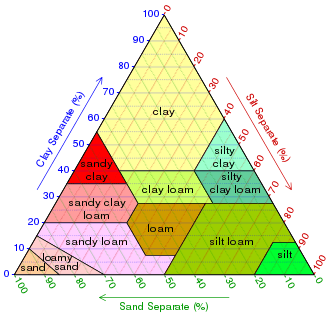
This example shows how this works for a hypothetical set of three soil samples:
Sample Clay Silt Sand Notes Sample 1 50% 20% 30% Because clay and silt together make up 70% of this sample, the proportion of sand must be 30% for the components to sum to 100%. Sample 2 10% 60% 30% The proportion of sand is 30% as in Sample 1, but as the proportion of silt rises by 40%, the proportion of clay decreases correspondingly. Sample 3 10% 30% 60% This sample has the same proportion of clay as Sample 2, but the proportions of silt and sand are swapped; the plot is reflected about its vertical axis.
Plotting the points
- Plotting Sample 1 (1): Find the 50% clay line
- Plotting Sample 1 (2): Find the 20% silt line
- Plotting Sample 1 (3): The intersect coincides with the 30% sand line, as it is mathematically dependent on the first two
- Plotting all the samples
See also
- Apparent molar property
- Barycentric coordinates (mathematics)
- Compositional data
- List of information graphics software
- Types of ternary plots:
- Chromaticity diagram
- de Finetti diagram
- Flammability diagram
- Jensen cation plot
- Piper diagram, used in hydrochemistry
- QFL diagram
- Project triangle
- Trilemma
References
- Karl Tuyls, "An evolutionary game-theoretic analysis of poker strategies", Entertainment Computing January 2009 doi:10.1016/j.entcom.2009.09.002, p. 9
- Vaughan, Will (September 5, 2010). "Ternary plots". Retrieved September 7, 2010.
External links
- "Excel Template for Ternary Diagrams". serc.carleton.edu. Science Education Resource Center (SERC) Carleton College. Retrieved 14 May 2020.
- "Tri-plot: Ternary diagram plotting software". www.lboro.ac.uk. Loughborough University – Department of Geography / Resources Gateway home > Tri-plot. Retrieved 14 May 2020.
- "Ternary Plot Generator – Quickly create ternary diagrams on line". www.ternaryplot.com. Retrieved 14 May 2020.
- Holland, Steven (2016). "Data Analysis in the Geosciences – Ternary Diagrams developed in the R language". strata.uga.edu. University of Georgia. Retrieved 14 May 2020.
| Wikimedia Commons has media related to Ternary plots. |