Swiss Market Index
The Swiss Market Index (SMI) is Switzerland's blue-chip stock market index, which makes it the most followed in the country. It is made up of 20 of the largest and most liquid Swiss Performance Index (SPI) stocks.[1] As a price index, the SMI is not adjusted for dividends.
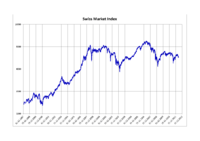 SMI performance between 1988 and 2012 | |
| Foundation | June 30, 1988 |
|---|---|
| Operator | SIX Swiss Exchange |
| Exchanges | SIX Swiss Exchange |
| Trading symbol | SMI |
| Constituents | 20 |
| Type | Large-cap, price index |
| Market cap | CHF 1,145 billion (full, end 2017)[1] |
| Weighting method | Market-value-weighted |
| Related indices | SMI MID, SMI Expanded, SPI 20, SPI, SLI |
| Website | six-group.com |
| ISIN | CH0009980894 |
| Reuters | .SSMI |
| Bloomberg | SMI:IND |
The SMI was introduced on June 30, 1988 at a baseline value of 1,500 points. It closed above the symbolic level of 10,000 points for the first time on July 2, 2019. On March 12, 2020, it reached the level corresponding to a bear market, having lost 20% from its previous peak above 11,000 points.
Its composition is examined once a year. Currently, it contains 19 large-caps and one mid-cap.[2] Calculation takes place in real-time. As soon as a new transaction occurs in a security contained in the SMI, an updated index level is calculated and displayed. However, the index is updated no more than once per second.[3] The SMI is calculated in Swiss Francs, the currency of the Swiss Confederation.
The securities contained in the SMI currently represent approximately 80%[1] of the entire Swiss equity market capitalization, as well as 85% to 90% of the total trading turnover [4] of Swiss and Liechtenstein equities listed on the SIX Swiss Exchange. Because the SMI is considered to be a mirror of the overall Swiss stock market, it is used as the benchmark for numerous mutual funds, index funds and ETFs, and as the underlying index for numerous derivative financial instruments such as options, futures and structured products.
In 2020, the SMI, along with other SIX indices, was endorsed under the EU Benchmarks Regulation and is registered with the European Securities and Markets Authority, which means that it can be used as an underlying for financial products sold in the EU[5].
Rules
Acceptance criteria
The underlying universe of the SMI, from which candidate constituents are selected, is the SPI. To be accepted into the SMI, a given issue must meet stringent requirements with regard to liquidity and market capitalization. On the one hand, it must represent at least 50% of the average liquidity of the SPI constituent issues. On the other hand, it must have a minimum free-float capitalization equal to 0.45% or more of the entire SPI capitalization. Thus, trading volume and capitalization are the determining factors in the quarterly rankings. The composition of the index is reviewed annually on the third Friday in September.
Fixed number of 20 securities
The SMI comprises a fixed number of 20 securities as of the ordinary review date in September 2007. Prior to this date, the index contained 25 listings.
Capped weightings
In 2017, in order to address the issue that the top three constituents (Nestlé, Roche, Novartis) account for more than 60% of the index capitalization, SIX Swiss Exchange changed the rules of the SMI to introduce capped weighting.[3] The weight of any constituent in the SMI index can no longer exceed 18%.
Readjusting any weight exceeding 18% down to that value is done, in principle, on a quarterly basis. However, whenever a constituent reaches a weight exceeding 20% during a quarter (intra-quarter breach), then the weight is brought back to 18% without waiting for the next quarterly review.
To make the transition smoother, there was an initial transition period during which these changes were progressively implemented, in steps of at most 3% per quarter.
Additionally, a new index, the SPI 20, was created to continue indexing the 20 SMI constituents without any caps.
SMI constituents
Current constituents
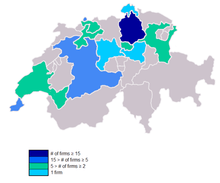
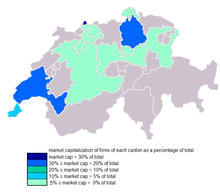
As of September 23, 2019, the following 20 stocks make up the SMI index.[2] All components are large-caps (SPI Large), except one marked as 1, which is a mid-cap (SPI Middle).[6][7] This is because liquidity is a criterion of inclusion, in addition to capitalization.[1] The weights are given as of August 2019.
| Company | ICB Sector | Canton | Ticker symbol | Weight (%) |
|---|---|---|---|---|
| ABB | electronic and electrical equipment | Zurich | ABBN | 3.61 |
| Adecco1 | business training and employment agencies | Zurich | ADEN | 0.95 |
| Alcon | healthcare | Fribourg | ALC | 3.09 |
| Credit Suisse | banks | Zurich | CSGN | 2.95 |
| Geberit | building materials and fixtures | St. Gallen | GEBN | 1.77 |
| Givaudan | specialty chemicals | Geneva | GIVN | 2.25 |
| LafargeHolcim | building materials and fixtures | St. Gallen | LHN | 2.44 |
| Lonza | pharmaceuticals and biotechnology | Basel | LONN | 2.81 |
| Nestlé | food products | Vaud | NESN | 19.17 |
| Novartis | pharmaceuticals | Basel | NOVN | 18.01 |
| Richemont | clothing and accessories | Geneva | CFR | 4.42 |
| Roche | pharmaceuticals | Basel | ROG | 17.87 |
| SGS | business support services | Geneva | SGSN | 1.36 |
| Sika | specialty chemicals | Zug | SIKA | 1.92 |
| Swatch | clothing and accessories | Bern | UHR | 0.92 |
| Swiss Life | life insurance | Zurich | SLHN | 1.74 |
| Swiss Re | reinsurance | Zurich | SREN | 3.24 |
| Swisscom | fixed line telecommunications | Bern | SCMN | 1.34 |
| UBS | banks | Zurich | UBSG | 4.41 |
| Zurich Insurance | full line insurance | Zurich | ZURN | 5.76 |
SMI family
SMI is also the name of a family of indices encompassing the SMI itself, but also the SMI MID with the next 30 large-caps (1) and mid-caps (29), and the SMI Expanded with all 50 shares.
The indices are available in several variations. For example, the SMI, which is a price index, also exists as a performance index, the SMI Cum Dividend (SMIC), which takes into account dividend distributions. [1]
History
Updates
2007
The ranking as of 30 June 2007 (according to average capitalization and the turnover achieved during one year, i.e. from 1 July 2006 through 30 June 2007) determined which companies would remain within the SMI after the number of issues was changed to 20. On 5 July 2007, SWX announced that Ciba Specialty Chemicals, Lonza Group, Givaudan, SGS and one of the two classes of shares of Swatch Group would leave the SMI as of 24 September 2007 leaving 20 securities in the index.[8]
2009
In September 2009, Nobel Biocare and Bâloise were replaced with Lonza Group and SGS.[9]
2010
In June 2010, Swiss Life was replaced with Transocean.[10]
2011
In September 2011, Lonza Group was replaced with Givaudan.[11]
2012
In June 2012, Synthes was replaced with Geberit following the merger with Johnson & Johnson.[12]
2016
In January 2016, Transocean was replaced with Swiss Life.[13]
2017
In May 2017, Lonza Group was added back to the SMI to replace Actelion after its purchase by Johnson & Johnson.[14] In the same month, Sika AG replaced Syngenta after its purchase by ChemChina.[15]
2018
In June 2018, Sika announced a 1:60 stock split.[16] Before this change, it was the SMI constituent with the highest price per share.
2019
In April 2019, Julius Bär was replaced with Alcon after a spin-off (5:1) from Novartis.[17]
Historical values
The following table shows the annual development of the Swiss Market Index since 1988.[18]
| Year | Closing level | Change in Index in points |
Change in Index in % |
|---|---|---|---|
| 1988 | 1,435.40 | ||
| 1989 | 1,778.10 | 342.70 | 23.87 |
| 1990 | 1,383.10 | −395.00 | −22.21 |
| 1991 | 1,670.10 | 287.00 | 20.75 |
| 1992 | 2,105.40 | 435.30 | 26.06 |
| 1993 | 2,956.70 | 851.30 | 40.43 |
| 1994 | 2,629.30 | −327.40 | −11.07 |
| 1995 | 3,299.20 | 669.90 | 25.48 |
| 1996 | 3,942.20 | 643.00 | 19.49 |
| 1997 | 6,265.50 | 2,323.30 | 58.93 |
| 1998 | 7,160.70 | 895.20 | 14.29 |
| 1999 | 7,570.10 | 409.40 | 5.72 |
| 2000 | 8,135.37 | 565.27 | 7.47 |
| 2001 | 6,417.84 | −1,717.53 | −21.11 |
| 2002 | 4,630.75 | −1,787.09 | −27.85 |
| 2003 | 5,487.81 | 857.06 | 18.51 |
| 2004 | 5,693.17 | 205.36 | 3.74 |
| 2005 | 7,583.93 | 1,890.76 | 33.21 |
| 2006 | 8,785.74 | 1,201.81 | 15.85 |
| 2007 | 8,484.46 | −301.28 | −3.43 |
| 2008 | 5,534.53 | −2,949.93 | −34.77 |
| 2009 | 6,545.91 | 1,011.38 | 18.27 |
| 2010 | 6,436.04 | −109.87 | −1.68 |
| 2011 | 5,936.23 | −499.81 | −7.77 |
| 2012 | 6,822.44 | 886.21 | 14.93 |
| 2013 | 8,202.98 | 1,380.54 | 20.24 |
| 2014 | 8,983.37 | 780.39 | 9.51 |
| 2015 | 8,818.09 | −165.28 | −1.84 |
| 2016 | 8,219.87 | −598.22 | −6.78 |
| 2017 | 9,381.87 | 1,162.00 | 14.14 |
| 2018 | 8,429.30 | −952.57 | −10.2 |
| 2019 | 10,616.94 | 2,187.64 | 25.95 |
Milestones
The following table shows historic milestones of the Swiss Market Index. Latest seen values are not final: italic indicates that the value may be seen again if the bear market (-20% from the peak) persists; parentheses indicate that the value will be seen again if we reenter a bull market (maximum value reached again); Other values may be seen again in case of a crash (assuming a threshold of -50%).
| (Closing price) | Value | First seen | Latest seen |
|---|---|---|---|
| Calibration | 1,500.00 | June 30, 1988 | February 2, 1991 |
| Minimum (all times) | 1,287.60 | January 14, 1991 | January 14, 1991 |
| Milestone | 2,000.00 | December 14, 1992 | December 14, 1992 |
| Milestone | 3,000.00 | January 5, 1994 | September 25, 1995 |
| Milestone | 4,000.00 | January 16, 1997 | March 14, 2003 |
| Milestone | 5,000.00 | May 5, 1997 | August 11, 2011 |
| Milestone | 6,000.00 | July 8, 1997 | June 29, 2012 |
| Milestone | 7,000.00 | February 25, 1998 | January 3, 2013 |
| Milestone | 8,000.00 | July 1, 1998 | December 9, 2016 |
| Milestone | 9,000.00 | January 12, 2007 | March 30, 2020 |
| Milestone | 10,000.00 | July 2, 2019 | June 16, 2020 |
| Milestone | 11,000.00 | February 6, 2020 | February 24, 2020 |
| Maximum (all times) | 11,263.01 | February 19, 2020 | (February 19, 2020) |
| Maximum drawdown | -56.3% (8,412 to 3,675.43) | July 21, 1998 to March 12, 2003 |
Notes and references
- "SMI Family – Factsheet" (PDF). SIX Swiss Exchange. Retrieved 27 June 2018.
- "SMI® - the Blue Chip Index". SIX Swiss Exchange. Retrieved 10 April 2019.
- "Rules Governing The SMI Index Family" (PDF). SIX Swiss Exchange. Retrieved 25 June 2018.
- "Volume and turnover". SIX Swiss Exchange. Retrieved 17 April 2019.
- "Swiss Indices Endorsed Under the EU Benchmarks Regulation". SIX Swiss Exchange. Retrieved 12 April 2020.
- "SPI Middle PR". SIX Swiss Exchange. Retrieved 21 June 2019.
- "Index adjustments on the occasion of the ordinary index review" (PDF). SIX Swiss Exchange. Retrieved 10 October 2019.
- "SWX Indices: Adjustments to SMI, SMIM and SLI composition and SPI Small/Mid/Large breakdown" (PDF) (Press release). SWX Swiss Exchange. 5 July 2007. Retrieved 18 July 2007.
- "SIX Swiss Exchange Indices: Adjustments to SMI®, SMIM® and SLI® composition and SPI® small/middle/large breakdown" (PDF). SIX Swiss Exchange. Retrieved 24 June 2018.
- "Extraordinary inclusion of Transocean Ltd in the SMI and SLI indices" (PDF). SIX Swiss Exchange. Retrieved 21 January 2019.
- "Index adjustments on the occasion of the ordinary index review" (PDF). SIX Swiss Exchange. Retrieved 24 June 2018.
- "Index adjustments on the occasion of the delisting of Synthes N" (PDF). SIX Swiss Exchange. Retrieved 29 June 2018.
- "Index adjustments in conjunction with delisting of Transocean Ltd" (PDF). SIX Swiss Exchange. Retrieved 27 June 2018.
- "Index adjustments in conjunction with the takeover of Actelion Ltd" (PDF). SIX Swiss Exchange. Retrieved 24 June 2018.
- "Index adjustments in conjunction with the takeover of Syngenta AG" (PDF). SIX Swiss Exchange. Retrieved 24 June 2018.
- "Sika AG: Stock Split and ISIN-Change". Eurex Exchange. Retrieved 28 September 2018.
- "ALCON to be included into SMI indices" (PDF). SIX Swiss Exchange. Retrieved 2 April 2019.
- "SMI PR (^SSMI) Verlauf – Yahoo Finanzen". de.finance.yahoo.com (in German). Retrieved 21 January 2020.