Staszów County
Staszów County[2] (Polish: powiat staszowski) is a unit of territorial administration and local government (powiat) in Świętokrzyskie Voivodeship, south-central Poland. It came into being on January 1, 1999, as a result of the Polish local government reforms passed in 1998. Its administrative seat and largest town is Staszów, which lies 53 kilometres (33 mi) south-east of the regional capital Kielce. The county also contains the towns of Połaniec, lying 17 km (11 mi) south-east of Staszów, and Osiek, 21 km (13 mi) east of Staszów.
Staszów County Powiat staszowski | |
|---|---|
 Flag  Coat of arms | |
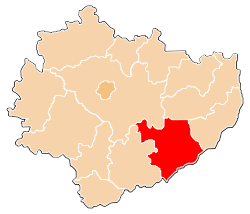 Location within the voivodeship | |
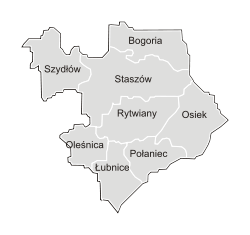 Division into gminas | |
| Coordinates (Staszów): 50°31′01.56″N 21°11′37.64″E | |
| Country | |
| Voivodeship | Świętokrzyskie |
| Seat | Staszów |
| Gminas | |
| Area (through the years 2008-2010)[1] | |
| • Total | 924.80 km2 (357.07 sq mi) |
| Population (31 December 2010 at Census)[1] | |
| • Total | 73,125 |
| • Density | 79/km2 (200/sq mi) |
| • Urban | 25,336 |
| • Rural | 47,789 |
| Time zone | UTC+1 (CET) |
| • Summer (DST) | UTC+2 (CEST) |
| Postal code | 28-200, 28-210, 28-220, 28-221, 28-225, 28-230, 28-232 and 28-236 |
| Area code(s) | + 48 15 or +48 41 |
| Car plates | TSZ |
| Website | http://www.staszowski.eu |
The county covers an area of 924.80 square kilometres (357.1 sq mi). As of 2010 its total population is ![]()
![]()
![]()
![]()
![]()
Demography
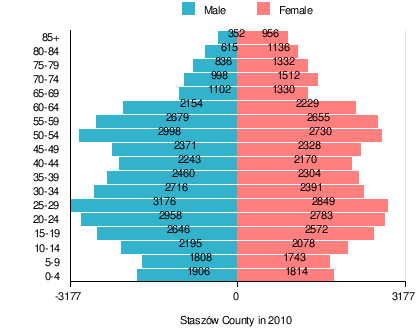
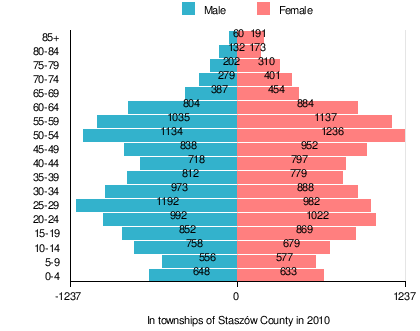
According to the 2011 Poland census, there were 73,125 people residing in Staszów County, of whom 49.5% were male and 50.5% were female (out of which the population in townships amounts to 25,336, of whom 48.8% were male and 51.2% were female; and the population of the villageships part of the county is 47,789, of whom 49.9% were male and 50.1% were female). In the county, the population was spread out with 19.8% under the age of 18, 38.7% from 18 to 44, 24.5% from 45 to 64, and 17% who were 65 years of age or older (out of which the population in rural areas amounts to 19% under the age of 18, 39.1% from 18 to 44, 28.2% from 45 to 64, and 13.7% who were 65 years of age or older; and the population of the villageships part of the county is 20.3% under the age of 18, 38.5% from 18 to 44, 22.6% from 45 to 64, and 18.7% who were 65 years of age or older).[1]
Table 1. Population level of county in 2010 — by age group[1] SPECIFICATION Measure
unitPOPULATION
(by age group in 2010)TOTAL 0-4 5-9 10-14 15-19 20-24 25-29 30-34 35-39 40-44 45-49 50-54 55-59 60-64 65-69 70-74 75-79 80-84 85 + I. TOTAL person 73,125 3,720 3,551 4,273 5,218 5,741 6,025 5,107 4,764 4,413 4,699 5,728 5,334 4,383 2,432 2,510 2,168 1,751 1,308 — of which in % 100 5.1 4.9 5.8 7.1 7.9 8.2 7 6.5 6 6.4 7.8 7.3 6 3.3 3.4 3 2.4 1.8 1. BY SEX A. Males person 36,213 1,906 1,808 2,195 2,646 2,958 3,176 2,716 2,460 2,243 2,371 2,998 2,679 2,154 1,102 998 836 615 352 — of which in % 49.5 2.6 2.5 3 3.6 4 4.3 3.7 3.4 3.1 3.2 4.1 3.7 2.9 1.5 1.4 1.1 0.8 0.5 B. Females person 36,912 1,814 1,743 2,078 2,572 2,783 2,849 2,391 2,304 2,170 2,328 2,730 2,655 2,229 1,330 1,512 1,332 1,136 956 — of which in % 50.5 2.5 2.4 2.8 3.5 3.8 3.9 3.3 3.2 3 3.2 3.7 3.6 3 1.8 2.1 1.8 1.6 1.3
Table 2. Population level of townships in 2010 — by age group[1] SPECIFICATION Measure
unitPOPULATION
(by age group in 2010)TOTAL 0-4 5-9 10-14 15-19 20-24 25-29 30-34 35-39 40-44 45-49 50-54 55-59 60-64 65-69 70-74 75-79 80-84 85 + I. TOTAL person 25,336 1,281 1,133 1,437 1,721 2,014 2,174 1,861 1,591 1,515 1,790 2,370 2,172 1,688 841 680 512 305 251 — of which in % 100 5.1 4.5 5.7 6.8 7.9 8.6 7.3 6.3 6 7.1 9.4 8.6 6.7 3.3 2.7 2 1.2 1 1. BY SEX A. Males person 12,372 648 556 758 852 992 1,192 973 812 718 838 1,134 1,035 804 387 279 202 132 60 — of which in % 48.8 2.6 2.2 3 3.4 3.9 4.7 3.8 3.2 2.8 3.3 4.5 4.1 3.2 1.5 1.1 0.8 0.5 0.2 B. Females person 12,964 633 577 679 869 1,022 982 888 779 797 952 1,236 1,137 884 454 401 310 173 191 — of which in % 51.2 2.5 2.3 2.7 3.4 4 3.9 3.5 3.1 3.1 3.8 4.9 4.5 3.5 1.8 1.6 1.2 0.7 0.8
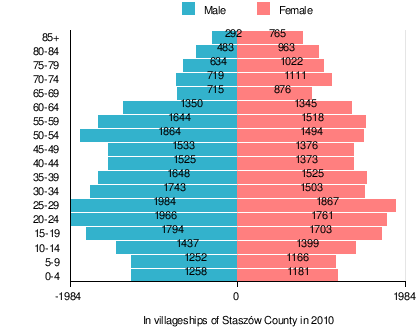
Table 3. Population level of villageships in 2010 — by age group[1] SPECIFICATION Measure
unitPOPULATION
(by age group in 2010)TOTAL 0-4 5-9 10-14 15-19 20-24 25-29 30-34 35-39 40-44 45-49 50-54 55-59 60-64 65-69 70-74 75-79 80-84 85 + I. TOTAL person 47,789 2,439 2,418 2,836 3,497 3,727 3,851 3,246 3,173 2,898 2,909 3,358 3,162 2,695 1,591 1,830 1,656 1,446 1,057 — of which in % 100 5.1 5.1 5.9 7.3 7.8 8.1 6.8 6.6 6.1 6.1 7 6.6 5.6 3.3 3.8 3.5 3 2.2 1. BY SEX A. Males person 23,841 1,258 1,252 1,437 1,794 1,966 1,984 1,743 1,648 1,525 1,533 1,864 1,644 1,350 715 719 634 483 292 — of which in % 49.9 2.6 2.6 3 3.8 4.1 4.2 3.6 3.4 3.2 3.2 3.9 3.4 2.8 1.5 1.5 1.3 1 0.6 B. Females person 23,948 1,181 1,166 1,399 1,703 1,761 1,867 1,503 1,525 1,373 1,376 1,494 1,518 1,345 876 1,111 1,022 963 765 — of which in % 50.1 2.5 2.4 2.9 3.6 3.7 3.9 3.1 3.2 2.9 2.9 3.1 3.2 2.8 1.8 2.3 2.1 2 1.6
Table 4. Population level of county in 2010 — by sex[1] SPECIFICATION Measure
unitPOPULATION
(by sex in 2010)TOTAL Males Females I. TOTAL person 73,125 36,213 36,912 — of which in % 100 49.5 50.5 1. BY AGE GROUP A. At pre-working age person 14,509 7,439 7,070 — of which in % 19.8 10.1 9.7 B. At working age. grand total person 46,218 24,871 21,347 — of which in % 63.2 34 29.2 a. at mobile working age person 28,303 14,669 13,634 — of which in % 38.7 20.1 18.6 b. at non-mobile working age person 17,915 10,202 7,713 — of which in % 24.5 14 10.5 C. At post-working age person 12,398 3,903 8,495 — of which in % 17 5.4 11.6
Table 5. Population level of townships in 2010 — by sex[1] SPECIFICATION Measure
unitPOPULATION
(by sex in 2010)TOTAL Males Females I. TOTAL person 25,336 12,372 12,964 — of which in % 100 48.8 51.2 1. BY AGE GROUP A. At pre-working age person 4,823 2,464 2,359 — of which in % 19 9.7 9.3 B. At working age. grand total person 17,040 8,848 8,192 — of which in % 67.3 34.9 32.3 a. at mobile working age person 9,904 5,037 4,867 — of which in % 39.1 19.9 19.2 b. at non-mobile working age person 7,136 3,811 3,325 — of which in % 28.2 15.1 13.1 C. At post-working age person 3,473 1,060 2,413 — of which in % 13.7 4.2 9.5
Table 6. Population level of villageships in 2010 — by sex[1] SPECIFICATION Measure
unitPOPULATION
(by sex in 2010)TOTAL Males Females I. TOTAL person 47,789 23,841 23,948 — of which in % 100 49.9 50.1 1. BY AGE GROUP A. At pre-working age person 9,686 4,975 4,711 — of which in % 20.3 10.4 9.9 B. At working age. grand total person 29,178 16,023 13,155 — of which in % 61.1 33.5 27.5 a. at mobile working age person 18,399 9,632 8,767 — of which in % 38.5 20.2 18.3 b. at non-mobile working age person 10,779 6,391 4,388 — of which in % 22.6 13.4 9.2 C. At post-working age person 8,925 2,843 6,082 — of which in % 18.7 5.9 12.7
Neighbouring counties
Staszów County is bordered by Opatów County to the north-east, Sandomierz County and Tarnobrzeg County to the east, Mielec County and Dąbrowa County to the south, Busko County to the west, and Kielce County to the north-west.
Administrative division
The county is subdivided into eight gminas (three urban-rural and five rural). These are listed in the following table, in descending order of population.
| Gmina | Type | Area (km²) |
Population (2010) |
Seat |
| Gmina Staszów | urban-rural | 227.52 | 26,077 | Staszów |
| Gmina Połaniec | urban-rural | 75.01 | 11,848 | Połaniec |
| Gmina Bogoria | rural | 122.89 | 7,983 | Bogoria |
| Gmina Osiek | urban-rural | 129.30 | 7,904 | Osiek |
| Gmina Rytwiany | rural | 124.66 | 6,240 | Rytwiany |
| Gmina Szydłów | rural | 107.90 | 4,800 | Szydłów |
| Gmina Łubnice | rural | 84.14 | 4,382 | Łubnice |
| Gmina Oleśnica | rural | 53.38 | 3,891 | Oleśnica |
References
- "Local Data Bank (Bank Danych Lokalnych) – Layout by NTS nomenclature (Układ wg klasyfikacji NTS)". demografia.stat.gov.pl: GUS. 10 March 2011.
- "Staszowski, powiat, województwo świętokrzyskie" [Staszów, county, Świętokrzyskie Province, Poland]. Topographical map prepared in 1:10,000 scale. Aerial and satellite orthophotomap (in Polish). Head Office of Geodesy and Cartography, Poland, Warsaw. 2011. geoportal.gov.pl. Retrieved 27 April 2011.
