Sabangan
Sabangan, officially the Municipality of Sabangan is a 5th class municipality in the province of Mountain Province, Philippines. According to the 2015 census, it has a population of 9,315 people.[3]
Sabangan | |
|---|---|
| Municipality of Sabangan | |
 Seal | |
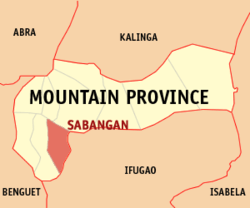 Map of Mountain Province with Sabangan highlighted | |
| |
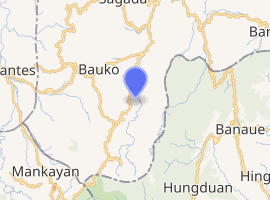
.svg.png) Sabangan Location within the Philippines | |
| Coordinates: 16°57′N 120°55′E | |
| Country | |
| Region | Cordillera Administrative Region (CAR) |
| Province | Mountain Province |
| District | Lone District |
| Barangays | 15 (see Barangays) |
| Government | |
| • Type | Sangguniang Bayan |
| • Mayor | Marcial C. Lawilao Jr. |
| • Vice Mayor | Dario P. Esden |
| • Congressman | Maximo Y. Dalug Jr. |
| • Electorate | 7,834 voters (2019) |
| Area | |
| • Total | 72.04 km2 (27.81 sq mi) |
| Elevation | 1,075.3 m (3,527.9 ft) |
| Population (2015 census)[3] | |
| • Total | 9,315 |
| • Density | 130/km2 (330/sq mi) |
| • Households | 2,215 |
| Economy | |
| • Income class | 5th municipal income class |
| • Poverty incidence | 19.07% (2015)[4] |
| • Revenue (₱) | 53,547,583.69 (2016) |
| Time zone | UTC+8 (PST) |
| ZIP code | 2622 |
| PSGC | |
| IDD : area code | +63 (0)74 |
| Climate type | tropical rainforest climate |
| Native languages | Balangao Bontoc Ilocano Tagalog |
| Website | www |
Barangays
Sabangan is politically subdivided into 15 barangays.
- Bao-angan
- Bun-ayan
- Busa
- Camatagan
- Capinitan
- Data
- Gayang
- Lagan
- Losad
- Namatec
- Napua
- Pingad
- Poblacion
- Supang
- Tambingan
Climate
| Climate data for Sabangan, Mountain Province | |||||||||||||
|---|---|---|---|---|---|---|---|---|---|---|---|---|---|
| Month | Jan | Feb | Mar | Apr | May | Jun | Jul | Aug | Sep | Oct | Nov | Dec | Year |
| Average high °C (°F) | 21 (70) |
23 (73) |
24 (75) |
26 (79) |
25 (77) |
25 (77) |
24 (75) |
24 (75) |
24 (75) |
24 (75) |
23 (73) |
22 (72) |
24 (75) |
| Average low °C (°F) | 15 (59) |
15 (59) |
16 (61) |
18 (64) |
19 (66) |
19 (66) |
19 (66) |
19 (66) |
19 (66) |
18 (64) |
17 (63) |
16 (61) |
18 (63) |
| Average precipitation mm (inches) | 35 (1.4) |
46 (1.8) |
63 (2.5) |
117 (4.6) |
402 (15.8) |
400 (15.7) |
441 (17.4) |
471 (18.5) |
440 (17.3) |
258 (10.2) |
94 (3.7) |
68 (2.7) |
2,835 (111.6) |
| Average rainy days | 9.9 | 19.5 | 13.9 | 18.9 | 26.0 | 27.3 | 28.9 | 28.5 | 26.1 | 19.7 | 14.5 | 12.8 | 246 |
| Source: Meteoblue [5] | |||||||||||||
Demographics
| Population census of Sabangan | ||
|---|---|---|
| Year | Pop. | ±% p.a. |
| 1903 | 49 | — |
| 1918 | 3,092 | +31.83% |
| 1939 | 4,706 | +2.02% |
| 1948 | 4,581 | −0.30% |
| 1960 | 8,900 | +5.69% |
| 1970 | 6,517 | −3.06% |
| 1975 | 7,599 | +3.13% |
| 1980 | 8,194 | +1.52% |
| 1990 | 8,083 | −0.14% |
| 1995 | 8,609 | +1.19% |
| 2000 | 8,728 | +0.29% |
| 2007 | 9,098 | +0.57% |
| 2010 | 8,741 | −1.45% |
| 2015 | 9,315 | +1.22% |
| Source: Philippine Statistics Authority[3][6][7][8] | ||
References
- "Municipality". Quezon City, Philippines: Department of the Interior and Local Government. Retrieved 31 May 2013.
- "Province: Mountain Province". PSGC Interactive. Quezon City, Philippines: Philippine Statistics Authority. Retrieved 12 November 2016.
- Census of Population (2015). "Cordillera Administrative Region (CAR)". Total Population by Province, City, Municipality and Barangay. PSA. Retrieved 20 June 2016.
- "PSA releases the 2015 Municipal and City Level Poverty Estimates". Quezon City, Philippines. Retrieved 12 October 2019.
- "Sabangan: Average Temperatures and Rainfall". Meteoblue. Retrieved 8 March 2020.
- Census of Population and Housing (2010). "Cordillera Administrative Region (CAR)". Total Population by Province, City, Municipality and Barangay. NSO. Retrieved 29 June 2016.
- Censuses of Population (1903–2007). "Cordillera Administrative Region (CAR)". Table 1. Population Enumerated in Various Censuses by Province/Highly Urbanized City: 1903 to 2007. NSO.
- "Province of Mountain Province". Municipality Population Data. Local Water Utilities Administration Research Division. Retrieved 17 December 2016.
External links
- Sabangan Profile at PhilAtlas.com
- Tourism, see for more tourist attractions and more info
- More photos and information on Sabangan, Mountain Province
- Philippine Standard Geographic Code
- Philippine Census Information
Places adjacent to Sabangan | ||||||||||
|---|---|---|---|---|---|---|---|---|---|---|
| ||||||||||
This article is issued from Wikipedia. The text is licensed under Creative Commons - Attribution - Sharealike. Additional terms may apply for the media files.