Racial achievement gap in the United States
The racial achievement gap in the United States[1] refers to disparities in educational achievement between differing ethnic groups. It manifests itself in a variety of ways: among students, African-Americans, Latinos, and Chicano students are more likely to receive lower grades, score lower on standardized tests, drop out of high school, and they are less likely to enter and complete college than whites, while whites score lower than Asian Americans.[2] There is disagreement among scholars regarding the origins of the racial achievement gap. Some focus on the home life of individual students, and others focus more on unequal access of certain ethnic groups to resources. Such as the fact that every dollar the board spent on a black or brown student, equals up to seven spent on a white student.[3] Additionally, political histories such as anti-literacy laws and current policies such as school funding have resulted in a education debt between districts, schools, and students. The achievement gap effect economic disparities internally, the future of the national economy,[4] political participation, and political representation.[5][6] Solutions have ranged from national with policies such as No Child Left Behind and more recently the Every Student Succeeds Act to private industry closing this gap and even local efforts.
| Education in the United States |
|---|
|
|
|
Overview of the racial achievement gap
Over the past 45 years, students in the United States have made notable gains in academic achievement. However, racial achievement gaps remain because not all groups of students are advancing at the same rates. Evidence of the racial achievement gaps have been manifested through standardized test scores, high school dropout rates, high school completion rates, college acceptance and retention rates, as well as through longitudinal trends. While efforts to close racial achievement gaps have increased over the years with varying success, studies have shown that disparities still exist between achievement levels of differing ethnic groups.
Early schooling years
Kindergarten through fifth grade
Racial achievement gaps have been found to exist before students enter kindergarten for their first year of schooling.[7] At the start of kindergarten, Hispanic and black students have math and reading scores substantially lower than those of white students. While both Hispanics and blacks scores have significantly lower test scores than their white counterparts, Hispanic and black have scores that are roughly equal to each other. there is a lot of negative feedback about potential and achievement gap when it comes to African american students.[8] In a study published in 2009, Reardon and Galindo (2009) specifically examine test scores by race and ethnicity. The data Reardon and Galindo (2009) use comes from the ECLS-K, sponsored by the National Center for Education Statistics. The ECLS-K contains data on a nationally representative sample of approximately 21,400 students from the kindergarten class of 1998–1999. Students in the sample were assessed in reading and mathematics skills six times from 1998 to 2004. The content areas of the tests are based on the National Assessment of Educational Progress (NAEP) fourth-grade content areas, adapted to be age appropriate at each grade level. The assessments were scored using a three-parameter Item Response Theory (IRT) model. Reardon and Galindo (2009) found that average Hispanic and black students begin kindergarten with math scores three quarters of a standard deviation lower than those of white students and with reading scores a half standard deviation lower than those of white students. Six years later, Hispanic-white gaps narrow by roughly a third, whereas black-white gaps widen by about a third. More specifically, the Hispanic-white gap is a half standard deviation in math, and three-eighths in reading at the end of fifth grade. The trends in the Hispanic-white gaps are especially interesting because of the rapid narrowing that occurs between kindergarten and first grade. Specifically, the estimated math gap declines from 0.77 to 0.56 standard deviations, and the estimated reading gap from 0.52 to 0.29 in the roughly 18 months between the fall of kindergarten and the spring of first grade. In the four years from the spring of first grade through the spring of fifth grade, the Hispanic-white gaps narrow slightly to 0.50 standard deviations in math and widening slightly to 0.38 deviations in reading.[7]
Children of Latino, Native, and African American heritage arrive to kindergarten and first grade with lower levels of oral language, reading, and mathematics skill than Caucasian and Asian American children. It is estimated that the achievement gap could drastically be shortened if the performance gap at school entrance is addressed.[9]
Third through eighth grade
In a 2009 study Clotfelter et al. examine test scores of elementary and middle school students by race.[10] The data used in the study comes from administrative records created by North Carolina's Department of Public Instruction and maintained by the North Carolina Education Research Data Center and are not nationally representative. North Carolina requires all students to take standardized achievement tests in both math and reading at the end of every grade between grades 3 and 8. In order to make comparisons across years, Clotfelter et al. (2009) normalized the scaled scores for each test in every year over all students in the state who took the test so that each test would have a mean score of 0 and a standard deviation of 1. On this normalized scale, positive scores denote above-average performances relative to the statewide average, and negative scores denote below-average performance. Analysis by Clotfelter et al. (2009) found gaps between four different racial groups: whites, Asians, Hispanics, and blacks.[10] Essentially, while the black-white gaps are substantial, both Hispanic and Asian students tend to gain on whites as they progress in school. The white-black achievement gap in math scores is about half a standard deviation, and the white-black achievement gap in reading is a little less than half a standard deviation. By fifth grade, Hispanic and white students have roughly the same math and reading scores. By eighth grade, scores for Hispanic students in North Carolina surpassed those of observationally equivalent whites by roughly a tenth of a standard deviation. Asian students surpass whites on math and reading tests in all years except third and fourth grade reading.[10] In both fourth-grade reading and eighth-grade math, African American students are about two and a half times as likely as white students to lack basic skills and only about one-third as likely to be proficient or advanced.
Secondary school
In a 2006 study, LoGerfo, Nichols, and Reardon (2006) found that, starting in the eighth grade, white students have an initial advantage in reading achievement over black and Hispanic students but not Asian students.[11] Using nationally representative data from by the National Center for Education Statistics (NCES)—the Early Childhood Longitudinal Study (ECLS-K) and the National Education Longitudinal Study (NELS:88), LoGerfo, Nichols, and Reardon (2006) claim that black students score 5.49 points lower than white students and Hispanic students score 4.83 points lower than white students on reading tests. These differences in initial status are compounded by differences in reading gains made during high school. Specifically, between ninth and tenth grades, white students gain slightly more than black students and Hispanic students, but white students gain less than Asian students. Between tenth and twelfth grades, white students gain at a slightly faster rate than black students, but white students gain at a slower rate than Hispanic students and Asian students.[11]
In eighth grade, white students also have an initial advantage over black and Hispanic students in math tests.[11] However, Asian students have an initial 2.71 point advantage over white students and keep pace with white students throughout high school. Between eighth and tenth grade, black students and Hispanic students make slower gains in math than white students, and black students fall farthest behind. Asian students gain 2.71 points more than white students between eight and tenth grade. Some of these differences in gains persist later in high school. For example, between tenth and twelfth grades, white students gain more than black students, and Asian students gain more than white students. There are no significant differences in math gains between white students and Hispanic students. By the end of high school, gaps between groups increase slightly. Specifically, the initial 9-point advantage of white students over black students increases by about a point, and the initial advantage of Asian students over white students also increases by about a point. Essentially, by the end of high school, Asian students are beginning to learn intermediate-level math concepts, whereas black and Hispanic students are far behind, learning fractions and decimals, which are math concepts that the white and Asian students learned in the eighth grade. Black and Hispanic students end twelfth grade with scores 11 and 7 points behind those of white students, while the male-female difference in math scores is only around 2 points.[11]
Standardized test scores
The racial group differences across admissions tests, such as the SAT, ACT, GRE, GMAT, MCAT, LSAT, Advanced Placement Program examinations and other measures of educational achievement, have been fairly consistent. Since the 1960s, the population of students taking these assessments has become increasingly diverse. Consequently, the examination of ethnic score differences have been more rigorous.[12] Specifically, the largest gaps exist between white and African American students. On average, they score about .82 to 1.18 standard deviations lower than white students in composite test scores.[13] Following closely behind is the gap between white and Hispanic students. Asian American students overall performance were higher than those of White students except Asian American students performed one quarter standard deviation unit lower on the SAT verbal section, and about one half a standard deviation unit higher in the GRE Quantitative test.[12] However, in the new current version of the SAT, Asian-American students of Taiwanese, Korean, Japanese, Indian and Han Chinese descent have scored higher on both the verbal and math sections of the new SAT test than whites and all other student racial groups.[14][15]
The National Assessment of Educational Progress reports the national Black-White gap and the Hispanic-White Gap in math and reading assessments, measured at the 4th and 8th grade level. The trends show both gaps widen in mathematics as students grow older, but tend to stay the same in reading. Furthermore, the NAEP measures the widening and narrowing of achievement gaps on a state level. From 2007 to 2009, the achievement gaps for the majority of states stayed the same, although more fluctuations were seen at the 8th grade level than the 4th grade level.[16][17]
The Black-White Gap demonstrates:[16]
- In mathematics, a 26-point difference at the 4th grade level and a 31-point difference at the 8th grade level.
- In reading, a 27-point difference at the 4th grade level and a 26-point difference at the 8th grade level.
The Hispanic White Gap demonstrates:[17]
- In mathematics, a 21-point difference at the 4th grade level and a 26-point difference at the 8th grade level.
- In reading, there is a 25-point difference at the 4th grade level and a 24-point difference at the 8th grade level (NAEP, 2011).
The National Educational Longitudinal Survey (NELS, 1988) demonstrates similar findings in their evaluation of assessments administered to 12th graders in reading and math.[18]
Mathematics
Results of the mathematics achievement test:
White-African American gap
Non Hispanic White-Hispanic gap

Reading
Results of the reading achievement test:
Non Hispanic White-Hispanic gap

High school dropout rates
According to the US Department of Education, event dropout rate is the percentage of high school students who dropped out of high school between the beginning of one school year and the beginning of the next school year.[19] Five out of every 100 students enrolled in high school in October 2000 left school before October 2001 without successfully completing a high school program. The percentage of students who were event dropouts decreased from 1972 through 1987. However, despite some year-to-year fluctuations, the percentage of students dropping out of school each year has stayed relatively the same since 1987. Data from the October 2001 Current Population Survey (CPS) show that black and Hispanic students were more likely to have dropped out of high school between October 2000 and October 2001 than were white or Asians/Pacific Islander students. During this period, 6.3% of black and 8.8% of Hispanic high school students dropped out compared to 4.1% of white and 2.3% of Asian/Pacific Islander high school students.[19]
| Event Dropout Rate | |
|---|---|
| Asian/Pacific Islander | 2.3% |
| White | 4.1% |
| Black | 6.3% |
| Hispanic | 8.8% |
According to the US Department of Education, status dropout rates measure the percentage of individuals who are not enrolled in high school and who lack a high school credential, independent of when they dropped out.[19] Status rates are higher than event rates because they include all dropouts in this age range, regardless of when they last attended school or whether or not they ever entered the US education system. In October 2001, about 3.8 million 16- through 24-year-olds were not enrolled in a high school program and had not completed high school. These individuals accounted for 10.7% of the 35.2 million 16- through 24-year-olds in the United States in 2001. In 1972, the white status dropout rate was 40% and the black status dropout rate was 49%. Because the black rate declined more steeply than the white rate, there has been a narrowing of the gap between the dropout rates for blacks and whites. However, this narrowing occurred in the 1980s, and the gap between whites and blacks has remained fairly constant since 1990. The percentage of Hispanics who were status dropouts has remained higher than that of blacks and whites in every year since 1970. Even though Hispanics represented approximately the same percentage of the young adult population as did blacks, Hispanics were disproportionately represented among status dropouts in 2001. Also in 2001, the status dropout rate for Asians/Pacific Islanders ages 16–24 was lower than for any other 16- through 24-year-olds. Specifically, the status rate for Asians/Pacific Islanders was 3.6%, compared with 27.0% for Hispanics, 20.9% for blacks, and 7.3% for whites.[19]
| Status Dropout Rate | |
|---|---|
| Asian/Pacific Islander | 3.6% |
| White | 7.3% |
| Black | 20.9% |
| Hispanic | 27.0% |
High school completion rates
Status completion rates measure the percentage of a given population that has a high school credential, regardless of when the credential was earned.[19] In 2001, 86.5% of 18- through 24-year-olds not enrolled in elementary or secondary school had completed high school. Status completion rates increased from 82.8% in 1972 to 85.6% in 1990. Since 1991, the rate has shown no consistent trend and has fluctuated between 84.8% and 86.5%. High school status completion rates for white and black young adults increased between the early 1970s and 1990 but has remained relatively the same since 1990. Specifically, status completion rates for white students increased from 86.0% in 1972 to 89.6% in 1990. Since 1990, white completion rates have remained in the range of 89.4–91.8%. In 2001, 91.0% of white and 85.6% of black 18- through 24-year-olds had completed high school. The percentage of black students completing high school rose from 72.1% in 1972 to 85.6% in 2001. The gap between black and white completion rates narrowed between 1972 and 2001. In 2001, 65.7% of all Hispanic 18- through 24-year- olds completed high school. This percentage compares to 91.0% of whites, 85.6% of blacks, and 96.1% of Asians/Pacific Islanders. Essentially, in 2001, whites and Asians/Pacific Islanders were more likely than their black and Hispanic peers to have completed high school. Also, whites completed high school at a higher rate than both blacks and Hispanic students. Black students completed high school at a higher rate than Hispanics.[19]
| Status Completion Rate | |
|---|---|
| Asian/Pacific Islander | 96.1% |
| White | 91.0% |
| Black | 85.6% |
| Hispanic | 65.7% |
The four-year completion rate is the percentage of 9th-grade students who left school over a subsequent 4-year period while also completing a high school credential.[19] Data for the 4-year completion rate calculations are taken from the Common Core of Data (CCD). The 4-year completion rate calculation is dependent on the availability of dropout estimates over a 4-year span, and current counts of completers. Because dropout rate information was missing for many states during the 4-year period considered by the US Department of Education, 4- year completion rate estimates for the 2000-01 school year are only available for 39 states. Since data were not available from all states, an overall national rate could not be calculated. However, among reporting states, the high school 4-year completion rates for public school students ranged from a high of 90.1% in North Dakota to a low of 65.0% in Louisiana.[19]
In the United States, there is a percentage of the racial groups, like Latinos, African Americans, and Chicano who actually do really well with their education. The percentage of how many Latinos and African Americans actually graduate high school is from 49-53 percent. [20] Those racial groups do have the lowest percentage of being successful in their education but some of them do actually succeed and graduate high school and go to college. [21] With the percentage of the Latinos and African Americans that succeed with their education, some students do end up going to college after they graduate from high school. A third of the Latino and African American students with at least a 3.5 grade-point average or higher, end up going to a community college or a university. [22] According to the Education Department, 19 percent of African Americans and 16 percent of Latinos end up getting at least a bachelor's degree. [23]
SAT scores
Racial and ethnic variations in SAT scores follow a similar pattern to other racial achievement gaps. In 1990, the average SAT was 528 for Asian-Americans, 491 for whites, 429 for Mexican Americans and 385 for blacks.[24] 34% of Asians compared with 20% of whites, 3% of blacks, 7% of Mexican Americans, and 9% of Native Americans scored above a 600 on the SAT math section.[24] On the SAT verbal section in 1990, whites scored an average of 442, compared with 410 for Asians, 352 for blacks, 380 for Mexican Americans, and 388 for Native Americans. In 2015, the average SAT scores on the math section were 598 for Asian-Americans, 534 for whites, 457 for Hispanic Latinos and 428 for blacks.[25] Additionally, 10% of Asian-Americans, 8% of whites, 3% of Mexican Americans, 3% of Native Americans and 2% of blacks scored above 600 on the SAT verbal section in 1990.[24] Race gaps on the SATs are especially pronounced at the tails of the distribution. In a perfectly equal distribution, the racial breakdown of scores at every point in the distribution should ideally mirror the demographic composition of test-takers as whole i.e. 51% whites, 21% Hispanic Latinos, 14% blacks, and 14% Asian-Americans. But ironically, among the highest top scorers, those scoring between a 750 and 800 (perfect scores) over 60% are East Asians of Taiwanese, Japanese, Korean and Han Chinese descent, while only 33% are white, compared to 5% Hispanic Latinos and 2% blacks.[25]
There are some limitations to the data which may mean that, if anything, the race gap is being understated. The ceiling on the SAT score may, for example, understate the achievement and full potential of East Asians of Taiwanese, Japanese, Korean and Han Chinese descent. If the exam was redesigned to increase score variance (add harder and easier questions than it currently has), the achievement gap across racial groups could be even more wider and pronounced. In other words, if the math section was scored between 0 and 1000, we might see more complete tails on both the right and the left. More East Asians score between 750 and 800 than score between 700 and 750, suggesting that many East Asians of Taiwanese, Japanese, Korean and Han Chinese descent could be scoring high above 800 if the test allowed them to.[25]
College enrollment and graduation rates
The US Department in Education demonstrates performance of different ethnic groups in colleges and universities. Specifically, they found that about 72% of White students who have completed high school enrolled in college the same year, compared to 44% for Black students, and 50% for Hispanic students.[26] Furthermore, trends in undergraduate and graduate enrollment have shown increases in all ethnicity groups, but the largest gap still exists for Black student enrollment. Hispanic and Asian/Pacific Islanders student enrollment have experienced the most growth since 1976.[27] The 6-year national college graduation rate is 59% for White students, 51% for Hispanic students, 46% for Black females, and 35% for Black males.[28] Furthermore, even at prestigious institutions, the graduation rate of white students is higher than that of black students.[29]
Long-term trends
The National Assessment of Educational Progress (NAEP) has been testing seventeen-year-olds since 1971. From 1971 to 1996, the black-white reading gap shrank by almost one half and the math gap by almost one third.[30] Specifically, blacks scored an average of 239 points, and whites scored an average of 291 points on the NAEP reading tests in 1971. In 1990, blacks scored an average of 267, and whites scored an average of 297 points. On NAEP math tests in 1973, blacks scored an average of 270, and whites scored 310. In 1990, black average score was 289 and whites scored an average of 310 points. For Hispanics, the average NAEP math score for seventeen-year-olds in 1973 was 277 and 310 for whites. In 1990, the average score among Hispanics was 284 compared with 310 for whites.[24]
Because of small population size in the 1970s, similar trend data are not available for Asian Americans. Data from the 1990 NAEP Mathematics Assessment Tests show that among twelfth graders, Asians scored an average of 315 points compared with 301 points for whites, 270 for blacks, 278 for Hispanics, and 290 for Native Americans.[30] Racial and ethnic differentiation is most apparent at the highest achievement levels. Specifically, 13% of Asians performed at level of 350 points or higher, 6% of whites, less than 1% of blacks, and 1% of Hispanics did so.[30]
The NAEP has since collected and analyzed data through 2008. Overall, the White-Hispanic and the White-Black gap for NAEP scores have significantly decreased since the 1970s.[31] The Black-White Gap demonstrates:[31]
- In mathematics, the gap for 17-year-olds was narrowed by 14 points from 1973 to 2008.
- In reading, the gap for 17-year-olds was narrowed by 24 points from 1971 to 2008.
The Hispanic-White Gap demonstrates:[31]
- In mathematics, the gap for 17-year-olds was narrowed by 12 points from 1973 to 2008.
- In reading, the gap for 17-year-olds was narrowed by 15 points from 1975 to 2008.
Furthermore, subgroups showed predominant gains in 4th grade at all achievement levels. In terms of achieving proficiency, gaps between subgroups in most states have narrowed across grade levels, yet had widened in 23% of instances. The progress made in elementary and middle schools was greater than that in high schools, which demonstrates the importance of early childhood education. Greater gains were seen in lower-performing subgroups rather than in higher-performing subgroups. Similarly, greater gains were seen in Latino and African American subgroups than for low-income and Native American subgroups.[32]
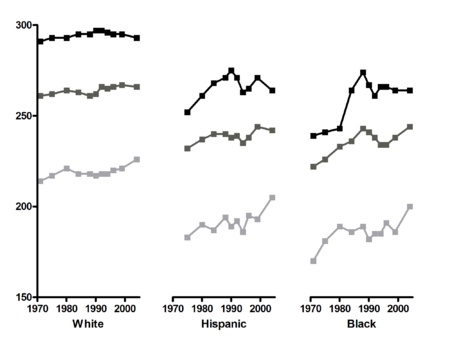
- Reading- ages 9 (light gray), 13 (dark gray), and 17 (black).
Theories on the Origin of the Racial Achievement Gap
The achievement gap between low-income minority students and middle-income White students has been a popular research topic among sociologists since the publication of the report, "Equality of Educational Opportunity" (more widely known as the Coleman Report). This report was commissioned by the U.S. Department of Education in 1966 to investigate whether the performance of African-American students was caused by their attending schools of a lesser quality than white students. The report suggested that both in-school factors and home/community factors affect the academic achievement of students and contribute to the achievement gap that exists between races.[33]
The study of the achievement gap can be addressed from two standpoints—from a supply-side and a demand-side viewpoint of education. In Poor Economics, Banerjee and Duflo explain the two families of arguments surrounding education of underserved populations.[34] Demand-side arguments focus on aspects of minority populations that influence education achievement. These include family background and culture, which shape perceptions and expectations surrounding education. A large body of research has been dedicated to studying these factors contributing to the achievement gap. Supply-side arguments focus on the provision of education and resources and the systemic structures in place that perpetuate the achievement gap. These include neighborhoods, funding, and policy. In 2006, Ladson-Billings called on education researchers to move the spotlight of education research from family background to take into account the rest of the factors that affect educational achievement, as explained by the Coleman Report.[35] The concept of opportunity gaps—rather than achievement gaps—has changed the paradigm of education research to assess education from a top-down approach.[36]
Non-Cognitive Factors
Social Belonging
A person's sense of social belonging is one non-cognitive factor that plays a part in the racial achievement gap. Some of the processes that threaten a person's sense of belonging in schools include social stigma, negative intellectual stereotypes, and numeric under-representation.[37]
Walton and Cohen describe three ways in which a sense of social belonging boosts motivation, the first being positive self-image. By adopting similar interests as those who a person considers to be socially significant, it may help to increase or affirm a person's sense of his or her personal worth.[37] People have a basic need to belong, which is why people may feel a sense of distress when social rejection occurs. Students in minority groups have to battle other factors as well, such as peer and friend groups being separated by race. Homogeneous friend groups can segregate people out of important networking connections, thus limiting important future opportunities that non-minority groups have because they have access to these networking connections.[38] Oakland students that come from low socioeconomic families are less likely to attend schools that provide equal education as wealthier schools that come from major American cities. This means that only two of ten students will go to schools that have a closing achievement gap.[39]
Students who do not fall into the majority or dominant group in their schools often worry about whether or not they will belong and find a valued place in their school. Their thoughts are often centered around whether they will be accepted and valued for who they are around their peers.[38] Social rejection can cause reductions in IQ test performance, self-regulation, and also can prompt aggression.[37] People can do more together than they can alone. Social life is a form of collaborative activity, and an important feature of human life. When goals and objectives become shared, they offer a person and the social units he or she is a part of major advantages over if he or she was working alone.[37]
Under performing groups in schools often report that they feel like they do not belong and that they are unhappy a majority of the time. Steele offers an example, explaining an observation done by his colleague, Treisman. It was observed that African American students at Berkeley did their work independently in their rooms with nobody to converse with. They spent most of their time checking answers to their arithmetic in the back of their textbook, weakening their grasp of the concepts themselves. This ultimately caused these students to do worse on tests and assessments than their white peers, creating a frustrating experience and also contributing to the racial achievement gap.[38]
Purpose
When students feel that what they are doing has purpose, they are more likely to succeed academically. Students who identify and actively work towards their individual, purposeful, life goals have a better chance at eliminating disengagement that commonly occurs in middle school and continues into later adolescence.[40] These life goals give students a chance to believe that their school work is done in hopes of achieving larger, more long-term goals that matter to the world. This also gives students the opportunity to feel that their lives have meaning by working towards these goals.[40]
Purposeful life goals, such as work goals, may also increase students motivation to learn. Adolescents may make connections between what they are learning in school and how they will use those skills and knowledge will help them make an impact in the future. This idea ultimately will lead students to create their own goals related to mastering the material they are learning in school.[40]
Adolescents who have goals, and believe that their opinions and voices can impact the world positively, they may become more motivated. They become more committed to mastering concepts and being accountable for their own learning, rather than focusing on getting the highest grade in the class.[40] Students will study more intently and deeply, as well as persist longer, seeking out more challenges. They will like learning more because the tasks they are doing have purpose, creating a personal meaning to them and in turn leading to satisfaction.[40]
Mindset
Students’ mindsets (how they perceive their abilities) play a large role in their achievement and also their motivation. An adolescent's level of self-efficacy is a great predictor of their level of academic performance, going above and beyond a student's measured level of ability and also their prior performance in school.[41] Students having a growth mindset believe that their intelligence can be developed over time. Those with a fixed mindset believe that their intelligence is fixed and cannot grow and develop. Students with growth mindsets tend to outperform their peers who have fixed mindsets.[42]
Students are highly influenced by their teachers in which kind of mindset they develop in school. When people are taught with a growth mindset, the ideas of challenging themselves and putting in more effort follow.[43] People believe that each mindset is better than the other, which causes students to feel that they are not as good as other students in school. A big question that is asked in schooling is when does someone feel smart: when they are flawless or when they are learning? [43] With a fixed mindset, you must be flawless, and not just smart in the classroom. With this mindset, there is even more pressure on students to not only succeed, but to be flawless in front of their peers.[43]
Students who have a fixed mindset, have come to change the idea of failure as an action to an identity.[43] They come to think of the idea of failing something as being that they are a failure and that they cannot achieve something. This links back into how they think of themselves as a person and decreases their motivation in school. This sense of "failure" is especially prominent during adolescence. If one thing goes wrong, one with a fixed mindset will feel that they cannot overcome this small failure, and thus their mindset motivation will decrease.[43]
Education Debt
Education debt is a theory developed by Gloria Ladson-Billings, a pedagogical theorist. In her theory of education debt, she likens the focus of the achievement gap to the United States current focus on the national deficit. She argues that instead the true issue is debt rather than deficit: an education debt to African Americans, Native Americans, and Latino/as. As defined by a colleague of Ladson-Billings, Professor Emeritus Robert Haveman, education debt is the “foregone schooling resources that we could have (should have) been investing in (primarily) low income kids, which deficit leads to a variety of social problems (e.g. crime, low productivity, low wages, low labor force participation) that require on-going public investment”.[44] The education debt has historical, economic, sociopolitical and moral components; the structure of the education debt theory makes is a logical cause of the racial achievement gap.[44]
Historical component
Historical debt is the concept of inequality throughout history that has prevented equal education of minorities. Inequities surrounding education throughout history have been designed to prevent people based on their race, class, and gender from receiving quality education. Disparity in achievement is a result of legislation that has prevented education of minorities, specifically African Americans. After the abolishment of slavery, African Americans were subject to follow the laws of their bitter oppressors. This left African Americans with little to no representation. It was prohibited by law in many places across the United States, specifically the south, for African Americans to attend school. This is an early example in history of education being denied to African Americans. Similarly, the Native American population was prevented from obtaining a quality education. After forced labor and genocides, the remaining population was funneled into boarding schools focused on religious teachings and assimilation into European culture.[44] Native Americans had little to no representation. Latino/as were also denied equal education. In the case Mendez vs. West Minister, Latino fathers challenged the courts as their children, and thousands of others, were victims of racial segregation. Historically, much of the inequalities embedded within legislation was perpetuated by leaders of the country. The falsity that African Americans were unable to be educated was endorsed by Thomas Jefferson, even though he supported the idea of education for all American people.[44] Historic events and legislation are both related to economic debt, in the fact that they both affected the education opportunities of minorities.
Economic component
Economic debt has greatly accumulated from the disparities in school funding. Even after it was deemed unconstitutional for education to be withheld on the basis of race, legislation regarding the allocation of money for public schools was passed regardless of the fact that it left minority school districts with significantly less money than districts of White counterparts. The concept of separate but equal, made constitutional by Plessy vs. Ferguson, allowed a significant of amount of funding disparity to be perpetuated. Although, Plessy vs. Ferguson was overturned, the segregation it caused can still be observed today. Statistics show that Chicago public school spend spend roughly $8,000 a year per child; the population of Chicago public school students is 87% African American and Latino/a. Highland Park school district spends more than double the amount of the Chicago public school district; Highland Park (a neighboring town) public schools has a population of 91% White students.[44] It is important to consider an effect of economic debt; earning ratios. Gloria Ladson-Billings points to the relation of level of schoolings and earning ratios. Higher level of income is related to a higher level of education data suggests.[44] From a spending perspective, the average white graduate has an advantage over their African American or Black peers. The average White student completes college at a school that spends over $11,000 per student, while the average Black student completes college at a school that spends under $10,000 per student. With 2,000 undergraduates with a bachelor's degree that spends the average amount of granting intuition, the spending gap difference each year at a typical school is roughly about $2 million.[45]
Sociopolitical component
Sociopolitical debt “is the degree to which communities of color are excluded from the civic process” (Landson-Billings 2006).[44] The civic process includes refers to the engagement of conversation or activity that addresses issues or concerns within society. Disenfranchisement of voting rights contributed to and continues to contribute to sociopolitical debt. With little to no access to franchise, African American, Latino/a, and Native American communities received no representation or legislation that reflected their issues and concerns. These groups were often excluded from legislation and conversation concerning education which did not allow them to advocate for the equal education. An example of the mitigation of sociopolitical debt is the Voting Rights Act of 1965. This piece of legislation ensured a voice to minorities within the political sphere. No such legislation has been passed that focuses on diminishing education inequalities. Affirmative action is the closest legislation that has had a strong impact.[44] Although affirmative action benefited White women the most, observations show that the emergence of the Black middle class was aided by the policy (Bowen and Bok 1999). Members of the Black middle class and other minority groups continue to fight for change in education despite being silenced.[46] The sociopolitical debt has limited access to resources such as policy makers and law experts; disadvantages as these do not allow for the gain of political capital needed to enact change.
Moral component
Moral debt is the final component of the education debt and “reflects disparity between what we know is right and what we actually do” (Ladson-Billings).[44] Moral debt is expressed as the lack of honor given when honor is due. There is no hesitation in giving honor to Martin Luther King Jr. or Rosa Parks. Another example of repaying moral debt are the reparations placed on Germany after WWII.[44] Debate is happening on the basis of moral debt, reparations and success but much of the debate focuses on the individual and the responsibility of the individual to ensure success. “No nation can enslave a race of people for hundreds of years, set them free bedraggled and penniless, pit them, without assistance in a hostile environment, against privileged victimizers, and then reasonably expect the gap between the heirs of the two groups to narrow. Lines, begun parallel and left alone, can never touch.” Randall Robinson states.[47] Individual responsibility becomes an unrealistic expectation when a group has been exploited, disenfranchised and oppressed for centuries.
Domestic contributions
Children can differ in their readiness to learn before they enter school.[33] Research has shown that parental involvement in a child's development has a significant effect on the educational achievement of minority children.[48] According to sociologist Annette Lareau, differences in parenting styles can affect a child's future achievement. In her book Unequal Childhoods, she argues that there are two main types of parenting: concerted cultivation and the achievement of natural growth.
- Concerted cultivation is usually practiced by middle-class parents, regardless of their race. These parents are more likely to be involved in their children's education, encourage their children's participation in extracurricular activities or sports teams, and to teach their children how to successfully communicate with authority figures. These communication skills give children a form of social capital that help them communicate their needs and negotiate with adults throughout their life.
- The achievement of natural growth is generally practiced by poor and working-class families. These parents generally do not play as large a role in their children's education, their children are less likely to participate in extracurriculars or sports teams, and they usually do not teach their children the communication skills that middle- and upper-class children have. Instead, these parents are more concerned that their children obey authority figures and have respect for authority, which are two characteristics that are important to have in order to succeed in working-class jobs.[49]
The parenting practices that a child is raised with influences their future educational achievement. However, parenting styles are heavily influenced by the parents' and family's social, economic, and physical circumstances. In particular, immigration status (if applicable), education level, incomes, and occupations influence the degree of parental involvement their children's academic achievement.[50] These factors directly determine the access of the parents to time and resources to dedicate to their children's development. These factors also indirectly determine the home environment and parents' educational expectations of their children.[51] For example, children from poor families have lower academic performance in kindergarten than children from middle to upper-class backgrounds, but children from poor families who had cognitively stimulating materials in the home demonstrated higher rates of academic achievement in kindergarten. Additionally, parents of children living in poverty are less likely to have cognitively stimulating materials in the home for their children and are less likely to be involved in their child's school.[52] The quality of language that the student uses is affected by family's socioeconomic backgrounds, which is another factor in the academic achievement gap.[53]
Income
In the United States socioeconomic status of families affects children schooling.[54] Sociologist Laura Perry found what she calls ‘Student Socioeconomic Status’ has the third strongest influence on educational outcomes in the United States out of nations within this study and it ranked sixth in influence of equity differences among schools.[55] These families are more susceptible to multidimensional poverty, meaning the three dimensions of poverty, health, education, and standard of living are interconnected to give an overall assessment of a nations poverty.
Some researchers, such as Katherine Paschall, argue that family income plays more of a factor in the academic achievement gap than race/ethnicity.[56] However, other studies find that the racial gaps persists between families of different race and ethnicity, and have similar income. When comparing White students from families with incomes below $10,000 they had a mean SAT test score that was 61 points higher than African American students whose families had incomes between $80,000 and $100,000.[57] Which means there are more contributing factors than just economic status.
Cultural differences
Some experts believe that cultural factors contribute to the racial achievement gap. Students from minority cultures face language barriers, differences in cultural norms in interactions, learning styles, varying levels of receptiveness of their culture to White American culture, and varying levels of acceptance of the White American culture by the students. In particular, it has been found that minority students from cultures with views that generally do not align with the mainstream cultural views have a harder time in school.[58] Furthermore, views of the value of education differ by minority groups as well as members within each group. Both Hispanic and African-American youths often receive mixed messages about the importance of education, and often end up performing below their academic potential.[59]
Latino American
Many Hispanic parents who immigrate to The United States see a high school diploma as being a sufficient amount of schooling and may not stress the importance of continuing on to college. Parental discouragement from pursuing higher education tends to be based on the notion of "we made it without formal schooling, so you can too". Additionally, depending on the immigration generation and economic status of the student, some students prioritize their obligations to assisting their family over their educational aspirations. Poor economic circumstances place greater pressure on the students to sacrifice time spent working towards educational attainment in order to dedicate more time to help support the family. Surveys have shown that while Latino American families would like their children to have a formal education, they also place high value on getting jobs, marrying, and having children as early as possible, all of which conflict with the goal of educational achievement.[60][61] However, counselors and teachers usually promote continuing on to college. This message conflicts with the one being sent to Hispanic students by their families and can negatively affect the motivation of Hispanic students, as evidenced by the fact that Latinos have the lowest college attendance rates of any racial/ethnic group.[59] Overall, Latino American students face barriers such as financial stability and insufficient support for higher education within their families. Reading to children when they are younger increases literacy comprehension, which is a fundamental concept in the education system; however, it is less likely to occur within Latino American families because many parents do not have any formal education. Currently, Latino Americans over the age of 25 have the lowest percentage in obtaining a bachelor's degree or higher amongst all other racial groups; while only having 11 percent.[62]
African American
African American students are also likely to receive different messages about the importance of education from their peer group and from their parents. Many young African-Americans are told by their parents to concentrate on school and do well academically, which is similar to the message that many middle-class white students receive. However, the peers of African-American students are more likely to place less emphasis on education, sometimes accusing studious African-American students of "acting white." This causes problems for black students who want to pursue higher levels of education, forcing some to hide their study or homework habits from their peers and perform below their academic potential.[59]
Asian American
Asian American students are more likely to view education as a means to social mobility, as they believe it provides a means to overcome language barriers as well as discrimination. This notion comes from parental expectations of their children, which are rooted in the cultural belief that hard work is the key to educational and eventually occupational attainment. Many Asian Americans immigrated to the United States voluntarily, in search for better opportunities. This immigration status comes into play when assessing the cultural views of Asian Americans since attitudes of more recent immigration are associated with optimistic views about the correlation between hard work and success. Obstacles such as language barriers and acceptance of White American culture are more easily overcome by voluntary immigrants since their expectations of attaining better opportunities in the United States influence their interactions and experiences.[63] Students that identify as Asian American believe that having a good education would also help them speak out against racism based on the model-minority stereotype.[64]
Funding
Geography and Funding Policy
The quality of school that a student attends and the socioeconomic status of the student's residential neighborhood are two factors that can affect a student's academic performance.
In the United States, only 8% of public education funding comes from the federal government. The other 92% comes from local, state, and private sources.[65] Local funding is consider unequal as it is based on property taxes. So those who are in areas in which there is lower property value, have less funded schools. Making schools unequal within a district.[65][66] This system means that schools located in areas with lower real estate values have proportionately less money to spend per pupil than schools located in areas with higher real estate values. This system has also maintained a "funding segregation:" because minority students are much more likely to live in a neighborhood with lower property values, they are much more likely to attend a school that receives significantly lower funding.[66]
Data from research shows that when the quality of the school is better and students are given more resources, it affects the racial achievement gap by reducing it. When white and black schools were given the equal amount of resources, it shows that black students started improving while white students stayed the same because they didn't need the resources. This showed that lack of resources is a factor in the racial achievement gap.[67] The research that was conducted shows that predominantly white schools have more resources than black schools. However, lack of resources is only a small effect on academic achievement in comparison to students’ family backgrounds.[53]
Using property taxes to fund public schools contributes to school inequality. Lower-funded schools are more likely to have (1) lower-paid teachers; (2) higher student-teacher ratios, meaning less individual attention for each student; (3) older books; (4) fewer extracurricular activities, which have been shown to increase academic achievement; (5) poorly maintained school buildings and grounds; and (6) less access to services like school nursing and social workers. All of these factors can affect student performance and perpetuate inequalities between students of different races.[68]
Living in a high-poverty or disadvantaged neighborhood have been shown to negatively influence educational aspirations and consequently attainment. The Moving to Opportunity experiment showed that moving to a low-poverty neighborhood had a positive effect on the educational attainment of minority adolescents. The school characteristics associated with the low-poverty neighborhoods proved to be effective mediators, since low-poverty neighborhoods tended to have more favorable school composition, safety, and quality.[69] Additionally, living in a neighborhood with economic and social inequalities leads to negative attitudes and more problematic behavior due to and social tensions.[70] Greater college aspirations have been correlated with more social cohesiveness among neighborhood youth, since community support from both youth and adults in the neighborhood tends to have a positive influence on educational aspirations.[71] Some researchers believe that vouchers should be given to low income students so they can go to school in other places. However, other researchers believe that the idea of vouchers promotes equality and doesn't eliminate it.[53]
Racial and ethnic residential segregation in the United States still persists, with African Americans experiencing the highest degree of residential segregation, followed by Latino Americans and Asian Americans and Pacific Islanders.[72] This isolation from White American communities is highly correlated with low property values and high-poverty neighborhoods. This issue is propagated by issues of home ownership facing minorities, especially African Americans and Latino Americans, since residential areas predominantly populated by these minority groups are perceived as less attractive in the housing market. Home ownership by minority groups is further undermined by institutionalized discriminatory practices, such as differential treatment of African Americans and Latino Americans in the housing market compared with White Americans. Higher mortgages charged to African American or Latino American buyers make it more difficult for members of these minority groups to attain full home ownership and accumulate wealth. As a result, African American and Latino American groups continue to live in racially segregated neighborhoods and face the socioeconomic consequences of residential segregation.[73][74]
Differences in the academic performance of African-American and White students exist even in schools that are desegregated and diverse, and studies have shown that a school's racial mix does not seem to have much effect on changes in reading scores after sixth grade, or on math scores at any age.[75] In fact, minority students in segregated-minority schools have more optimism and greater educational aspirations as well as achievements than minority students in segregated-white schools. This can be attributed to various factors, including the attitudes of faculty and staff at segregated-white schools and the effect of stereotype threat.[76]
Refugees
Part of the racial achievement gap can be attributed to the experience of the refugee population in the United States. Refugee groups in particular face obstacles such as cultural and language barriers and discrimination, in addition to premigration stresses. These factors affect how successfully refugee children can assimilate to and succeed in the United States.[77] Furthermore, it has been shown that immigrant children from politically unstable countries do not perform as well as immigrant children from politically stable countries.[78]
Implications of the achievement gap
Economic outcomes
The racial achievement gap has consequences on the life outcomes of minority students. However, this gap also has the potential for negative implications for American society as a whole, especially in terms of workforce quality and the competitiveness of the American economy.[79] As the economy has become more globalized and the United States' economy has shifted away from manufacturing and towards a knowledge-based economy; education has become an increasingly important determinate of economic success and prosperity. A strong education is now essential for preparing and training the future workforce that is able to compete in the global economy. Education is also important for attaining jobs and a stable career, which is critical for breaking the cycle of poverty and securing a sound economic future, both individually and as a nation. Students with lower achievement are more likely to drop out of high school, entering the workforce with minimal training and skills, and subsequently earning substantially less than those with more education. Therefore, eliminating the racial achievement gap and improving the achievement of minority students will help eliminate economic disparities and ensure that America's future workforce is well prepared to be productive and competitive citizens.[80]
Reducing the racial achievement gap is especially important because the United States is becoming an increasingly diverse country. The percentage of African-American and Hispanic students in school is increasing: in 1970, African-Americans and Hispanics made up 15% of the school-age population, and that number had increased to 30% by 2000. It is expected that minority students will represent the majority of school enrollments by 2015.[81] Minorities make up a growing share of America's future workforce; therefore, the United States' economic competitiveness depends heavily on closing the racial achievement gap.[80]
The racial achievement gap affects the volume and quality of human capital, which is also reflected through calculations of GDP. The cost of racial achievement gap accounts for 2–4 percent of the 2008 GDP. This percentage is likely to increase as blacks and Hispanics continue to account for a higher proportion of the population and workforce. Furthermore, it was estimated that $310 billion would be added to the US economy by 2020 if minority students graduated at the same rate as white students.[82] Even more substantial is the narrowing of educational achievement levels in the US compared to those of higher-achieving nations, such as Finland and Korea. McKinsey & Company estimate a $1.3 trillion to $2.3 trillion, or a 9 to 16 percent difference in GDP.[83] Furthermore, if high school dropouts were to cut in half, over $45 billion would be added in savings and additional revenue. In a single high school class, halving the dropout rate would be able to support over 54,000 new jobs, and increase GDP by as much as $9.6 billion.[84] Overall, the cost of high school drop outs on the US economy is roughly $355 billion.
$3.7 billion would be saved on community college remediation costs and lost earnings if all high school students were ready for college. Furthermore, if high school graduation rates for males raised by 5 percent, cutting back on crime spending and increasing earnings each year would lead to an $8 billion increase the US economy.[82]
Job opportunities
As the United States' economy has moved towards a globalized knowledge-based economy, education has become even more important for attaining jobs and a stable career, which is critical for breaking the cycle of poverty and securing a sound economic future. The racial achievement gap can hinder job attainment and social mobility for minority students. The United States Census Bureau reported $62,545 as the median income of White families, $38,409 of Black families, and $39,730 for Hispanic families.[85] And while the median income of Asian families is $75,027, the number of people working in these households is usually greater than that in White American families.[86] The difference in income levels relate highly to educational opportunities between various groups.[87] Students who drop out of high school as a result of the racial achievement gap demonstrate difficulty in the job market. The median income of young adults who do not finish high school is about $21,000, compared to the $30,000 of those who have at least earned a high school credential. This translates into a difference of $630,000 in the course of a lifetime.[88] Students who are not accepted or decide not to attend college as a result of the racial achievement gap may forgo over $450,000 in lifetime earnings had they earned a Bachelor of Arts degree.[89] In 2009, $36,000 was the median income for those with an associate degree was, $45,000 for those with a bachelor's degree, $60,000 for those with a master's degree or higher.[90]
Stereotype threat
Beyond differences in earnings, minority students also experience stereotype threat that negatively affects performance through activation of salient racial stereotypes. The stereotype threat both perpetuates and is caused by the achievement gap.[91] Furthermore, students of low academic performance demonstrate low expectations for themselves and self-handicapping tendencies.[92] Psychologists Claude Steele, Joshua Aronson, and Steven Spencer, have found that Microaggression such as passing reminders that someone belongs to one group or another (i.e.: a group stereotyped as inferior in academics) can affect test performance.[93]
Steele, Aronson and Spencer, have examined and performed experiments to see how stereotypes can threaten how students evaluate themselves, which then alters academic identity and intellectual performance. Steele tested the stereotype threat theory by giving Black and White college students a half-hour test using difficult questions from the verbal Graduate Record Examination (GRE). In the stereotype-threat condition, they told students the test diagnosed intellectual ability. In saying that the test diagnoses intellectual ability it can potentially elicit the stereotype that Blacks are less intelligent than Whites. In the no-stereotype-threat condition, they told students that the test was a problem-solving lab task that said nothing about ability. This made stereotypes irrelevant. In the stereotype threat condition, Blacks who were evenly matched with Whites in their group by SAT scores, performed worse compared to their White counterparts. In the experiments with no stereotype threat, Blacks performed slightly better than in those with a stereotype threat, though still significantly worse than whites. Aronson believes the study of stereotype threat offers some "exciting and encouraging answers to these old questions [of achievement gaps] by looking at the psychology of stigma -- the way human beings respond to negative stereotypes about their racial or gender group".[93]
Political representation
Another consequence of the racial achievement gap can be seen in the lack of representation of minority groups in public office. Studies have shown that higher socioeconomic status—in terms of income, occupation, and/or educational attainment—is correlated with higher participation in politics.[94] This participation is defined as "individual or collective action at the national or local level that supports or opposes state structures, authorities, and/or decisions regarding allocation of public goods";[95] this action ranges from engaging in activities such as voting in elections to running for public office.
Since median income per capita for minority groups(Except Asians) is lower than that of White Americans, and since minority groups(Except Asians) are more likely to occupy less gainful employment and achieve lower education levels, there is a lowered likelihood of political participation among minority groups. Education attainment is highly correlated with earnings and occupation.[90][96] And there is a proven disparity between educational attainment of White Americans and minority groups, with only 30% of bachelor's degrees awarded in 2009 to minority groups.[97] Thus socioeconomic status—and therefore political participation—is correlated with race.[86] Research has shown that African Americans, Latino Americans, and Asian Americans are less politically active, by varying degrees, than White Americans.[98][99]
A consequence of underrepresentation of minority groups in leadership is incongruence between policy and community needs. A study conducted by Kenneth J. Meier and Robert E. England of 82 of the largest urban school districts in the United States showed that African American membership on the school board of these districts led to more policies encouraging more African American inclusion in policy considerations.[100] It has been shown that both passive and active representation of minority groups serves to align constituent policy preference and representation of these opinions, and thereby facilitate political empowerment of these groups.[101]
Special programs
Achievement gaps among students may also manifest themselves in the racial and ethnic composition of special education and gifted education programs. Typically, African American and Hispanic students are enrolled in greater numbers in special education programs than their numbers would indicate in most populations, while these groups are underrepresented in gifted programs.[102][103] Research shows that these disproportionate enrollment trends may be a consequence of the differences in educational achievement among groups.[104]
Efforts to narrow the achievement gap
The United States has seen a variety of different attempts to narrow the racial achievement gap. These attempts include focusing on the importance of early childhood education, using federal standards based reforms, and implementing institutional changes. Despite the fact that there are efforts to narrow the achievement gap, the consequences of the achievement gap will still be felt for many years. For instance, The Oakland achievement gap grew by 11 percent between 2011 and 2013. This rate is alarming because it is a quicker pace than 80 percent of other major nationwide cities. This means that Oakland's achievement gap is larger than half of California's cities.[105]
Early childhood education
There are large cognitive and emotional gaps that form at early ages. They persist throughout childhood and strongly influence adult outcomes.[106] The gaps originate before formal schooling begins and persists through childhood and into adulthood. Remediating the problems created by the gaps is not as cost effective as preventing them at the outset.[107] Eight psychologists performed an experiment of infant children born in Quebec in 1997/1998 and followed annually until 7 years of age. Children receiving formal childcare were distinguished from those receiving informal childcare. Children of mothers with low levels of education showed a consistent pattern of lower scores on academic readiness and achievement tests at 6 and 7 years than those of highly educated mothers, unless they received formal childcare. The findings provide further evidence suggesting that formal childcare could represent a preventative means of attenuating effects of disadvantage on children's early academic trajectory. Economic research shows that investment at this stage is both more effective and cost effective than interventions later in a child's life.[108] An evaluation of Chicago Public Schools' federally funded Child Parent Centers find that for every $1 invested in the preschool program, nearly $11 is projected to return to society over the participants' lifetimes. This amount is equivalent to an 18% annual return.[109]
Head Start Program, Title I of the Elementary and Secondary Education Act (ESEA), and various state-funded pre-kindergarten programs target students from low-income families in an attempt to equal the playing field for these children before school begins. The evidence in favor of investing in early childhood education as a means of closing the achievement gap is strong: various studies have a positive and long-lasting effect on academic achievement of low-income and minority students. Evaluations of Head Start have reported positive results. However, fade-out effects were found in Head Start
Critics question whether an emphasis on early childhood education will benefit long-term kindergarten through 12th grade learning. Critics point to fade-out effects found in Head Start.[110] Adam Schaeffer, a policy analyst with the Cato Institute highlights research shows that students make some gains in the first two years after preschool but it fades out after.[111] Recent literature also reveals positive, short-term effects of early childhood education on children's development that weaken over time.[112] Even more substantial is the narrowing of educational achievement levels in the US compared to those of higher-achieving nations, such as Finland and Korea. McKinsey & Company estimate a $1.3 trillion to $2.3 trillion, or a 9 to 16 percent difference in GDP. However, Mary Ellen McGuire, an education policy director at think tank New America Foundations, pointed out that early childhood education isn't intended to be a silver-bullet fix to the educational system. It is merely one aspect.[112] In order for those effects to last high-quality early childhood education needs to be connected to high-quality elementary schools.
Standards-based reform
Standards-based reform has been a popular strategy used to try to eliminate the achievement gap in recent years. The goal of this reform strategy is to raise the educational achievement of all students, not just minorities. Many states have adopted higher standards for student achievement. This type of reform focuses on scores on standardized tests, and these scores show that a disproportionate share of the students who are not meeting state achievement standards are Hispanic and African-American. Therefore, it is not enough for minorities to improve just as much as Whites do—they must make greater educational gains in order to close the gap.[80]
Goals 2000
One example of standards-based reform was Goals 2000, also known as the Educate America Act. Goals 2000 was enacted in 1994 by President Clinton and allowed the federal government a new role in its support for education. It aimed to "provide a framework for meeting the National Education Goals".[113] It was designed to provide resources to states and communities to make sure that all students achieved their full potential by the year 2000. This program set forth eight goals for American students, including all children in America will start school ready to learn, increasing the high school graduation rate to at least 90%, and increasing the standing of American students to first in the world in achievement in math and science. Goals 2000 also placed an emphasis on the importance of technology, promising that all teachers would have modern computers in their classroom and that effective software would be an integral part of the curriculum in every school. President George Bush's No Child Left Behind Act essentially replaced the Goals 2000 program.[113]
No Child Left Behind
The No Child Left Behind Act(NCLB) legislation was signed by President Bush in January 2002 and dramatically expanded federal influence over the nation's more than 90,000 public schools. The main implications of this legislation was states had to conduct annual student assessments linked to state standards to identify schools failing to make "adequate yearly progress" (AYP) toward the stated goal of having all students achieve proficiency in reading and math by 2013–2014 and to institute sanctions and rewards based on each school's AYP status.[114] One of the motivations for this reform is that publicizing detailed information on school-specific performance and linking that "high-stakes" test performance to the possibility of sanctions will improve the focus and productivity of public schools. However, critics charge that test-based school accountability has several negative consequences for the broad cognitive development of children.[115]
Critics argue that NCLB and other test-based accountability policies cause educators to shift resources away from important but non-tested subjects and to focus instruction in math and reading on the relatively narrow set of topics that are most heavily represented on the high-stakes tests. Some even suggest that high-stakes testing may lead school personnel to intentionally manipulate student test scores.[114]
NCLB has shown mixed success in eliminating the racial achievement gap. Although test scores are improving, they are improving equally for all races, which means that minority students are still behind whites. There has also been some criticism as to whether an increase in test scores actually corresponds to improvements in education, since test standards vary from state to state and from year to year.[116]
Institutional changes
Research has shown that making certain changes within schools can improve the performance of minority students. These include lowering class size in schools with a large population of minority students; expanding access to high-quality preschool programs to minority families;[80] and focus on teaching the critical thinking and problem-solving skills that are necessary to retain high-level information.[75]
Charter schools
In the United States there are now 5,042 charter schools serving 1.5 million students in 39 states and Washington, D.C.[117] Although they serve only a fraction of the nation's public school students, charter schools have seized a prominent role in education today. The question of whether charters or traditional public schools do a better job of educating students is still open to debate. The research is highly mixed due the complexities of comparison and wide performance differences among charters.[117]
Charter schools are by definition independent public schools. Although funded with taxpayer dollars, they operate free from many of the laws and regulations that govern traditional public schools. In exchange for that freedom, they are bound to the terms of a contract, or "charter," that lays out a school's mission, academic goals, and accountability procedures.[117] The average charter school enrollment is 372, compared with about 478 in all public schools. Researchers have linked small schools with higher achievement, more individualized instruction, greater safety, and increased student involvement.[117] With their relative autonomy, charter schools are also seen as a way to provide greater educational choice and innovation within the public school system. Another attraction of charter schools is that they often have specialized educational programs. Charters frequently take alternative curricular approaches, emphasize particular fields of study or serve special populations of students. That growth of charter schools has been particularly strong in cities. More than 55 percent of public charter schools were in urban settings. [118] Some charters have high concentrations of minority students because demand for schooling alternatives is highest among such students, whom they say are often poorly served by the traditional public school systems. Lastly, another positive argument for charter schools is that they improve the existing school systems through choice and competition.[118]
However, there are some criticisms of charter schools. There is a high variability in the quality and success of charter schools across the nation. A high-profile report from the American Federation of Teachers (2002), for example, argued that many charter school authorizers have failed to hold the administrators and teachers accountable, leaving some students to languish in low-performing schools.[119] Another concern of critics is that charters are more racially segregated than traditional public schools, thus denying students the educational "benefits associated with attending diverse schools".[120] Skeptics also worry that charter schools unfairly divert resources and policy attention from regular public schools.
Taken together, studies about charter schools are inconclusive and have mixed results. Studies by the Goldwater Institute and California State University-Los Angeles found that students in charter schools show higher growth in achievement than their counterparts in traditional public schools.[118] However, another study by the Institute of Race and Poverty at the University of Minnesota Law show that after two decades of experience, most charter schools in the Twin Cities still underperform comparable traditional public schools and are highly segregated by race and income.[121]
Non-English schools
To evade a shift to English, some Native American tribes have initiated language immersion schools for children, where a native Indian language is the medium of instruction. For example, the Cherokee Nation instigated a 10-year language preservation plan that involved growing new fluent speakers of the Cherokee language from childhood on up through school immersion programs as well as a collaborative community effort to continue to use the language at home.[122] This plan was part of an ambitious goal that in 50 years, 80% or more of the Cherokee people will be fluent in the language.[123] The Cherokee Preservation Foundation has invested $3 million into opening schools, training teachers, and developing curricula for language education, as well as initiating community gatherings where the language can be actively used.[123] Formed in 2006, the Kituwah Preservation & Education Program (KPEP) on the Qualla Boundary focuses on language immersion programs for children from birth to fifth grade, developing cultural resources for the general public and community language programs to foster the Cherokee language among adults.[124]
There is also a Cherokee language immersion school in Tahlequah, Oklahoma that educates students from pre-school through eighth grade.[125] Because Oklahoma's official language is English, Cherokee immersion students are hindered when taking state-mandated tests because they have little competence in English.[126] The Department of Education of Oklahoma said that in 2012 state tests: 11% of the school's sixth-graders showed proficiency in math, and 25% showed proficiency in reading; 31% of the seventh-graders showed proficiency in math, and 87% showed proficiency in reading; 50% of the eighth-graders showed proficiency in math, and 78% showed proficiency in reading.[126] The Oklahoma Department of Education listed the charter school as a Targeted Intervention school, meaning the school was identified as a low-performing school but has not so that it was a Priority School.[126] Ultimately, the school made a C, or a 2.33 grade point average on the state's A-F report card system.[126] The report card shows the school getting an F in mathematics achievement and mathematics growth, a C in social studies achievement, a D in reading achievement, and an A in reading growth and student attendance.[126] "The C we made is tremendous," said school principal Holly Davis, "[t]here is no English instruction in our school's younger grades, and we gave them this test in English."[126] She said she had anticipated the low grade because it was the school's first year as a state-funded charter school, and many students had difficulty with English.[126] Eighth graders who graduate from the Tahlequah immersion school are fluent speakers of the language, and they usually go on to attend Sequoyah High School where classes are taught in both English and Cherokee.
Private schools
Private schools are another institution used in attempt to narrow the racial achievement gap. A disparity between achievement gaps in private and public schools can be seen using a U.S. Department of Education database to compute the average National Assessment of Educational Progress test score differences between black students and white students in both public and private schools.
| NAEP Test Subject | Year | 4th Grade Gap (Public) | 12th Grade Gap (Public) | Percent Difference* Between 4th and 12th Grade Gaps (Public) | 4th Grade Gap (Private) | 12th Grade Gap (Private) | Percent Difference* Between 4th and 12th Grade Gaps (Private) |
|---|---|---|---|---|---|---|---|
| Reading | 2002 | 29 | 25 | -13.8 | 27 | 14 | -48.1 |
| Writing | 2002 | 20 | 23 | 15 | 22 | 18 | -18.2 |
| Math | 2000 | 30 | 33 | 10 | 28 | 23 | -17.9 |
| Science | 2001 | 35 | 31 | -11.4 | 27 | 20 | -25.9 |
The table on White/Black NAEP Achievement Differences for Public and Private Schools above, shows a sizeable achievement gap between black and white fourth-graders in both public and private schools. However, the private-sector achievement gap is narrower in the 12th grade than the fourth grade for all of the core NAEP subjects. Public schools, on the other hand, see a larger gap in both writing and mathematics at the 12th-grade level than at the fourth. Averaged across subjects, the public school racial achievement gap is virtually unchanged between fourth and 12th grades, while the gap in private schools is an average of 27.5 percentage points smaller in the 12th grade than the fourth.
The achievement gap closes faster in private schools not because white private school students lose ground with respect to white public school students as they move to higher grades, but because black private school students learn at a substantially higher rate than black public school students. Economist Derek Neal has found that black students attending urban private schools are far more likely to complete high school, gain admission to college, and complete college than similar students in urban public schools.[127] Similarly, in a study comparing graduation rates of all Milwaukee public school students (of all income levels) with those of the low-income participants in the city's private school voucher program, Manhattan Institute Senior Fellow Jay Greene found the voucher students were more than one-and-a-half-times as likely to graduate as public school students.[127]
However, others argue that private schools actually perpetuate and exacerbate the achievement gap. Without controlling for student background differences, private schools scored higher than public schools. However, a study showed that demographic differences between students in public and private schools more than account for the relatively high scores of private schools. In fact, after controlling for these differences, the advantageous "private school effect" disappears and even reverses in most cases.[128] Private schools have selective acceptance and a different demographic. Another criticism is that private schools only serve a small percent of the population and therefore cannot make a huge effect on closing the achievement gap.
Greg Wiggan believes that although there is a lot of research on the topic of the racial achievement gap, there is a gap in the research. Wiggan believes that the gap that is missing is the research of the perspective of the students, specifically high-achieving Black students in private schools.[53]
Teach For America
Teach for America (TFA) recruits and selects graduates from some of the top colleges and universities across the country to teach in the nation's most challenging K-12 schools throughout the nation. It began in 1990 with 500 teachers and has since expanded to over 4,000 teacher placements in 2010.[129] In the Journal of Policy Analysis and Management they use individual-level student data linked to teacher data in North Carolina to estimate the effects of having a TFA teacher compared to a traditional teacher. According to studies about the effect of different teacher-preparation programs in Louisiana, North Carolina, and Tennessee, TFA is among the most effective sources of new teachers in low-income communities. Each of these statewide studies, conducted between 2009 and 2012, found that corps members often help their students achieve academic gains at rates equal to or larger than those for students of more veteran teachers.[130] The findings show that TFA teachers are in general more effective, according to student exam scores, than traditional teachers that would be in the classroom in their stead.[129] These estimates demonstrate that, compared with traditional teachers with similar levels of experience, TFA teachers have strong positive effects on student test scores. And despite the limitations of TFA teachers, they are no worse than average traditional teachers in teaching math subjects and much more effective in teaching science subjects.
Although TFA teachers tend to have stronger academic credentials, they have not been taught in traditional training programs, are more likely to teach for a few years, and are assigned to some of the most challenging schools in the country.[131] Given these differences, the TFA program has been controversial. Critics of Teach For America point out two of the major problems. The first is that most TFA teachers have not received traditional teacher training. TFA corps members participate in an intensive five-week summer national institute and a two-week local orientation and induction program prior to their first teaching assignment, and therefore some argued they are not as prepared for the demands of the classroom as traditionally trained teachers. The second criticism is that TFA requires only a two-year teaching commitment, and the majority of corps members leave at the end of that commitment. The short tenure of TFA teachers is troubling because research shows that new teachers are generally less effective than more experienced teachers.[129]
Interventions fon Non-Cognitive Factors
Many different types of interventions can be done to help students who are a part of a negative stereotype, but a self-affirmation intervention would be the most helpful for students academic performance.[132] This intervention was expected to help improve a group of students who are at risk to intervene with the group's academic performance. This intervention was tested in two different double-blind field experiences, and then compared.[132] One of the things seen was that African American students who were a part of the control condition, who saw their performance declining early in the term, their performance did not improve as the term went on, and in fact it got worse.[132] One thing that could lead to a slight improvement is having a small reduction in the psychological threats. Small interventions were seen to have a greater effect when they were carried out in multiple trials, different times. Having just one intervention one time does not have a positive effect on a student, rather if there are multiple smaller interventions carried out different times.
See also
- Achievement gap in the United States
- Education in the United States
- Knowledge is Power Program
- Racial inequality in the United States
- Racial segregation in the United States § Education
- YES Prep Public Schools
References
- Langham, Barbara A. "The achievement gap: What early childhood educators need to know" (PDF).
- Ansell, Susan. "Achievement Gap". Education Week.
- Perrillo, Jonna (2012). Uncivil Rights : Teachers, Unions, and race in the battle for school equity. University of chicago press.
- Kober, Nancy. (2001). It Takes More Than Testing Closing the Achievement Gap. A Report of the Center on Education Policy. Distributed by ERIC Clearinghouse. OCLC 1062989819.
- Verba, Sidney. (1987, ©1972). Participation in America : political democracy and social equality. Nie, Norman H. (University of Chicago Press ed.). Chicago: University of Chicago Press. ISBN 0-226-85296-2. OCLC 15589820. Check date values in:
|date=(help) - "Ethnic and Racial Minorities & Socioeconomic Status". 2008. doi:10.1037/e544902011-001. Cite journal requires
|journal=(help) - Reardon, S. F.; Galindo, C. (2009). "The Hispanic-White Achievement Gap in Math and Reading in the Elementary Grades". American Educational Research Journal. 46 (3): 853–91. doi:10.3102/0002831209333184.
- St. Mary, Jason (2018). "Perceptions of Academic Achievement and Educational Opportunities Among Black and African American Youth". Child & Adolescent Social Work Journal. 35 (5): 499–509. doi:10.1007/s10560-018-0538-4.
- "Download Limit Exceeded". citeseerx.ist.psu.edu. Retrieved 2018-12-18.
- Clotfelter, Charles T.; Ladd, Helen F.; Vigdor, Jacob L. (2009). "The Academic Achievement Gap in Grades 3 to 8" (PDF). Review of Economics and Statistics. 91 (2): 398–419. doi:10.1162/rest.91.2.398.
- Logerfo, Laura, Austin Nichols, and Sean Reardon. 2006. "Achievement Gains in Elementary and High School." Washington, DC: The Urban Institute.
- Camara, W.J., & Schmidt, A.E. (1999). Group differences in standardized testing and social stratification (College Board Report No. 99-5). New York: The College Board.
- Hedges, L.V., & Nowell, A. (1998). Black-white test score convergence since 1965. In C. Jencks & M. Phillips (Eds.), The black-white test score gap. (149–81). Washington, DC: The Brookings Institution
- "Scores on new SAT show large gaps by race and ethnicity".
- "Asians outshine Whites, Blacks, Hispanics in Math, Writing: SAT".
- Alan Vanneman, Linda Hamilton, Janet Baldwin Anderson, Taslima Rahman (2009). Achievement Gaps: How Black and White Students in Public Schools Perform in Mathematics and Reading on the National Assessment of Educational Progress. NCES
- Hemphill, F., Vanneman, A., Rahman, T. (2011). How Hispanic and White Students in Public Schools Perform in Mathematics and Reading on the National Assessment of Educational Progress. NCES.
- Scott, Leslie A.; and Ingels, Steven J. (2007). Interpreting 12th-Graders' NAEP-Scaled Mathematics Performance Using High School Predictors and Postsecondary Outcomes From the National Education Longitudinal Study of 1988 (NELS:88)
- Natl. Cent. Educ. Stat. 1997. Digest of Education Statistics. U.S. Dep. Educ.: Off. Educ. Res. Improv.
- "Policy Alert". The national center for public policy and higher education. Retrieved November 2005. Check date values in:
|accessdate=(help) - CEPA, Stanford. "Racial and Ethnic Achievement Gaps". Center for Education Policy Analysis. Retrieved 2018. Check date values in:
|accessdate=(help) - We Learn, Divided. [hechingerreport.org/facts-about-race-and-college-admission/ "Facts about race and college admission"] Check
|url=value (help). The Hechinger report. Jon Marcus. Retrieved July 6, 2018. - We Learn, Divided. [hechingerreport.org/facts-about-race-and-college-admission/ "Facts about race and college admission"] Check
|url=value (help). The Hechinger report. Jon Marcus. Retrieved July 6, 2018. - Miller LS. 1995. An American Imperative: Accelerating Minority Educational Advancement. New Haven: Yale Univ. Press
- "Race gaps in SAT scores highlight inequality and hinder upward mobility". February 2017.
- U.S. Department of Education, National Center for Education Statistics. (2011). The Condition of Education 2011 (NCES 2011-033), Indicator 21.
- U.S. Department of Education, National Center for Education Statistics. (2011). Digest of Education Statistics, 2010 (NCES 2011-015), Chapter 3 .
- House, G. (2011). Transforming America's High Schools. Strategies for Creating and Sustaining Meaningful Reform. http://www.ncchamber.net/docs/pdfs/EDUsummit_DrHouse.pdf
- The Journal of Blacks in Higher Education. Black Student College Graduation Rates Remain Low, But Modest Progress Begins to Show. http://www.jbhe.com/features/50_blackstudent_gradrates.html
- Jencks C, Phillips M. 1998. The black-white test score gap: an introduction. In The Black- White Test Score Gap: an Introduction, ed. C Jencks, M Phillips. Washington, DC: Brookings Institution
- The Nation's Report Card. 2008 Long Term Trend Report Card. http://nationsreportcard.gov/ltt_2008/ltt0001.asp
- Chudowsky & Kober. (2007). Are Achievement Gaps Closing and Is Achievement Rising for All? Center on Education Policy.
- Rothstein, Richard. 2004. Class and Schools: Using Social, Economic, and Educational Reform to Close the Black-White Achievement Gap. Washington, D.C: Economic Policy Institute.
- Banerjee, A., Banerjee, A. V., & Duflo, E. (2011). Poor economics: A radical rethinking of the way to fight global poverty. PublicAffairs Store.
- Ladson-Billings, G. (2006). "From the achievement gap to the education debt: Understanding achievement in US schools". Educational Researcher. 35 (7): 3–12. doi:10.3102/0013189X035007003.
- Milner, H. R. (2012). "Beyond a Test Score Explaining Opportunity Gaps in Educational Practice". Journal of Black Studies. 43 (6): 693–718. doi:10.1177/0021934712442539.
- Walton, G. M., & Cohen, G. L. (2011). Sharing motivation. In D. Dunning (Ed.), Frontiers of social psychology. Social motivation (pp. 79-101). New York, NY, US: Psychology Press.
- Steele, Claude (2011). Whistling Vivaldi: And Other Clues to How Stereotypes Affect Us. New York: W.W. Norton & Company. pp. 1–41. ISBN 978-0393339727.
- www.educationequalityindex.org (PDF) http://www.educationequalityindex.org/wp-content/uploads/2016/03/EEI-Oakland-Press-Release-FINAL.pdf. Retrieved 2018-12-18. Missing or empty
|title=(help) - David Yeager, Matthew Bundick (May 2009). "The Role of Purposeful Work Goals in Promoting Meaning in Life and in Schoolwork in Adolescence". Journal of Adolescent Research. 24 (4): 423–449. doi:10.1177/0743558409336749.
- Dweck, Carol (2014). Academic Tenacity: Mindsets and Skills that Promote Long-Term Learning. Bill and Melinda Gates Foundation. pp. 1–40.
- Dweck, Carol (September 22, 2015). "Carol Dweck Revisits "The Growth Mindset"". Education Week.
- Dweck, Carol (2006). Mindset: A New Psychology of Success. pp. 1–42.
- Ladson-Billings, Gloria (2006). "From the Achievement Gap to Education Debt: Understanding Achievement in U.S. Schools". Educational Researcher. 35 (7): 3–12. doi:10.3102/0013189X035007003. JSTOR 3876731.
- Libassi, C. J. "The Neglected College Race Gap: Racial Disparities Among College Completers". Center for American Progress. Retrieved 2019-12-19.
- Woodruff, Darren (1999). "Review of The Shape of the River: Long-Term Consequences of Considering Race in College and University Admissions by William G. Bowen and Derek Bok". Journal of Negro Education. 68 (1): 122–124. doi:10.2307/2668215. JSTOR 2668215.
- Robinson, Randall (2000). The debt: What America owes to Blacks. Dutton Books.
- Jeynes, W. H. (2003). "A meta-analysis the effects of parental involvement on minority children's academic achievement". Education and Urban Society. 35 (2): 202–218. doi:10.1177/0013124502239392.
- Lareau, Annette (2003). Unequal Childhoods: Class, Race, and Family Life. Berkeley: University of California Press. ISBN 978-0-520-23763-6.
- Kao, G.; Thompson, J. (2003). "Racial and ethnic stratification in educational achievement and attainment". Annual Review of Sociology. 29: 417–442. doi:10.1146/annurev.soc.29.010202.100019.
- Davis-Kean, P. E. (2005). "The influence of parent education and family income on child achievement: the indirect role of parental expectations and the home environment". Journal of Family Psychology. 19 (2): 294–304. doi:10.1037/0893-3200.19.2.294. PMID 15982107.
- Cooper, C. E.; Crosnoe; Suizzom; Pituch (2010). "Poverty Race and Parental Involvement During the Transition to Elementary School". Journal of Family Issues. 31 (7): 859–883. doi:10.1177/0192513X09351515.
- Wiggan, Greg (September 2007). "Race, School Achievement, and Educational Inequality: Toward a Student-Based Inquiry Perspective". Review of Educational Research. 77 (3): 310–333. doi:10.3102/003465430303947. ISSN 0034-6543.
- "Ethnic and Racial Minorities & Socioeconomic Status". https://www.apa.org. American Psychological Association. Retrieved 2019-12-04. External link in
|work=(help) - Perry, Laura (April 2009). "Characteristics of Equitable Systems of Education: A Cross-National Analysis". European Education. 41 (1): 79–100. doi:10.2753/EUE1056-4934410104. ISSN 1056-4934.
- Paschall, Katherine W.; Gershoff, Elizabeth T.; Kuhfeld, Megan (June 2018). "A Two Decade Examination of Historical Race/Ethnicity Disparities in Academic Achievement by Poverty Status". Journal of Youth and Adolescence. 47 (6): 1164–1177. doi:10.1007/s10964-017-0800-7. ISSN 0047-2891. PMID 29313249.
- "The Widening Racial Scoring Gap on the SAT College Admissions Test". www.jbhe.com. Retrieved 2019-12-04.
- Ogbu, J. U. (1992). "Understanding cultural diversity and learning". Educational Researcher. 21 (8): 5–14. doi:10.3102/0013189x021008005.
- Noguera, Pedro A. (2008). The Trouble with Black Boys. San Francisco: Jossey Bass. ISBN 978-0-7879-8874-6.
- Orozco, C. S.; Orozco, M. M. S. (1995). Trans-formations: Immigration, family life, and achievement motivation among Latino adolescents. Stanford University Press. ISBN 978-0-8047-2550-7.
- Fuligni, A. J.; Tseng, V.; Lam, M. (1999). "Attitudes toward family obligations among American adolescents with Asian, Latin American, and European backgrounds". Child Development. 70 (4): 1030–1044. doi:10.1111/1467-8624.00075.
- Tienda, Marta. "The National Academies". National Institutes of Health. Retrieved 20 April 2014.
- Goyette, K.; Xie, Y. (1999). "Educational expectations of Asian American youths: Determinants and ethnic differences". Sociology of Education. 72 (1): 22–36. doi:10.2307/2673184. JSTOR 2673184.
- Lee, Stacey J. (1994). "Behind the Model-Minority Stereotype: Voices of High- and Low-Achieving Asian American Students". Anthropology & Education Quarterly. 25 (4): 413–429. doi:10.1525/aeq.1994.25.4.04x0530j. ISSN 1548-1492.
- "Federal Role in Education". www2.ed.gov. 2017-05-25. Retrieved 2019-11-05.
- Massey, Douglas S. (2004). "The New Geography of Inequality in Urban America". In Henry, C. Michael (ed.). Race, Poverty, and Domestic Policy. New Haven: Yale University Press. ISBN 978-0-300-09541-8.
- Lee, Jaekyung (January 2002). "Racial and Ethnic Achievement Gap Trends: Reversing the Progress Toward Equity?". Educational Researcher. 31 (1): 3–12. doi:10.3102/0013189x031001003. ISSN 0013-189X.
- Kozol, J. (2005). Shame of the Nation: The Restoration of Apartheid Schooling in America. New York: Crown. ISBN 978-1-4000-5244-8.
- Leventhal, T.; Brooks-Gunn, J. (2004). "A randomized study of neighborhood effects on low-income children's educational outcomes". Developmental Psychology. 40 (4): 488–507. doi:10.1037/0012-1649.40.4.488. PMID 15238038.
- Sampson, R. J.; Morenoff, J. D.; Gannon-Rowley, T. (2002). "Assessing 'neighborhood effects': Social processes and new directions in research". Annual Review of Sociology. 28: 443–478. doi:10.1146/annurev.soc.28.110601.141114.
- Stewart, E. B.; Stewart, E. A.; Simons, R. L. (2007). "The effect of neighborhood context on the college aspirations of African American adolescents". American Educational Research Journal. 44 (4): 896–919. CiteSeerX 10.1.1.590.6788. doi:10.3102/0002831207308637.
- "Racial and Ethnic Residential Segregation United States: 1980–2000". U. S. Census Bureau. 2002. Retrieved October 20, 2013.
- Charles, C. Z. (2003). "The dynamics of racial residential segregation". Annual Review of Sociology. 29: 167–207. doi:10.1146/annurev.soc.29.010202.100002.
- Krivo, L. J.; Kaufman, R. L. (2004). "Housing and wealth inequality: Racial-ethnic differences in home equity in the United States". Demography. 41 (3): 585–605. CiteSeerX 10.1.1.453.8980. doi:10.1353/dem.2004.0023. PMID 15461016.
- Singham, Mano (2005). The Achievement Gap in U.S. Education: Canaries in the Mine. Lanham, MD: Rowman and Littlefield Education. ISBN 978-1-57886-217-7.
- Goldsmith, P. A. (2004). "Schools' racial mix, students' optimism, and the Black-White and Latino-White achievement gaps". Sociology of Education. 77 (2): 121–147. doi:10.1177/003804070407700202.
- McBrien, J. L. (2005). "Educational Needs and Barriers for Refugee Students in the United States: A Review of the Literature". Review of Educational Research. 75 (3): 329–364. CiteSeerX 10.1.1.459.5997. doi:10.3102/00346543075003329.
- Levels, M.; Dronkers, J.; Kraaykamp, G. (2008). "Immigrant children's educational achievement in western countries: origin, destination, and community effects on mathematical performance" (PDF). American Sociological Review. 73 (5): 835–853. doi:10.1177/000312240807300507. hdl:2066/73266.
- Espenshade, Thomas J.; Walton Radford, Alexandria (2009). No longer separate, not yet equal: race and class in elite college admission and campus life. Princeton, New Jersey: Princeton University Press. ISBN 9780691141602.
- Kober, Nancy. 2001. "It Takes More Than Testing: Closing the Achievement Gap." Washington, D.C: Center on Education Policy.
- Ornstein, Allan C. (2010). "Achievement Gaps in Education". Social Science and Public Policy. 47 (5): 424–429. doi:10.1007/s12115-010-9354-y.
- "Potential Economic Impacts of Improved Education on the United States" (PDF). Alliance for Excellent Education. 2009.
- "The Economic Impact of the Achievement Gap in America's Schools" (PDF). McKinsey & Company.
- Alliance for Excellent Education, "Education and the Economy: Boosting the Nation's Economy by Improving High School Graduation Rates" (Washington, DC: Author, 2011).
- US Census. Table 697. Money Income of Families—Median Income by Race and Hispanic Origin in Current and Constant (2009) Dollars: 1990 to 2009. https://www.census.gov/compendia/statab/2012/tables/12s0697.pdf
- American Psychological Association. "Ethnic and Minorities & Socioeconomic Status". Fact sheet.
- Katz; Rodin (January 19, 2012). "Targeting an Achievement Gap in One of the Country's Most Educated Metros". Citylab.
- Rouse, C. E. (2007). "Quantifying the Costs of Inadequate Education: Consequences of the Labor Market". In Belfield, C. R.; Levin, H. M. (eds.). The Price We Pay: Economic and Social Consequences of Inadequate Education. Washington, D.C.: Brookings Institution Press. pp. 99–124. ISBN 978-0-8157-0863-6.
- Pilon, Mary (February 2, 2010). "What's a Degree Really Worth?". Wall Street Journal.
- U.S. Department of Education, National Center for Education Statistics. (2011). The Condition of Education 2011 (NCES 2011–033), Indicator 17.
- Aronson, J. (2004). The Threat of Stereotype. Closing Achievement Gaps, 62 (3), 14-19.
- Zuckerman, M., Kieffer, S., Knee, C.R. (1998). Consequences of Self-Handicapping: Effects on Coping, Academic Performance and Adjustment. 74 (6), 1619-1628.
- "Stereotype Threat Widens Achievement Gap" American Psychological Association. 2006.
- Verba, Sidney; Nie, N. H. (1987). Participation in America: Political Democracy and Social Equality. University of Chicago Press. ISBN 978-0-226-85296-6.
- Conge, P. J. (1988). "The Concept of Political Participation: Toward a Definition". Comparative Politics. 20 (2): 241–249. doi:10.2307/421669. JSTOR 421669.
- US Department of Education, National Center for Education Statistics. (2010). Occupation of employed persons 25 years old and over, by educational attainment and sex: 2010 [Table]. Retrieved from http://nces.ed.gov/programs/digest/d11/tables/dt11_394.asp
- National Science Foundation, Division of Science Resources Statistics. (2010). Science and Engineering Degrees, by Race/Ethnicity of Recipients: 1997–2006 [Table]. Retrieved from https://www.nsf.gov/statistics/nsf10300/.
- Verba, S.; Schlozman, K. L.; Brady, H.; Nie, N. H. (1993). "Race, ethnicity and political resources: Participation in the United States". British Journal of Political Science. 23 (4): 453–497. doi:10.1017/S0007123400006694.
- Lien, P. T. (2001). The Making of Asian American through Political Participation. Philadelphia, PA: Temple University Press. p. 73. ISBN 978-1-56639-894-7.
- Meier, K. J.; England, R. E. (1984). "Black Representation and Educational Policy: Are They Related?". American Political Science Review. 78 (2): 392–403. doi:10.2307/1963371. JSTOR 1963371.
- Bobo, L.; Gilliam, F. D., Jr (1990). "Race, Sociopolitical Participation, and Black Empowerment". American Political Science Review. 84 (2): 377–393. doi:10.2307/1963525. JSTOR 1963525.
- Elliott, R. (1987). Litigating intelligence: IQ tests, special education, and social science in the courtroom. Dover, MA: Auburn House. ISBN 9780865691568 – via Internet Archive.
- Yoon, S. Y.; Gentry, M. (2009). "Racial and ethnic representation in gifted programs: Current status of and implications for gifted Asian American students". Gifted Child Quarterly. 53 (2): 121–136. doi:10.1177/0016986208330564.
- Warne, R. T.; Anderson, B.; Johnson, A. O. (2013). "The effect of race and ethnicity on the identification process for giftedness in Utah". Journal for the Education of the Gifted. 36 (4): 487–508. doi:10.1177/0162353213506065.
- www.educationequalityindex.org (PDF) http://www.educationequalityindex.org/wp-content/uploads/2016/03/EEI-Oakland-Press-Release-FINAL.pdf. Retrieved 2018-12-18. Missing or empty
|title=(help) - Heckman, James (2011). "The Economics of Inequality: The Value of Early Childhood Education" (PDF). American Educator. 35 (1): 31–35.
- Geoffroy, Marie‐Claude; et al. (2010). "Closing The Gap In Academic Readiness And Achievement: The Role Of Early Childcare". Journal of Child Psychology and Psychiatry. 51 (12): 1359–1367. doi:10.1111/j.1469-7610.2010.02316.x. PMC 3283580. PMID 20883519.
- Heckman, James (January 10, 2006). "Catch 'em Young: Investing in Disadvantaged Young Children is Both Fair and Efficient". Wall Street Journal. p. A14.
- O'Brein, Anne (2012). "The Economic Impact of Early Childhood Education". Learning First Alliance. Missing or empty
|url=(help) - Barton, Paul; Coley, Richard (2010). "The Black-White Achievement Gap When Progress Stopped". Policy Information Report. Missing or empty
|url=(help) - "Spotlight on Education". Early Childhood Focus. NACCRRA. 2008.
- Effrem, Karen (May 2011). "Studies on Effectiveness of Early Childhood Programs". Edlibertywatch.
- "Goals 2000: Educate America Act." Federal Education Policy History. N.p., June 2011. Web. <http://federaleducationpolicy.wordpress.com/2011/06/15/goals-2000-educate-america-act/>.
- Dee, Thomas S.; Jacob, Brian (2011). "The impact of no Child Left Behind on student achievement". Journal of Policy Analysis and Management. 30 (3): 418–446. CiteSeerX 10.1.1.180.3683. doi:10.1002/pam.20586.
- Nichols, S. L.; Berliner, D. C. (2007). Collateral damage: How high-stakes testing corrupts America's schools. Cambridge, MA: Harvard Education Press. ISBN 978-1-891792-36-6.
- Dillon, Sam (28 April 2009). "'No Child' Law Is Not Closing a Racial Gap". New York Times.
- "Charter Schools". Education Week, 2011.
- U.S. Department of Education 2011, p. 23.
- American Federation of Teachers, "Do Charter Schools Measure Up?: The Charter School Experiment After 10 Years," 2002
- The Civil Rights Project at Harvard University, "Choice Without Equity: Charter School Segregation and the Need for Civil Rights Standards," 2010.
- .Huff, Cynthia. "Study Shows Charter Schools Still Lag behind Traditional Public Schools in Test Scores and Are Increasingly Segregated by Race and Income." University of Minnesota. N.p., Feb. 2012. Web. <http://www1.umn.edu/news/news-releases/2012/UR_CONTENT_375590.html>.
- "Native Now : Language: Cherokee". We Shall Remain - American Experience - PBS. 2008. Retrieved April 9, 2014.
- "Cherokee Language Revitalization". Cherokee Preservation Foundation. 2014. Archived from the original on April 7, 2014. Retrieved April 9, 2014.
- Kituwah Preservation & Education Program Powerpoint, by Renissa Walker (2012)'. 2012. Print.
- Chavez, Will (April 5, 2012). "Immersion students win trophies at language fair". Cherokeephoenix.org. Retrieved April 8, 2013.
- "Cherokee Immersion School Strives to Save Tribal Language". Youth on Race. Archived from the original on July 3, 2014. Retrieved June 5, 2014.
- Coulson, Andrew (2005). "Private Schools Are Closing the Achievement Gap". Heartlander.
- Lubienski, Christopher; Lubienski, Sarah (2006). "Charter, Private, Public Schools and Academic Achievement: New Evidence from NAEP Mathematics Data" (PDF). National Center for the Study of Privatization in Education Teachers College, Columbia University. Cite journal requires
|journal=(help) - Xu, Zeyu; Hannaway, Jane; Taylor, Colin (2011). "Making a Difference? The Effect of Teach For America in High School". Journal of Policy Analysis & Management. 30 (3): 447–469. doi:10.1002/pam.20585.
- "Research". Teach For America.
- Boyd, D. J.; Grossman, P.; Lankford, H.; Loeb, S.; Wyckoff, J. (2006). "How changes in entry requirements alter the teacher workforce and affect student achievement" (PDF). Education Finance and Policy. 1 (2): 176–216. doi:10.1162/edfp.2006.1.2.176.
- Cohen, Garcia, Apfel, Master, Geoffrey, Julio, Nancy, Allison (September 2006). "Reducing the Racial Achievement Gap: A Social-Psychological Intervention" (PDF). Science. 313 (5791): 1307–1310. Bibcode:2006Sci...313.1307C. doi:10.1126/science.1128317. PMID 16946074.CS1 maint: multiple names: authors list (link)
External links
- Education Week: Achievement Gap
- The achievement gap: What early childhood educators need to know