Programme for International Student Assessment (2000 to 2012)
The Programme for International Student Assessment has had several runs before the most recent one in 2012. The first PISA assessment was carried out in 2000. The results of each period of assessment take about one year and a half to be analysed. First results were published in November 2001. The release of raw data and the publication of technical report and data handbook only took place in spring 2002. The triennial repeats follow a similar schedule; the process of seeing through a single PISA cycle, start-to-finish, always takes over four years. 470,000 15-year-old students representing 65 nations and territories participated in PISA 2009. An additional 50,000 students representing nine nations were tested in 2010.[1]
Every period of assessment focuses on one of the three competence fields of reading, math, science; but the two others are tested as well. After nine years, a full cycle is completed: after 2000, reading was again the main domain in 2009.
| Period | Focus | OECD countries | Partner countries | Participating students | Notes |
|---|---|---|---|---|---|
| 2000 | Reading | 28 | 4 + 11 | 265,000 | The Netherlands disqualified from data analysis. 11 additional non-OECD countries took the test in 2002. |
| 2003 | Mathematics | 30 | 11 | 275,000 | UK disqualified from data analysis. Also included test in problem solving. |
| 2006 | Science | 30 | 27 | 400,000 | Reading scores for US excluded from analysis due to misprint in testing materials.[2] |
| 2009[3] | Reading | 34 | 41 + 10 | 470,000 | 10 additional non-OECD countries took the test in 2010.[4] |
| 2012[5] | Mathematics | 34 | 31 | 510,000 |
Results
PISA 2012
PISA 2012 | |||||||||||||||||||||||||||||||||||||||||||||||||||||||||||||||||||||||||||||||||||||||||||||||||||||||||||||||||||||||||||||||||||||||||||||||||||||||||||||||||||||||||||||||||||||||||||||||||||||||||||||||||||||||||||||||||||||||||||||||||||||||||||||||||||||||||||||||||||||||||||||||||||||||||||||||||||||||||||||||||||||||||||||||||||||||||||||||||||||||||||||||||||||||||||||||||||||||||||||||||||||||||||||||||||||||||||||||||||||||||||||||||||||||||||||||||||||||||||||||||||||||||||||||||||||||||||||||||||||||||||||||||||||||||||||||||||||||||||||||||||||||||||||||||||||||||||||||
|---|---|---|---|---|---|---|---|---|---|---|---|---|---|---|---|---|---|---|---|---|---|---|---|---|---|---|---|---|---|---|---|---|---|---|---|---|---|---|---|---|---|---|---|---|---|---|---|---|---|---|---|---|---|---|---|---|---|---|---|---|---|---|---|---|---|---|---|---|---|---|---|---|---|---|---|---|---|---|---|---|---|---|---|---|---|---|---|---|---|---|---|---|---|---|---|---|---|---|---|---|---|---|---|---|---|---|---|---|---|---|---|---|---|---|---|---|---|---|---|---|---|---|---|---|---|---|---|---|---|---|---|---|---|---|---|---|---|---|---|---|---|---|---|---|---|---|---|---|---|---|---|---|---|---|---|---|---|---|---|---|---|---|---|---|---|---|---|---|---|---|---|---|---|---|---|---|---|---|---|---|---|---|---|---|---|---|---|---|---|---|---|---|---|---|---|---|---|---|---|---|---|---|---|---|---|---|---|---|---|---|---|---|---|---|---|---|---|---|---|---|---|---|---|---|---|---|---|---|---|---|---|---|---|---|---|---|---|---|---|---|---|---|---|---|---|---|---|---|---|---|---|---|---|---|---|---|---|---|---|---|---|---|---|---|---|---|---|---|---|---|---|---|---|---|---|---|---|---|---|---|---|---|---|---|---|---|---|---|---|---|---|---|---|---|---|---|---|---|---|---|---|---|---|---|---|---|---|---|---|---|---|---|---|---|---|---|---|---|---|---|---|---|---|---|---|---|---|---|---|---|---|---|---|---|---|---|---|---|---|---|---|---|---|---|---|---|---|---|---|---|---|---|---|---|---|---|---|---|---|---|---|---|---|---|---|---|---|---|---|---|---|---|---|---|---|---|---|---|---|---|---|---|---|---|---|---|---|---|---|---|---|---|---|---|---|---|---|---|---|---|---|---|---|---|---|---|---|---|---|---|---|---|---|---|---|---|---|---|---|---|---|---|---|---|---|---|---|---|---|---|---|---|---|---|---|---|---|---|---|---|---|---|---|---|---|---|---|---|---|---|---|---|---|---|---|---|---|---|---|---|---|---|---|---|---|---|---|---|---|---|---|---|---|---|---|---|---|---|---|---|---|---|---|---|---|---|---|---|---|---|---|---|---|---|---|---|---|---|---|---|---|---|---|---|---|---|---|---|---|---|---|---|---|---|---|---|---|---|---|---|---|---|---|---|---|---|---|---|---|---|---|---|---|---|---|---|---|---|---|---|---|---|---|---|---|---|---|---|---|---|---|---|---|---|---|---|---|---|---|---|---|---|---|---|---|---|---|---|---|---|---|---|---|---|---|---|---|---|---|---|---|---|---|---|---|---|---|---|---|---|---|
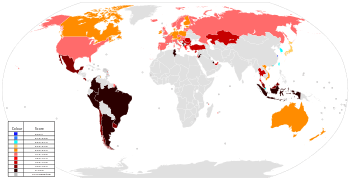 The results for the 2012 "Maths" section on a world map. 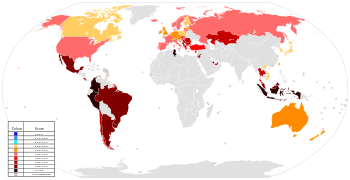 The results for the 2012 "Science" section on a world map. 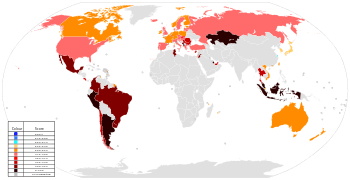 The results for the 2012 "Reading" section on a world map.
PISA 2012 was presented on 3 December 2013, with results for around 510,000 participating students in all 34 OECD member countries and 31 partner countries.[5] This testing cycle had a particular focus on mathematics, where the mean score was 494. A sample of 1,688 students from Puerto Rico took the assessment, scoring 379 in math, 404 in reading and 401 in science.[6] A subgroup of 44 countries and economies with about 85 000 students also took part in an optional computer-based assessment of problem solving.[7] Shanghai had the highest score in all three subjects. It was followed by Singapore, Hong Kong, Chinese Taipei and Korea in mathematics; Hong Kong, Singapore, Japan and Korea in reading and Hong Kong, Singapore, Japan and Finland in science. They were a sample of about 28 million in the same age group in 65 countries and economies,[8] including the OECD countries, several Chinese cities, Vietnam, Indonesia and several countries in South America.[5] The test lasted two hours, was paper-based and included both open-ended and multiple-choice questions.[8] The students and school staff also answered a questionnaire to provide background information about the students and the schools.[5][8] PISA 2012 was presented on 3 December 2013, with results for around 510,000 participating students in all 34 OECD member countries and 31 partner countries.[5] This testing cycle had a particular focus on mathematics, where the mean score was 494. The mean score in reading was 496 and in science 501. The results show distinct groups of high-performers in mathematics: the East Asian countries, with Shanghai, scoring the best result of 613, followed closely by Hong Kong, Japan, Chinese Taipei and South Korea. Among the Europeans, Liechtenstein and Switzerland performed best, with Netherlands, Estonia, Finland, Poland, Belgium, Germany, Austria all posting mathematics scores "not significantly statistically different from" one another. The United Kingdom, Ireland, Australia and New Zealand were similarly clustered around the OECD average of 494, with the USA trailing this group at 481.[5] Qatar, Kazakhstan and Malaysia were the countries which showed the greatest improvement in mathematics. The USA and the United Kingdom showed no significant change.[9] Sweden had the greatest fall in mathematics performance over the last ten years, with a similar falling trend also in the two other subjects, and leading politicians in Sweden expressed great worry over the results.[10][11] On average boys scored better than girls in mathematics, girls scored better than boys in reading and the two sexes had quite similar scores in science.[9] Indonesia, Albania, Peru, Thailand and Colombia were the countries where most students reported being happy at school, while students in Korea, the Czech Republic, the Slovak Republic, Estonia and Finland reported least happiness.[8] |
PISA 2009
PISA 2009 | ||||||
|---|---|---|---|---|---|---|
|
The PISA 2009 cycle included results in mathematics, science and reading for all 36 OECD member countries and 37 partner countries.[3][12][13] Of the partner countries, only selected areas of three countries—India, Venezuela and China—were assessed. PISA 2009+, released in December 2011, included data from 10 additional partner countries which had testing delayed from 2009 to 2010 because of scheduling constraints.[4][14]
|
PISA 2006
PISA 2006 | ||||||||||||||||||||||||||||||||||||||||||||||||||||||||||||||||||||||||||||||||||||||||||||||||||||||||||||||||||||||||||||||||||||||||||||||||||||||||||||||||||||||||||||||||||||||||||||||||||||||||||||||||||||||||||||||||||||||||||||||||||||||||||||||||||||||||||||||||||||||||||||||||||||||||||||||||||||||||||||||||||||||||||||||||||||||||||||||||||||||||||||||||||||||||||||||||||||||||||||||||||||||||||||||||||||||||||||||||||||||||||||||||||||||||||||||||||||||||||||||||||||||||||||||||||||||||||||||||||||
|---|---|---|---|---|---|---|---|---|---|---|---|---|---|---|---|---|---|---|---|---|---|---|---|---|---|---|---|---|---|---|---|---|---|---|---|---|---|---|---|---|---|---|---|---|---|---|---|---|---|---|---|---|---|---|---|---|---|---|---|---|---|---|---|---|---|---|---|---|---|---|---|---|---|---|---|---|---|---|---|---|---|---|---|---|---|---|---|---|---|---|---|---|---|---|---|---|---|---|---|---|---|---|---|---|---|---|---|---|---|---|---|---|---|---|---|---|---|---|---|---|---|---|---|---|---|---|---|---|---|---|---|---|---|---|---|---|---|---|---|---|---|---|---|---|---|---|---|---|---|---|---|---|---|---|---|---|---|---|---|---|---|---|---|---|---|---|---|---|---|---|---|---|---|---|---|---|---|---|---|---|---|---|---|---|---|---|---|---|---|---|---|---|---|---|---|---|---|---|---|---|---|---|---|---|---|---|---|---|---|---|---|---|---|---|---|---|---|---|---|---|---|---|---|---|---|---|---|---|---|---|---|---|---|---|---|---|---|---|---|---|---|---|---|---|---|---|---|---|---|---|---|---|---|---|---|---|---|---|---|---|---|---|---|---|---|---|---|---|---|---|---|---|---|---|---|---|---|---|---|---|---|---|---|---|---|---|---|---|---|---|---|---|---|---|---|---|---|---|---|---|---|---|---|---|---|---|---|---|---|---|---|---|---|---|---|---|---|---|---|---|---|---|---|---|---|---|---|---|---|---|---|---|---|---|---|---|---|---|---|---|---|---|---|---|---|---|---|---|---|---|---|---|---|---|---|---|---|---|---|---|---|---|---|---|---|---|---|---|---|---|---|---|---|---|---|---|---|---|---|---|---|---|---|---|---|---|---|---|---|---|---|---|---|---|---|---|---|---|---|---|---|---|---|---|---|---|---|---|---|---|---|---|---|---|---|---|---|---|---|---|---|---|---|---|---|---|---|---|---|---|---|---|---|---|---|---|---|---|---|---|---|---|---|---|---|---|---|---|---|---|---|---|---|---|---|---|---|---|---|---|---|---|---|---|---|---|---|---|---|---|---|---|---|---|---|---|---|---|---|---|---|---|---|---|---|---|---|---|---|---|---|---|---|---|---|---|---|---|---|---|---|---|---|---|---|---|---|---|---|---|---|---|---|---|---|---|
|
PISA 2003
The results for PISA 2003 were released on 14 December 2004. This PISA cycle tested 275,000 15 year-olds on mathematics, science, reading and problem solving and involved schools from 30 OECD member countries and 11 partner countries.[15] Note that for Science and Reading, the means displayed are for "All Students", but for these two subjects (domains), not all of the students answered questions in these domains. In the 2003 OECD Technical Report (pages 208, 209), there are different country means (different than those displayed below) available for students who had exposure to these domains.[16]
PISA 2003 | ||||||||||||||||||||||||||||||||||||||||||||||||||||||||||||||||||||||||||||||||||||||||||||||||||||||||||||||||||||||||||||||||||||||||||||||||||||||||||||||||||||||||||||||||||||||||||||||||||||||||||||||||||||||||||||||||||||||||||||||||||||||||||||||||||||||||||||||||||||||||||||||||||||||||||||||||||||||||||||||||||||||||||||||||||||||||||||||||||||||||||||||||||||||||||||||||||||||||||||||||||||||||||||||||||||||||||||||||||||||||||||||||||||||||||||||||||||||||||||||||||||||||
|---|---|---|---|---|---|---|---|---|---|---|---|---|---|---|---|---|---|---|---|---|---|---|---|---|---|---|---|---|---|---|---|---|---|---|---|---|---|---|---|---|---|---|---|---|---|---|---|---|---|---|---|---|---|---|---|---|---|---|---|---|---|---|---|---|---|---|---|---|---|---|---|---|---|---|---|---|---|---|---|---|---|---|---|---|---|---|---|---|---|---|---|---|---|---|---|---|---|---|---|---|---|---|---|---|---|---|---|---|---|---|---|---|---|---|---|---|---|---|---|---|---|---|---|---|---|---|---|---|---|---|---|---|---|---|---|---|---|---|---|---|---|---|---|---|---|---|---|---|---|---|---|---|---|---|---|---|---|---|---|---|---|---|---|---|---|---|---|---|---|---|---|---|---|---|---|---|---|---|---|---|---|---|---|---|---|---|---|---|---|---|---|---|---|---|---|---|---|---|---|---|---|---|---|---|---|---|---|---|---|---|---|---|---|---|---|---|---|---|---|---|---|---|---|---|---|---|---|---|---|---|---|---|---|---|---|---|---|---|---|---|---|---|---|---|---|---|---|---|---|---|---|---|---|---|---|---|---|---|---|---|---|---|---|---|---|---|---|---|---|---|---|---|---|---|---|---|---|---|---|---|---|---|---|---|---|---|---|---|---|---|---|---|---|---|---|---|---|---|---|---|---|---|---|---|---|---|---|---|---|---|---|---|---|---|---|---|---|---|---|---|---|---|---|---|---|---|---|---|---|---|---|---|---|---|---|---|---|---|---|---|---|---|---|---|---|---|---|---|---|---|---|---|---|---|---|---|---|---|---|---|---|---|---|---|---|---|---|---|---|---|---|---|---|---|---|---|---|---|---|---|---|---|---|---|---|---|---|---|---|---|---|---|---|---|---|---|---|---|---|---|---|---|---|---|---|---|---|---|---|---|---|---|---|---|---|---|---|---|---|---|---|---|---|---|---|---|---|---|---|---|---|---|---|---|---|---|---|---|---|---|---|---|---|---|---|---|---|---|---|---|---|---|---|---|---|---|---|---|---|---|---|---|---|---|---|---|---|---|---|---|---|---|---|---|---|---|---|---|---|---|---|---|---|---|---|---|---|---|
|
PISA 2000
The results for the first cycle of the PISA survey were released on 14 November 2001. 265,000 15 year-olds were tested in 28 OECD countries and 4 partner countries on mathematics, science and reading. An additional 11 countries were tested later in 2002.[17]
PISA 2000 | |||||||||||||||||||||||||||||||||||||||||||||||||||||||||||||||||||||||||||||||||||||||||||||||||||||||||||||||||||||||||||||||||||||||||||||||||||||||||||||||||||||||||||||||||||||||||||||||||||||||||||||||||||||||||||||||||||||||||||||||||||||||||||||||||||||||||||||||||||||||||||||||||||||||||||||||||||||||||||||||||||||||||||||||||||||||||||||||||||||||||||||||||||||||
|---|---|---|---|---|---|---|---|---|---|---|---|---|---|---|---|---|---|---|---|---|---|---|---|---|---|---|---|---|---|---|---|---|---|---|---|---|---|---|---|---|---|---|---|---|---|---|---|---|---|---|---|---|---|---|---|---|---|---|---|---|---|---|---|---|---|---|---|---|---|---|---|---|---|---|---|---|---|---|---|---|---|---|---|---|---|---|---|---|---|---|---|---|---|---|---|---|---|---|---|---|---|---|---|---|---|---|---|---|---|---|---|---|---|---|---|---|---|---|---|---|---|---|---|---|---|---|---|---|---|---|---|---|---|---|---|---|---|---|---|---|---|---|---|---|---|---|---|---|---|---|---|---|---|---|---|---|---|---|---|---|---|---|---|---|---|---|---|---|---|---|---|---|---|---|---|---|---|---|---|---|---|---|---|---|---|---|---|---|---|---|---|---|---|---|---|---|---|---|---|---|---|---|---|---|---|---|---|---|---|---|---|---|---|---|---|---|---|---|---|---|---|---|---|---|---|---|---|---|---|---|---|---|---|---|---|---|---|---|---|---|---|---|---|---|---|---|---|---|---|---|---|---|---|---|---|---|---|---|---|---|---|---|---|---|---|---|---|---|---|---|---|---|---|---|---|---|---|---|---|---|---|---|---|---|---|---|---|---|---|---|---|---|---|---|---|---|---|---|---|---|---|---|---|---|---|---|---|---|---|---|---|---|---|---|---|---|---|---|---|---|---|---|---|---|---|---|---|---|---|---|---|---|---|---|---|---|---|---|---|---|---|---|---|---|---|---|---|---|---|---|---|---|---|---|---|---|---|---|---|---|---|---|---|---|---|---|---|---|---|---|---|---|---|---|---|
|
Comparison with other studies
The correlation between PISA 2003 and TIMSS 2003 grade 8 country means is 0.84 in mathematics, 0.95 in science. The values go down to 0.66 and 0.79 if the two worst performing developing countries are excluded. Correlations between different scales and studies are around 0.80. The high correlations between different scales and studies indicate common causes of country differences (e.g. educational quality, culture, wealth or genes) or a homogenous underlying factor of cognitive competence. European Economic Area countries perform slightly better in PISA; the Commonwealth of Independent States and Asian countries in TIMSS. Content balance and years of schooling explain most of the variation.[18]
Reception
The results from PISA 2003 and PISA 2006 were featured in the 2010 documentary Waiting for "Superman".[19]
China
Education professor Yong Zhao has noted that PISA 2009 did not receive much attention in the Chinese media, and that the high scores in China are due to excessive workload and testing, adding that it's "no news that the Chinese education system is excellent in preparing outstanding test takers, just like other education systems within the Confucian cultural circle: Singapore, Korea, Japan, and Hong Kong."[20]
Students from Shanghai, China, had the top scores of every category (Mathematics, Reading and Science) in PISA 2009. In discussing these results, PISA spokesman Andreas Schleicher, Deputy Director for Education and head of the analysis division at the OECD’s directorate for education, described Shanghai as a pioneer of educational reform in which "there has been a sea change in pedagogy". Schleicher stated that Shanghai abandoned its "focus on educating a small elite, and instead worked to construct a more inclusive system. They also significantly increased teacher pay and training, reducing the emphasis on rote learning and focusing classroom activities on problem solving."[21]
Schleicher also states that PISA tests administered in rural China have produced some results approaching the OECD average: Citing further, as-yet-unpublished OECD research, Schleicher said, "We have actually done Pisa in 12 of the provinces in China. Even in some of the very poor areas you get performance close to the OECD average."[22] Schleicher says that for a developing country, China's 99.4% enrollment in primary education is "the envy of many countries". He maintains that junior secondary school participation rates in China are now 99%; and in Shanghai, not only has senior secondary school enrollment attained 98%, but admissions into higher education have achieved 80% of the relevant age group. Schleicher believes that this growth reflects quality, not just quantity, which he contends the top PISA ranking of Shanghai's secondary education confirms.[22] Schleicher believes that China has also expanded school access and has moved away from learning by rote.[23] According to Schleicher, Russia performs well in rote-based assessments, but not in PISA, whereas China does well in both rote-based and broader assessments.[22]
Denmark
University of Copenhagen Professor Svend Kreiner, who examined in detail PISA's 2006 reading results, noted that in 2006 only about ten percent of the students who took part in PISA were tested on all 28 reading questions. "This in itself is ridiculous,” Kreiner told Stewart. "Most people don't know that half of the students taking part in PISA (2006) do not respond to any reading item at all. Despite that, PISA assigns reading scores to these children."[24]
Finland
The stable, high marks of Finnish students have attracted a lot of attention. According to Hannu Simola[25] the results reflect a paradoxical mix of progressive policies implemented through a rather conservative pedagogic setting, where the high levels of teachers' academic preparation, social status, professionalism and motivation for the job are concomitant with the adherence to traditional roles and methods by both teachers and pupils in Finland's changing, but still quite paternalistic culture. Others advance Finland's low poverty rate as a reason for its success.[26][27] Finnish education reformer Pasi Sahlberg attributes Finland's high educational achievements to its emphasis on social and educational equality and stress on cooperation and collaboration, as opposed to the competition among teachers and schools that prevails in other nations.[28]
India
Of the 74 countries tested in the PISA 2009 cycle including the "+" nations, the two Indian states came up 72nd and 73rd out of 74 in both reading and mathematics, and 73rd and 74th in science. India's poor performance may not be linguistic as some suggested. 12.87% of US students, for example, indicated that the language of the test differed from the language spoken at home. while 30.77% of Himachal Pradesh students indicated that the language of the test differed from the language spoken at home, a significantly higher percent[29] However, unlike American students, those Indian students with a different language at home did better on the PISA test than those with the same language.[29] India's poor performance on the PISA test is consistent with India's poor performance in the only other instance when India's government allowed an international organization to test its students[30] and consistent with India's own testing of its elite students in a study titled Student Learning in the Metros 2006. [31] These studies were conducted using TIMSS questions. The poor result in PISA was greeted with dismay in the Indian media.[32] The BBC reported that as of 2008, only 15% of India's students reach high school.[33]
United States
Two studies have compared high achievers in mathematics on the PISA and those on the U.S. National Assessment of Educational Progress (NAEP). Comparisons were made between those scoring at the "advanced" and "proficient" levels in mathematics on the NAEP with the corresponding performance on the PISA. Overall, 30 nations had higher percentages than the U.S. of students at the "advanced" level of mathematics. The only OECD countries with worse results were Portugal, Greece, Turkey, and Mexico. Six percent of U.S. students were "advanced" in mathematics compared to 28 percent in Taiwan. The highest ranked state in the U.S. (Massachusetts) was just 15th in the world if it was compared with the nations participating in the PISA. 31 nations had higher percentages of "proficient" students than the U.S. Massachusetts was again the best U.S. state, but it ranked just ninth in the world if compared with the nations participating in the PISA.[34][35]
Comparisons with results for the Trends in International Mathematics and Science Study (TIMSS) appear to give different results—suggesting that the U.S. states actually do better in world rankings.[36] This can likely be traced to the different material being covered and the United States teaching mathematics in a style less harmonious with the "Realistic Mathematics Education" which forms the basis of the exam.[37] Countries that commonly use this teaching method score higher on PISA, and less highly on TIMSS and other assessments.[38]
Poverty
Stephen Krassen, professor emeritus at the University of Southern California,[39] and Mel Riddile of the NASSP attributed the relatively low performance of students in the United States to the country's high rate of child poverty, which exceeds that of other OECD countries.[26][27] However, individual US schools with poverty rates comparable to Finland's (below 10%), as measured by reduced-price school lunch participation, outperform Finland; and US schools in the 10–24% reduced-price lunch range are not far behind.[40]
Reduced school lunch participation is the only available intra-poverty indicator for US schoolchildren. In the United States, schools in locations in which less than 10% of the students qualified for free or reduced-price lunch averaged PISA scores of 551 (higher than any other OECD country). This can be compared with the other OECD countries (which have tabled figures on children living in relative poverty):[27]
| Country | Percent of reduced school lunches (US)[27]
Percent of relative child poverty (Other OECD countries)[41] |
PISA score[42] |
|---|---|---|
| United States | < 10% | 551 |
| Finland | 3.4% | 536 |
| Netherlands | 9.0% | 508 |
| Belgium | 6.7% | 506 |
| United States | 10%–24.9% | 527 |
| Canada | 13.6% | 524 |
| New Zealand | 16.3% | 521 |
| Japan | 14.3% | 520 |
| Australia | 11.6% | 515 |
| United States | 25–49.9% | 502 |
| Estonia | 40.1% | 501 |
| United States | 50–74.9% | 471 |
| Russian Federation | 58.3% | 459 |
| United States | > 75% | 446 |
Sampling errors
In 2013 Martin Carnoy of the Stanford University Graduate School of Education and Richard Rothstein of the Economic Policy Institute released a report, "What do international tests really show about U.S. student performance?", analyzing the 2009 PISA data base. Their report found that U.S. PISA test scores had been lowered by a sampling error that over-represented adolescents from the most disadvantaged American schools in the test-taking sample.[43] The authors cautioned that international test scores are often “interpreted to show that American students perform poorly when compared to students internationally” and that school reformers then conclude that “U.S. public education is failing.” Such inferences, made before the data has been carefully analyzed, they say, “are too glib”[44] and "may lead policymakers to pursue inappropriate and even harmful reforms."[45]
Carnoy and Rothstein observe that in all countries, students from disadvantaged backgrounds perform worse than those from advantaged backgrounds, and the US has a greater percentage of students from disadvantaged backgrounds. The sampling error on the PISA results lowered U.S. scores for 15-year-olds even further, they say. The authors add, however, that in countries such as Finland, the scores of disadvantaged students tends to be stagnant, whereas in the U.S the scores of disadvantaged students have been steadily rising over time, albeit still lagging behind their those of their more advantaged peers. When the figures are adjusted for social class, the PISA scores of all US students would still remain behind those of the highest scoring countries, nevertheless, the scores of US students of all social backgrounds have shown a trajectory of improvement over time, notably in mathematics, a circumstance PISA's report fails to take into account.
Carnoy and Rothstein write that PISA spokesman Schleicher has been quoted saying that “international education benchmarks make disappointing reading for the U.S.” and that “in the U.S. in particular, poverty was destiny. Low-income American students did (and still do) much worse than high-income ones on PISA. But poor kids in Finland and Canada do far better relative to their more privileged peers, despite their disadvantages” (Ripley 2011)."[46] Carnoy and Rothstein state that their report's analysis shows Schleicher and Ripley's claims to be untrue. They further fault the way PISA's results have persistently been released to the press before experts have time to evaluate them; and they charge the OECD reports with inconsistency in explaining such factors as the role of parental education. Carnoy and Rothstein also note with alarm that the US secretary of education Arne Duncan regularly consults with PISA's Andreas Schleicher in formulating educational policy before other experts have been given a chance to analyze the results.[47] Carnoy and Rothstein's report (written before the release of the 2011 database) concludes:
We are most certain of this: To make judgments only on the basis of national average scores, on only one test, at only one point in time, without comparing trends on different tests that purport to measure the same thing, and without disaggregation by social class groups, is the worst possible choice. But, unfortunately, this is how most policymakers and analysts approach the field.
The most recent test for which an international database is presently available is PISA, administered in 2009. A database for TIMSS 2011 is scheduled for release in mid-January 2013. In December 2013, PISA will announce results and make data available from its 2012 test administration. Scholars will then be able to dig into TIMSS 2011 and PISA 2012 databases so they can place the publicly promoted average national results in proper context. The analyses we have presented in this report should caution policymakers to await understanding of this context before drawing conclusions about lessons from TIMSS or PISA assessments.[48]
References
- PISA 2009 Technical Report, 2012, OECD, http://www.oecd.org/dataoecd/60/31/50036771.pdf
- Baldi, Stéphane; Jin, Ying; Skemer, Melanie; Green, Patricia J; Herget, Deborah; Xie, Holly (2007-12-10), Highlights From PISA 2006: Performance of U.S. 15-Year-Old Students in Science and Mathematics Literacy in an International Context (PDF), NCES, retrieved 2013-12-14,
PISA 2006 reading literacy results are not reported for the United States because of an error in printing the test booklets. Furthermore, as a result of the printing error, the mean performance in mathematics and science may be misestimated by approximately 1 score point. The impact is below one standard error.
- PISA 2009 Results: Executive Summary (PDF), OECD, 2010-12-07
- ACER releases results of PISA 2009+ participant economies, ACER, 2011-12-16, archived from the original on 2014-10-08, retrieved 2016-04-15
- PISA 2012 Results in Focus (PDF), OECD, 3 December 2013, retrieved 4 December 2013
- CB Online Staff. "PR scores low on global report card" Archived 2015-01-03 at the Wayback Machine, Caribbean Business, September 26, 2014. Retrieved on January 3, 2015.
- OECD (2014): PISA 2012 results: Creative problem solving: Students’ skills in tackling real-life problems (Volume V), http://www.oecd-ilibrary.org/education/pisa-2012-results-skills-for-life-volume-v_9789264208070-en
- PISA 2012 Results OECD. Retrieved 4 December 2013
- Sedghi, Ami; Arnett, George; Chalabi, Mona (2013-12-03), Pisa 2012 results: which country does best at reading, maths and science?, The Guardian, retrieved 2013-02-14
- Adams, Richard (2013-12-03), Swedish results fall abruptly as free school revolution falters, The Guardian, retrieved 2013-12-03
- Kärrman, Jens (2013-12-03), Löfven om Pisa: Nationell kris, Dagens Nyheter, retrieved 2013-12-03
- Multi-dimensional Data Request, OECD, 2010, archived from the original on 2012-07-14, retrieved 2012-06-28
- PISA 2009 Results: Executive Summary (Figure 1 only) (PDF), OECD, 2010, retrieved 2012-06-28
- Walker, Maurice (2011), PISA 2009 Plus Results (PDF), OECD, archived from the original (PDF) on 2011-12-22, retrieved 2012-06-28
- Learning for Tomorrow’s World First Results from PISA 2003 (PDF), OECD, 2004-12-14, retrieved 2014-01-06
- PISA 2003 Technical Report (PDF), OECD
- Literacy Skills for the World of Tomorrow: Further Results from PISA 2000 (PDF), OECD, 2003, retrieved 2014-01-06
- M. L. Wu: A Comparison of PISA and TIMSS 2003 achievement results in Mathematics. Paper presented at the AERA Annual Meeting, New York, March 2008.
- "Waiting for "Superman" trailer". Retrieved 8 October 2010.
- Yong Zhao (10 December 2010), A True Wake-up Call for Arne Duncan: The Real Reason Behind Chinese Students Top PISA Performance
- Gumbel, Peter (7 December 2010), "China Beats Out Finland for Top Marks in Education", Time, retrieved 27 June 2012
- Cook, Chris (7 December 2010), "Shanghai tops global state school rankings", Financial Times, retrieved 28 June 2012
- Mance, Henry (7 December 2010), "Why are Chinese schoolkids so good?", Financial Times, retrieved 28 June 2012
- https://ifsv.sund.ku.dk/biostat/biostat_annualreport/images/c/ca/ResearchReport-2011-1.pdf
- Simola, Hannu (2005), "The Finnish miracle of PISA: Historical and sociological remarks on teaching and teacher education" (PDF), Comparative Education, 41 (4): 455–470, doi:10.1080/03050060500317810
- "The Economics Behind International Education Rankings" National Educational Association
- Riddile, Mel (15 December 2010), PISA: It's Poverty Not Stupid, National Association of Secondary School Principals, archived from the original on 22 January 2014, retrieved 15 April 2016
- Cleland, Elizabeth. "What Americans Keep Ignoring About Finland's School Success – Anu Partanen". The Atlantic.
- "Database – PISA 2009". Pisa2009.acer.edu.au. Archived from the original on 2016-03-22. Retrieved 2016-04-15.
- http://ddp-ext.worldbank.org/EdStats/INDprwp08b.pdf
- Initiatives, Educational (November 2006), "Student Learning in the Metros" (PDF), Educational Initiatives
- Vishnoi, Anubhuti (7 January 2012), "Poor PISA ranks: HRD seeks reason", The Indian Express
- Masani, Zareer (27 February 2008). "India still Asia's reluctant tiger". BBC News.
- Paul E. Peterson, Ludger Woessmann, Eric A. Hanushek, and Carlos X. Lastra-Anadón (2011) "Are U.S. students ready to compete? The latest on each state's international standing." Education Next 11:4 (Fall): 51–59. http://educationnext.org/are-u-s-students-ready-to-compete/
- Eric A. Hanushek, Paul E. Peterson, and Ludger Woessmann (2011) "Teaching math to the talented." Education Next 11, no. 1 (Winter): 10–18. http://educationnext.org/teaching-math-to-the-talented/
- Gary W. Phillips (2007) Chance favors the prepared mind: Mathematics and science indicators for comparing states. Washington: American Institutes for Research (14 November); Gary W. Phillips (2009) The Second Derivative:International Benchmarks in Mathematics For U.S. States and School Districts. Washington, DC: American Institutes for Research (June).
- "PISA Mathematics: A Teacher's Guide" (PDF).
- Loveless, Tom. "International Tests Are Not All the Same". Brookings Institution.
- quoted in Valerie Strauss, "How poverty affected U.S. PISA scores", The Washington Post, December 9, 2010.
- "Stratifying PISA scores by poverty rates suggests imitating Finland is not necessarily the way to go for US schools". Simply Statistics. 23 August 2013.
- "Child poverty statistics: how the UK compares to other countries", The Guardian. The same UNICEF figures were used by Riddile.
- Highlights From PISA 2009, Table 3.
- See, Martin Carnoy and Richard Rothstein, "What do international tests really show about U.S. student performance?", Economic Policy Institute, January 28, 2013.
- Valerie Strauss, "U.S. scores on international test lowered by sampling error: report", Washington Post, January 15, 2013.
- Carnoy and Rothstein, "What do international tests really show about U.S. student performance?", Economic Policy Institute, January 28, 2013
- Schleicher was quoted by Amanda Ripley to this effect in her 2011 book, The Smartest Kids in The World (Simon and Schuster).
- Carnoy and Rothstein, "What do international tests really show about U.S. student performance?", EPI, January 28, 2013. Another scholar, Matthew di Carlo of the Albert Shanker Institute, criticized PISA for reporting its results in the form of national rankings, since rankings can give a misleading impression that differences between countries' scores are far larger than is actually the case. Di Carlo also faulted PISA's methodology for disregarding factors such as margin of error. See Matthew di Carlo, "Pisa For Our Time: A Balanced Look", Albert Shanker Institute website, January 10, 2011.
- Carnoy and Rothstein, "What do international tests really show about U.S. student performance?", EPI, January 28, 2013.
Further reading
Official websites and reports
- OECD/PISA website
- OECD (1999): Measuring Student Knowledge and Skills. A New Framework for Assessment. Paris: OECD, ISBN 92-64-17053-7
- OECD (2001): Knowledge and Skills for Life. First Results from the OECD Programme for International Student Assessment (PISA) 2000.
- OECD (2003a): The PISA 2003 Assessment Framework. Mathematics, Reading, Science and Problem Solving Knowledge and Skills. Paris: OECD, ISBN 978-92-64-10172-2
- OECD (2004a): Learning for Tomorrow's World. First Results from PISA 2003. Paris: OECD, ISBN 978-92-64-00724-6
- OECD (2004b): Problem Solving for Tomorrow's World. First Measures of Cross-Curricular Competencies from PISA 2003. Paris: OECD, ISBN 978-92-64-00642-3
- OECD (2005): PISA 2003 Technical Report. Paris: OECD, ISBN 978-92-64-01053-6
- OECD (2007): Science Competencies for Tomorrow's World: Results from PISA 2006
- OECD (2014): PISA 2012 results: Creative problem solving: Students’ skills in tackling real-life problems (Volume V)
Reception and political consequences
- A. P. Jakobi, K. Martens: Diffusion durch internationale Organisationen: Die Bildungspolitik der OECD. In: K. Holzinger, H. Jörgens, C. Knill: Transfer, Diffusion und Konvergenz von Politiken. VS Verlag für Sozialwissenschaften, 2007.
France
- N. Mons, X. Pons: The reception and use of Pisa in France.
Germany
- E. Bulmahn [then federal secretary of education]: PISA: the consequences for Germany. OECD observer, no. 231/232, May 2002. pp. 33–34.
- H. Ertl: Educational Standards and the Changing Discourse on Education: The Reception and Consequences of the PISA Study in Germany. Oxford Review of Education, v 32 n 5 pp 619–634 Nov 2006.
Books
- H. Brügelmann: Vermessene Schulen - standardisierte Schüler. Beltz-Verlag, Weinheim (Deutsch, English summary: https://www.academia.edu/15203894/Evidence-Based_Pedagogy ).
- S. Hopmann, G. Brinek, M. Retzl (eds.): PISA zufolge PISA. PISA According to PISA. LIT-Verlag, Wien 2007, ISBN 3-8258-0946-3 (partly in German, partly in English)
- T. Jahnke, W. Meyerhöfer (eds.): PISA & Co – Kritik eines Programms. Franzbecker, Hildesheim 2007 (2nd edn.), ISBN 978-3-88120-464-4 (in German)
- R. Münch: Globale Eliten, lokale Autoritäten: Bildung und Wissenschaft unter dem Regime von PISA, McKinsey & Co. Frankfurt am Main : Suhrkamp, 2009. ISBN 978-3-518-12560-1 (in German)
Websites
- J . Wuttke: Critical online bibliography
- Correlation of 2009-PISA Scores with National GDP PISA versus GDP