Pamplona, Cagayan
Pamplona, officially the Municipality of Pamplona, is a 4th class municipality in the province of Cagayan, Philippines. According to the 2015 census, it has a population of 23,596 people.[4]
Pamplona | |
|---|---|
| Municipality of Pamplona | |
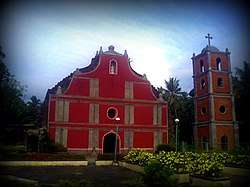 St. Peter the Martyr Parish Church of Pamplona, Cagayan | |
 Seal | |
 Map of Cagayan with Pamplona highlighted | |
OpenStreetMap 
| |
.svg.png) Pamplona Location within the Philippines | |
| Coordinates: 18°27′00″N 121°20′30″E | |
| Country | |
| Region | Cagayan Valley (Region II) |
| Province | Cagayan |
| District | 2nd District |
| Founded | 1842 |
| Barangays | 18 (see Barangays) |
| Government | |
| • Type | Sangguniang Bayan |
| • Mayor | Digna G. Puzon-Antonio |
| • Vice Mayor | Azarelle M. Bilas |
| • Congressman | Samantha Louise V. Alfonso |
| • Electorate | 15,808 voters (2019) |
| Area | |
| • Total | 173.30 km2 (66.91 sq mi) |
| Elevation | 7.0 m (23.0 ft) |
| Population (2015 census)[4] | |
| • Total | 23,596 |
| • Density | 140/km2 (350/sq mi) |
| • Households | 5,074 |
| Economy | |
| • Income class | 4th municipal income class |
| • Poverty incidence | 14.97% (2015)[5] |
| • Revenue (₱) | 81,199,983.60 (2016) |
| Time zone | UTC+8 (PST) |
| ZIP code | 3522 |
| PSGC | |
| IDD : area code | +63 (0)78 |
| Climate type | tropical monsoon climate |
| Native languages | Ilocano Ibanag Atta language Tagalog |
| Website | www |
History
Pamplona is the result of the fusion of two villages; Abulacan (now barrio San Juan) and Masi. Abulacan was founded by the ecclesiastical authorities on April 30, 1757 with San Juan Nepomuceno as the patron saint. Sometime in 1842, Vicar Pedro Montenegro, O.P. convinced the people to unite the two towns. The vicar named it "Pamplona" in memory of his hometown Pamplona in Spain.
After the fusion, an agreement was made that there would be two patron saints of Pamplona: San Juan Nepomuceno and San Pedro de Martir. This is the reason why the town fiesta is celebrated for two days and the images of the two patron saints are carried during religious processions. The town fiesta is celebrated every April 29.
In 1919, some of the prominent people of Pamplona recommended the transfer of the same to Bidduang, a barrio of Pamplona. The transfer was made on November 16, 1919, during the administration of municipal president Esteban Meneses by order of General Wood. In 1928, on the sixth year of the administration of municipal president Paulino Ifurung, one of his last acts was the transfer of the municipal government back to its old site, Pamplona, by then called "Albano."
Most interesting spot is the mouth of the Pamplona River. It saw history in the making for it was the starting point of Salcedo and his conquistadores when they explored Cagayan in 1572. Because of the river's strong current and unpredictable floods, Mayor Nicolas B. Aquino built in 1955 a concrete levee along Barangay Masi. He also built an irrigation system. It was the first of its kind in Cagayan.
The town is also noted for its Malagabavi Cave and waterfall. It is located at the foot of a mountain virtually shaped like a pig. Legend has it that this cave was used by a giant as an entrance to his abode. It is said that he was a normal being like a human until his transformation to a giant by a goddess who fell in love with him.
Barangays
Pamplona is politically subdivided into 18 barangays.
- Abbangkeruan
- Allasitan
- Bagu
- Balingit
- Bidduang
- Cabaggan
- Capalalian
- Casitan
- Centro
- Curva
- Gattu
- Masi (formerly Zimigui-Ziuanan[6])
- Nagattatan
- Nagtupacan
- San Juan
- Santa Cruz (Pimpila)
- Tabba
- Tupanna
Demographics
| Population census of Pamplona | ||
|---|---|---|
| Year | Pop. | ±% p.a. |
| 1903 | 3,089 | — |
| 1918 | 3,672 | +1.16% |
| 1939 | 7,650 | +3.56% |
| 1948 | 8,029 | +0.54% |
| 1960 | 10,026 | +1.87% |
| 1970 | 13,568 | +3.07% |
| 1975 | 14,965 | +1.98% |
| 1980 | 17,603 | +3.30% |
| 1990 | 16,775 | −0.48% |
| 1995 | 18,107 | +1.44% |
| 2000 | 20,142 | +2.31% |
| 2007 | 21,889 | +1.15% |
| 2010 | 23,236 | +2.20% |
| 2015 | 23,596 | +0.29% |
| Source: Philippine Statistics Authority[4][7][8][9] | ||
In the 2015 census, the population of Pamplona, Cagayan, was 23,596 people,[4] with a density of 140 inhabitants per square kilometre or 360 inhabitants per square mile.
Climate
| Climate data for Pamplona, Cagayan | |||||||||||||
|---|---|---|---|---|---|---|---|---|---|---|---|---|---|
| Month | Jan | Feb | Mar | Apr | May | Jun | Jul | Aug | Sep | Oct | Nov | Dec | Year |
| Average high °C (°F) | 25 (77) |
26 (79) |
29 (84) |
31 (88) |
31 (88) |
31 (88) |
30 (86) |
30 (86) |
30 (86) |
28 (82) |
27 (81) |
25 (77) |
29 (84) |
| Average low °C (°F) | 20 (68) |
20 (68) |
21 (70) |
23 (73) |
24 (75) |
25 (77) |
25 (77) |
25 (77) |
24 (75) |
23 (73) |
23 (73) |
21 (70) |
23 (73) |
| Average precipitation mm (inches) | 120 (4.7) |
77 (3.0) |
62 (2.4) |
40 (1.6) |
118 (4.6) |
138 (5.4) |
162 (6.4) |
173 (6.8) |
143 (5.6) |
198 (7.8) |
185 (7.3) |
248 (9.8) |
1,664 (65.4) |
| Average rainy days | 16.9 | 12.2 | 11.5 | 10.6 | 18.7 | 20.1 | 21.2 | 23.3 | 20.8 | 16.9 | 16.5 | 20.0 | 208.7 |
| Source: Meteoblue [10] | |||||||||||||
References
- "Municipality". Quezon City, Philippines: Department of the Interior and Local Government. Retrieved 31 May 2013.
- "Province: Cagayan". PSGC Interactive. Quezon City, Philippines: Philippine Statistics Authority. Retrieved 12 November 2016.
- "Pamplona, Cagayan Profile". PhilAtlas.com. Retrieved 15 June 2020.
- Census of Population (2015). "Region II (Cagayan Valley)". Total Population by Province, City, Municipality and Barangay. PSA. Retrieved 20 June 2016.
- "PSA releases the 2015 Municipal and City Level Poverty Estimates". Quezon City, Philippines. Retrieved 1 January 2020.
- "An Act Changing the Name of Barrio Zimigui-ziuanan, Municipality of Pamplona, Province of Cagayan, to Masi". LawPH.com. Retrieved 2011-04-12.
- Census of Population and Housing (2010). "Region II (Cagayan Valley)". Total Population by Province, City, Municipality and Barangay. NSO. Retrieved 29 June 2016.
- Censuses of Population (1903–2007). "Region II (Cagayan Valley)". Table 1. Population Enumerated in Various Censuses by Province/Highly Urbanized City: 1903 to 2007. NSO.
- "Province of Cagayan". Municipality Population Data. Local Water Utilities Administration Research Division. Retrieved 17 December 2016.
- "Pamplona, Cagayan: Average Temperatures and Rainfall". Meteoblue. Retrieved 15 December 2018.
External links
- Pamplona Profile at PhilAtlas.com
- Unofficial Homepage of Pamplona, Cagayan
- Philippine Standard Geographic Code
- Philippine Census Information
Places adjacent to Pamplona, Cagayan | ||||||||||
|---|---|---|---|---|---|---|---|---|---|---|
| ||||||||||
Tuguegarao (capital) | |
| Municipalities | |
| Component city | |
| Barangays | |