North Carolina's 7th congressional district
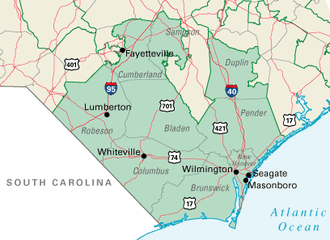
North Carolina's 7th congressional district stretches from Wilmington and the South Carolina border to the southern suburbs of Raleigh.
| North Carolina's 7th congressional district | |||
|---|---|---|---|
.tif.png) North Carolina's 7th congressional district - since January 3, 2017. | |||
| Representative |
| ||
| Distribution |
| ||
| Population (2016) | 780,442[2] | ||
| Median income | $48,345[2] | ||
| Ethnicity |
| ||
| Cook PVI | R+9[3] | ||
The district is represented by Rep. David Rouzer, a Republican. He has been in office since 2015.
From 2003 to 2013 it covered Bladen, Brunswick, Columbus, Cumberland, Duplin, New Hanover, Pender, Robeson, and Sampson counties.
List of members representing the district
| Member | Party | Years | Cong ress |
Electoral history |
|---|---|---|---|---|
| District created March 4, 1793 | ||||
| William B. Grove | Pro-Administration | March 4, 1793 – March 3, 1795 |
3rd 4th 5th 6th 7th |
Redistricted from the 5th district and re-elected in 1793. Re-elected in 1795. Re-elected in 1796. Re-elected in 1798. Re-elected in 1800. Retired. |
| Federalist | March 4, 1795 – March 3, 1803 | |||
| Samuel D. Purviance | Federalist | March 4, 1803 – March 3, 1805 |
8th | Elected in 1803. Retired. |
| Duncan McFarlan | Democratic-Republican | March 4, 1805 – March 3, 1807 |
9th | Elected in 1804. Lost re-election. |
| John Culpepper | Federalist | March 4, 1807 – January 2, 1808 |
10th | Elected in 1806. Seat declared vacant when election contested. |
| Vacant | January 2, 1808 – February 23, 1808 | |||
| John Culpepper | Federalist | February 23, 1808 – March 3, 1809 |
10th | Elected to finish his vacant term. Lost re-election. |
| Archibald McBryde | Federalist | March 4, 1809 – March 3, 1813 |
11th 12th |
Elected in 1808. Re-elected in 1810. Retired. |
| John Culpepper | Federalist | March 4, 1813 – March 3, 1817 |
13th 14th |
Elected in 1813. Re-elected in 1815. Lost re-election. |
| Vacant | March 3, 1817 – January 5, 1818 |
Alexander McMillan was Elected in 1817 but died sometime in 1817. | ||
| James Stewart | Federalist | January 5, 1818 – March 3, 1819 |
15th | Elected January 1, 1818 to finish McMillan's term and seated January 26, 1818. Retired. |
| John Culpepper | Federalist | March 4, 1819 – March 3, 1821 |
16th | Elected in 1819. Lost re-election. |
| Archibald McNeill | Federalist | March 4, 1821 – March 3, 1823 |
17th | Elected in 1821. Retired. |
| John Culpepper | Adams-Clay Federalist | March 4, 1823 – March 3, 1825 |
18th | Elected in 1823. Lost re-election. |
| Archibald McNeill | Jacksonian | March 4, 1825 – March 3, 1827 |
19th | Elected in 1825. Retired. |
| John Culpepper | Anti-Jacksonian | March 4, 1827 – March 3, 1829 |
20th | Elected in 1827. Lost re-election. |
| Edmund Deberry | Anti-Jacksonian | March 4, 1829 – March 3, 1831 |
21st | Elected in 1829. [data unknown/missing] |
| Lauchlin Bethune | Jacksonian | March 4, 1831 – March 3, 1833 |
22nd | [data unknown/missing] |
| Edmund Deberry | Anti-Jacksonian | March 4, 1833 – March 3, 1837 |
23rd 24th 25th 26th 27th |
[data unknown/missing] Redistricted to the 4th district. |
| Whig | March 4, 1837 – March 3, 1843 | |||
| John Daniel | Democratic | March 4, 1843 – March 3, 1847 |
28th 29th |
Redistricted from the 2nd district. Redistricted to the 6th district. |
 James I. McKay |
Democratic | March 4, 1847 – March 3, 1849 |
30th | Redistricted from the 6th district. [data unknown/missing] |
 William S. Ashe |
Democratic | March 4, 1849 – March 3, 1853 |
31st 32nd |
[data unknown/missing] Redistricted to the 3rd district. |
 F. Burton Craige |
Democratic | March 4, 1853 – March 3, 1861 |
33rd 34th 35th 36th |
[data unknown/missing] |
| Civil War and Reconstruction | ||||
| Alexander H. Jones | Republican | July 6, 1868 – March 3, 1871 |
40th 41st |
[data unknown/missing] |
| James C. Harper | Democratic | March 4, 1871 – March 3, 1873 |
42nd | [data unknown/missing] |
 William M. Robbins |
Democratic | March 4, 1873 – March 3, 1879 |
43rd 44th 45th |
[data unknown/missing] |
 Robert F. Armfield |
Democratic | March 4, 1879 – March 3, 1883 |
46th 47th |
[data unknown/missing] |
| Tyre York | Independent Democratic | March 4, 1883 – March 3, 1885 |
48th | [data unknown/missing] |
 John S. Henderson |
Democratic | March 4, 1885 – March 3, 1895 |
49th 50th 51st 52nd 53rd |
[data unknown/missing] |
| Alonzo C. Shuford | Populist | March 4, 1895 – March 3, 1899 |
54th 55th |
[data unknown/missing] |
| Theodore F. Kluttz | Democratic | March 4, 1899 – March 3, 1903 |
56th 57th |
[data unknown/missing] Redistricted to the 8th district. |
 Robert N. Page |
Democratic | March 4, 1903 – March 3, 1917 |
58th 59th 60th 61st 62nd 63rd 64th |
[data unknown/missing] |
| Leonidas D. Robinson | Democratic | March 4, 1917 – March 3, 1921 |
65th 66th |
[data unknown/missing] |
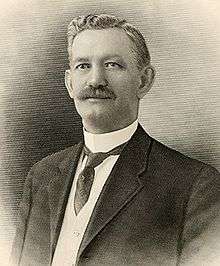
 William C. Hammer |
Democratic | March 4, 1921 – September 26, 1930 |
67th 68th 69th 70th 71st |
[data unknown/missing] Died. |
| Vacant | September 26, 1930 – November 4, 1930 | |||
| Hinton James | Democratic | November 4, 1930 – March 3, 1931 |
71st | [data unknown/missing] |
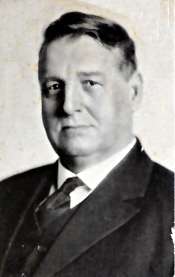
| Walter Lambeth | Democratic | March 4, 1931 – March 3, 1933 |
72nd | [data unknown/missing] Redistricted to the 8th district. |
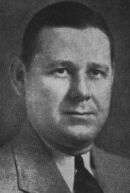
| J. Bayard Clark | Democratic | March 4, 1933 – January 3, 1949 |
73rd 74th 75th 76th 77th 78th 79th 80th |
Redistricted from the 6th district. [data unknown/missing] |
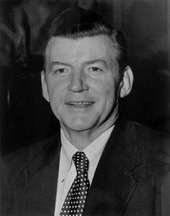
 Frank E. Carlyle |
Democratic | January 3, 1949 – January 3, 1957 |
81st 82nd 83rd 84th |
[data unknown/missing] |
 Alton A. Lennon |
Democratic | January 3, 1957 – January 3, 1973 |
85th 86th 87th 88th 89th 90th 91st 92nd |
[data unknown/missing] |
 Charlie Rose |
Democratic | January 3, 1973 – January 3, 1997 |
93rd 94th 95th 96th 97th 98th 99th 100th 101st 102nd 103rd 104th |
[data unknown/missing] |
 Mike McIntyre |
Democratic | January 3, 1997 – January 3, 2015 |
105th 106th 107th 108th 109th 110th 111th 112th 113th |
[data unknown/missing] |
 David Rouzer |
Republican | January 3, 2015 – Present |
114th 115th 116th |
[data unknown/missing] |
Election results
| Party | Candidate | Votes | % | |
|---|---|---|---|---|
| Republican | David Rouzer | 156,809 | 55.54 | |
| Democratic | Kyle Horton | 120,838 | 42.80 | |
| Constitution | David W. Fallin | 4,655 | 1.65 | |
| Total votes | 282,312 | 100 | ||
| Party | Candidate | Votes | % | |
|---|---|---|---|---|
| Republican | David Rouzer | 211,801 | 60.91 | |
| Democratic | J. Wesley Casteen | 135,905 | 39.09 | |
| Total votes | 347,706 | 100 | ||
| Party | Candidate | Votes | % | |
|---|---|---|---|---|
| Republican | David Rouzer | 134,431 | 59.35 | |
| Democratic | Jonathan Barfield Jr. | 84,054 | 37.11 | |
| Libertarian | J. Wesley Casteen | 7,850 | 3.47 | |
| N/A | Miscellaneous | 163 | 0.07 | |
| N/A | Louis Harmati | 6 | 0 | |
| Total votes | 226,504 | 100 | ||
| Party | Candidate | Votes | % | ± | |
|---|---|---|---|---|---|
| Democratic | Mike McIntyre | 168,695 | 50.10 | -3.58 | |
| Republican | David Rouzer | 168,041 | 49.90 | +3.58 | |
| Majority | 654 | 0.19 | -7.17 | ||
| Turnout | 336,736 | 100 | +58.62 | ||
| Party | Candidate | Votes | % | ± | |
|---|---|---|---|---|---|
| Democratic | Mike McIntyre | 113,957 | 53.68 | -15.16 | |
| Republican | Ilario Gregory Pantano | 98,328 | 46.32 | +15.16 | |
| Majority | 15,629 | 7.36 | -30.33 | ||
| Turnout | 212,285 | 100 | -32.16 | ||
| Party | Candidate | Votes | % | ± | |
|---|---|---|---|---|---|
| Democratic | Mike McIntyre | 215,383 | 68.84 | -3.96 | |
| Republican | Will Breazeale | 97,472 | 31.16 | +3.96 | |
| Majority | 117,911 | 37.69 | -7.91 | ||
| Turnout | 312,885 | 100 | 123.78 | ||
| Party | Candidate | Votes | % | ± | |
|---|---|---|---|---|---|
| Democratic | Mike McIntyre | 101,787 | 72.8 | -0.39 | |
| Republican | Shirley Davis | 38,033 | 27.2 | +0.39 | |
| Majority | 63,754 | 45.6 | -0.77 | ||
| Turnout | 139,820 | 100 | -43.27 | ||
| Party | Candidate | Votes | % | ± | |
|---|---|---|---|---|---|
| Democratic | Mike McIntyre | 180,382 | 73.19 | +2.26 | |
| Republican | Ken Plonk | 66,084 | 26.81 | -0.51 | |
| Majority | 114,298 | 46.37 | -2.56 | ||
| Turnout | 246,466 | 100 | 47.89 | ||
| Party | Candidate | Votes | % | ± | |
|---|---|---|---|---|---|
| Democratic | Mike McIntyre | 118,543 | 71.13 | +1.38 | |
| Republican | James R. Adams | 45,537 | 27.32 | -2.62 | |
| Libertarian | David Michael Brooks | 2,574 | 1.54 | +0.23 | |
| Majority | 73,006 | 43.81 | +3.01 | ||
| Turnout | 166,654 | 100 | -27.44 | ||
| Party | Candidate | Votes | % | ± | |
|---|---|---|---|---|---|
| Democratic | Mike McIntyre | 160,185 | 69.75 | -21.5 | |
| Republican | James R. Adams | 66,463 | 28.94 | +28.94 | |
| Libertarian | Bob Burns | 3,018 | 1.31 | -7.44 | |
| Majority | 93,722 | 40.8 | -41.7 | ||
| Turnout | 229,666 | 100 | +68.51 | ||
| Party | Candidate | Votes | % | ± | |
|---|---|---|---|---|---|
| Democratic | Mike McIntyre | 124,366 | 91.25 | +38.37 | |
| Libertarian | Paul Meadows | 11,924 | 8.75 | +7.8 | |
| Majority | 112,442 | 82.50 | +75.44 | ||
| Turnout | 136,290 | 100 | -17.62 | ||
| Party | Candidate | Votes | % | |
|---|---|---|---|---|
| Democratic | Mike McIntyre | 87,487 | 52.88 | |
| Republican | Bill Caster | 75,811 | 45.82 | |
| Libertarian | Chris Nubel | 1,573 | 0.95 | |
| Natural Law | Garrison King Frantz | 569 | 0.34 | |
| Majority | 11,676 | 7.06 | ||
| Turnout | 165,440 | 100 | ||
Historical district boundaries
.tif.png)
References
- Martis, Kenneth C. (1989). The Historical Atlas of Political Parties in the United States Congress. New York: Macmillan Publishing Company.
- Martis, Kenneth C. (1982). The Historical Atlas of United States Congressional Districts. New York: Macmillan Publishing Company.
- Congressional Biographical Directory of the United States 1774–present
- https://www.census.gov/geo/maps-data/data/cd_state.html
- Center for New Media & Promotion (CNMP), US Census Bureau. "My Congressional District". www.census.gov.
- "Partisan Voting Index – Districts of the 115th Congress" (PDF). The Cook Political Report. April 7, 2017. Retrieved April 7, 2017.
- "11/06/2018 Official General Election Results - Statewide". North Carolina State Board of Elections. 27 November 2018. Retrieved 22 May 2019.
- "11/08/2016 Official General Election Results - Statewide". North Carolina State Board of Elections. 13 December 2016. Retrieved 22 December 2017.
- "11/04/2014 Official General Election Results - Statewide". North Carolina State Board of Elections. 13 December 2016. Retrieved 22 December 2017.
- "NC State Board of Elections Official Results". North Carolina State Board of Elections. Retrieved 9 October 2013.
- "NC - Election Results". North Carolina State Board of Elections. Retrieved 1 May 2012.
- "NC - Election Results". North Carolina State Board of Elections. Retrieved 1 May 2012.
- "2006 General Election Results" (PDF). North Carolina State Board of Elections. Retrieved 1 May 2012.
- "2004 General Election Results" (PDF). North Carolina State Board of Elections. Retrieved 1 May 2012.
- "2002 General Election Results" (PDF). North Carolina State Board of Elections. Retrieved 1 May 2012.
- "Official Results By County For General Election of the State of North Carolina" (PDF). North Carolina State Board of Elections. Retrieved 1 May 2012.
- "US House - 07th" (PDF). North Carolina State Board of Elections. Retrieved 1 May 2012.
- "United States House of Representatives: Abstract of Votes Cast in the General Election held on November 5, 1996" (PDF). North Carolina State Board of Elections. Retrieved 1 May 2012.
External links
This article is issued from Wikipedia. The text is licensed under Creative Commons - Attribution - Sharealike. Additional terms may apply for the media files.