Misery index (economics)
The misery index is an economic indicator, created by economist Arthur Okun. The index helps determine how the average citizen is doing economically and it is calculated by adding the seasonally adjusted unemployment rate to the annual inflation rate. It is assumed that both a higher rate of unemployment and a worsening of inflation create economic and social costs for a country.[1]
Misery index by US presidential administration
| President | Time Period | Average | Low | High | Start | End | Change |
|---|---|---|---|---|---|---|---|
| Harry Truman | 1948–1952 | 7.88 | 3.45 – Dec 1952 | 13.63 – Jan 1948 | 13.63 | 3.45 | -10.18 |
| Dwight D. Eisenhower | 1953–1960 | 9.26 | 2.97 – Jul 1953 | 10.98 – Apr 1958 | 3.28 | 9.96 | +5.68 |
| John F. Kennedy | 1961–1962 | 7.14 | 6.40 – Jul 1962 | 8.38 – Jul 1961 | 8.31 | 6.82 | -1.49 |
| Lyndon B. Johnson | 1963–1968 | 6.77 | 5.70 – Nov 1965 | 8.19 – Jul 1968 | 7.02 | 8.12 | +1.10 |
| Richard Nixon | 1969–1974 | 10.57 | 7.80 – Jan 1969 | 17.01 – Jul 1974 | 7.80 | 17.01 | +9.21 |
| Gerald Ford | 1974–1976 | 16.00 | 12.66 – Dec 1976 | 19.90 – Jan 1975 | 16.36 | 12.66 | -3.70 |
| Jimmy Carter | 1977–1980 | 16.26 | 12.60 – Apr 1978 | 21.98 – Jun 1980 | 12.72 | 19.72 | +7.00 |
| Ronald Reagan | 1981–1988 | 12.19 | 7.70 – Dec 1986 | 19.33 – Jan 1981 | 19.33 | 9.72 | -9.61 |
| George H. W. Bush | 1989–1992 | 10.68 | 9.64 – Sep 1989 | 14.47 – Nov 1990 | 10.07 | 10.30 | +0.23 |
| Bill Clinton | 1993–2000 | 7.80 | 5.74 – Apr 1998 | 10.56 – Jan 1993 | 10.56 | 7.29 | -3.27 |
| George W. Bush | 2001–2008 | 8.11 | 5.71 – Oct 2006 | 11.47 – Aug 2008 | 7.93 | 7.39 | -0.54 |
| Barack Obama | 2009–2016 | 8.83 | 5.06 – Sep 2015 | 12.87 – Sep 2011 | 7.83 | 6.77 | -1.06 |
| Donald Trump | 2017–Apr 2020 Incomplete data | 6.30 | 5.21 – Sep 2019 | 15.03 – Apr 2020 | 7.30 | 15.03 | +7.73 |
Variations
Harvard Economist Robert Barro created what he dubbed the "Barro Misery Index" (BMI), in 1999.[3] The BMI takes the sum of the inflation and unemployment rates, and adds to that the interest rate, plus (minus) the shortfall (surplus) between the actual and trend rate of GDP growth.
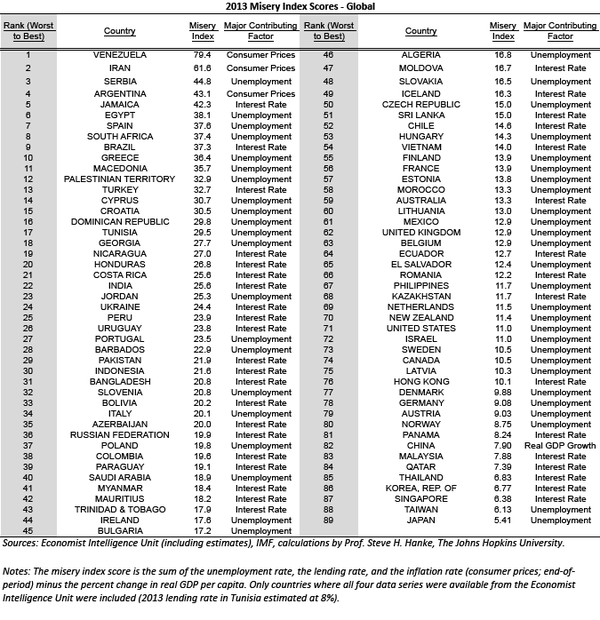
In the late 2000s, Johns Hopkins economist Steve Hanke built upon Barro's misery index and began applying it to countries beyond the United States. His modified misery index is the sum of the interest, inflation, and unemployment rates, minus the year-over-year percent change in per-capita GDP growth.[4]
Hanke has recently constructed a World Table of Misery Index Scores by exclusively relying on data reported by the Economist Intelligence Unit.[5] This table includes a list of 89 countries, ranked from worst to best, with data as of December 31, 2013 (see table below).
Political economists Jonathan Nitzan and Shimshon Bichler found a negative correlation between a similar "stagflation index" and corporate amalgamation (i.e. mergers and acquisitions) in the United States since the 1930s. In their theory, stagflation is a form of political economic sabotage employed by corporations to achieve differential accumulation, in this case as an alternative to amalgamation when merger and acquisition opportunities have run out.[6]
Misery Index of 2016
| Misery Index 2016[7] | |||
| Ranked from worst to best | |||
| Rank | Country | Misery Index | Major Contributing Factor |
| 1 | 573.4 | Consumer Price | |
| 2 | 83.8 | Consumer Price | |
| 3 | 75 | Lending Rates | |
| 4 | 44.9 | Unemployment | |
| 5 | 43.9 | Consumer Price | |
| 6 | 36 | Lending Rates | |
| 7 | 35.9 | Consumer Price | |
| 8 | 30.7 | Lending Rates | |
| 9 | 29.3 | Lending Rates | |
| 10 | 28.7 | Lending Rates | |
| 11 | 28.1 | Unemployment | |
| 12 | 27.4 | Lending Rates | |
| 13 | 24.2 | Unemployment | |
| 14 | 24.1 | Lending Rates | |
| 15 | 23 | Unemployment | |
| 16 | 22.1 | Lending Rates | |
| 17 | 19.1 | Unemployment | |
| 18 | 18.4 | Lending Rates | |
| 19 | 17.5 | Lending Rates | |
| 20 | 17.1 | Lending Rates | |
| 21 | 15.5 | Unemployment | |
| 22 | 14.8 | Unemployment | |
| 23 | 14.7 | Unemployment | |
| 24 | 14.4 | Lending Rates | |
| 25 | 14.4 | Unemployment | |
| 26 | 12.5 | Lending Rates | |
| 27 | 11.8 | Unemployment | |
| 28 | 11.7 | Unemployment | |
| 29 | 11.5 | Unemployment | |
| 30 | 11.3 | Unemployment | |
| 31 | 11.3 | Unemployment | |
| 32 | 11.1 | Unemployment | |
| 33 | 10.9 | Unemployment | |
| 34 | 10 | Unemployment | |
| 35 | 10 | Lending Rates | |
| 36 | 9.8 | Unemployment | |
| 37 | 9.6 | Unemployment | |
| 38 | 9.4 | Lending Rates | |
| 39 | 9.4 | Unemployment | |
| 40 | 9.3 | Lending Rates | |
| 41 | 9.2 | Unemployment | |
| 42 | 8.7 | Unemployment | |
| 43 | 8.6 | Unemployment | |
| 44 | 8.4 | Unemployment | |
| 45 | 7.9 | Unemployment | |
| 46 | 7.8 | Unemployment | |
| 47 | 7.6 | Lending Rates | |
| 48 | 7.1 | Unemployment | |
| 49 | 6.8 | Unemployment | |
| 50 | 6.4 | Unemployment | |
| 51 | 6.3 | Unemployment | |
| 52 | 6.2 | Unemployment | |
| 53 | 5.9 | Lending Rates | |
| 54 | 5.5 | Unemployment | |
| 55 | 5.5 | Unemployment | |
| 56 | 5.5 | Unemployment | |
| 57 | 4.9 | Lending Rates | |
| 58 | 4.5 | Lending Rates | |
| 59 | 3.8 | Unemployment | |
Criticism
A 2001 paper looking at large-scale surveys in Europe and the United States concluded that unemployment more heavily influences unhappiness than inflation. This implies that the basic misery index underweights the unhappiness attributable to the unemployment rate: "the estimates suggest that people would trade off a 1-percentage-point increase in the employment rate for a 1.7-percentage-point increase in the inflation rate."[8]
Misery and crime
Some economists posit that the components of the Misery Index drive the crime rate to a degree. Using data from 1960 to 2005, they have found that the Misery Index and the crime rate correlate strongly and that the Misery Index seems to lead the crime rate by a year or so.[9] In fact, the correlation is so strong that the two can be said to be cointegrated, and stronger than correlation with either the unemployment rate or inflation rate alone.
Data sources
The data for the misery index is obtained from unemployment data published by the U.S. Department of Labor (U3) and the Inflation Rate (CPI-U) from the Bureau of Labor Statistics. The exact methods used for measuring unemployment and inflation have changed over time, although past data is usually normalized so that past and future metrics are comparable.
See also
References
- "The US Misery Index". Inflationdata.com.
- "US Misery Index by President".
- Robert J. Barro. "Reagan Vs. Clinton: Who's The Economic Champ?". Bloomberg.
- Steve H. Hanke (March 2011). "Misery in MENA". Cato Institute: appeared in Globe Asia.
- Steve H. Hanke (May 2014). "Measuring Misery around the World". Cato Institute: appeared in Globe Asia.
- Nitzan and Bichler (2009). Capital as Power: A Study of Order and Creorder. RIPE Series in Global Political Economy. Routledge. pp. 384–386.CS1 maint: uses authors parameter (link)
- The World’s Most – And Least – Miserable Countries in 2016
- Di Tella, Rafael; MacCulloch, Robert J. and Oswald, Andrew (2001). "Preferences over Inflation and Unemployment: Evidence from Surveys of Happiness" (PDF). American Economic Review. 91 (1): 335–341, 340.CS1 maint: uses authors parameter (link)
- Tang, Chor Foon; Lean, Hooi Hooi. "New evidence from the misery index in the crime function". pp. 112–115. doi:10.1016/j.econlet.2008.11.026.
External links
- The current and historical Misery Index
- The Misery Index by President
- The Misery Index By Year
- Cato Publications Commentary
- Correlations of Misery Index and Consumer Sentiment
Deprivation and poverty indicators | |||||
|---|---|---|---|---|---|
| Social |
| ||||
| Psychological |
| ||||
| Economic |
| ||||
| Physical |
| ||||
| Complex measures |
| ||||
| Gender |
| ||||
| Other | |||||
| |||||