Millville, California
Millville is a census-designated place (CDP) in Shasta County, California, United States. The population was 727 at the 2010 census, up from 610 at the 2000 census.
Millville | |
|---|---|
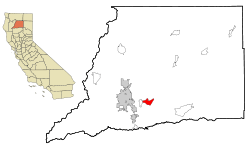 Location in Shasta County and the state of California | |
| Coordinates: 40°33′21″N 122°11′7″W | |
| Country | |
| State | |
| County | Shasta |
| Area | |
| • Total | 8.213 sq mi (21.272 km2) |
| • Land | 8.046 sq mi (20.839 km2) |
| • Water | 0.167 sq mi (0.433 km2) 2.04% |
| Elevation | 510 ft (157 m) |
| Population (2010) | |
| • Total | 727 |
| • Density | 89/sq mi (34/km2) |
| Time zone | UTC-8 (Pacific (PST)) |
| • Summer (DST) | UTC-7 (PDT) |
| ZIP code | 96062 |
| Area code(s) | 530 |
| FIPS code | 06-47724 |
| GNIS feature ID | 0228775 |
Geography
Millville is located at 40°33′21″N 122°11′7″W (40.555904, -122.185250).[2]
According to the United States Census Bureau, the CDP has a total area of 8.2 square miles (21 km2), 97.96% of it land and 2.04% of it water.
Demographics
2010
At the 2010 census Millville had a population of 727. The population density was 88.5 people per square mile (34.2/km²). The racial makeup of Millville was 673 (92.6%) White, 0 (0.0%) African American, 6 (0.8%) Native American, 6 (0.8%) Asian, 1 (0.1%) Pacific Islander, 22 (3.0%) from other races, and 19 (2.6%) from two or more races. Hispanic or Latino of any race were 50 people (6.9%).[3]
The whole population lived in households, no one lived in non-institutionalized group quarters and no one was institutionalized.
There were 268 households, 95 (35.4%) had children under the age of 18 living in them, 180 (67.2%) were opposite-sex married couples living together, 24 (9.0%) had a female householder with no husband present, 11 (4.1%) had a male householder with no wife present. There were 8 (3.0%) unmarried opposite-sex partnerships, and 3 (1.1%) same-sex married couples or partnerships. 44 households (16.4%) were one person and 24 (9.0%) had someone living alone who was 65 or older. The average household size was 2.71. There were 215 families (80.2% of households); the average family size was 3.05.
The age distribution was 178 people (24.5%) under the age of 18, 42 people (5.8%) aged 18 to 24, 126 people (17.3%) aged 25 to 44, 246 people (33.8%) aged 45 to 64, and 135 people (18.6%) who were 65 or older. The median age was 47.4 years. For every 100 females, there were 93.9 males. For every 100 females age 18 and over, there were 94.0 males.
There were 287 housing units at an average density of 34.9 per square mile, of the occupied units 230 (85.8%) were owner-occupied and 38 (14.2%) were rented.The homeowner vacancy rate was 1.7%; the rental vacancy rate was 5.0%. 623 people (85.7% of the population) lived in owner-occupied housing units and 104 people (14.3%) lived in rental housing units.
2000
At the 2000 census there were 610 people, 217 households, and 182 families in the CDP. The population density was 73.8 people per square mile (28.5/km²). There were 229 housing units at an average density of 27.7 per square mile (10.7/km²). The racial makeup of the CDP was 95.41% White, 0.16% Native American, 1.15% Asian, 0.66% from other races, and 2.62% from two or more races. Hispanic or Latino of any race were 2.79%.[4]
Of the 217 households 34.1% had children under the age of 18 living with them, 75.6% were married couples living together, 5.1% had a female householder with no husband present, and 16.1% were non-families. 12.4% of households were one person and 4.6% were one person aged 65 or older. The average household size was 2.81 and the average family size was 3.05.
The age distribution was 26.4% under the age of 18, 5.4% from 18 to 24, 20.3% from 25 to 44, 33.3% from 45 to 64, and 14.6% 65 or older. The median age was 44 years. For every 100 females, there were 94.3 males. For every 100 females age 18 and over, there were 95.2 males.
The median household income was $51,406 and the median family income was $53,000. Males had a median income of $41,917 versus $27,031 for females. The per capita income for the CDP was $27,218. About 5.9% of families and 7.9% of the population were below the poverty line, including 12.1% of those under age 18 and 2.7% of those age 65 or over.
Politics
In the state legislature Millville is in the 1st Senate District, represented by Republican Brian Dahle,[5] and the 1st Assembly District, represented by Republican Megan Dahle.[6]
Federally, Millville is in California's 1st congressional district, represented by Republican Doug LaMalfa.[7]
References
- U.S. Census Archived 2012-01-25 at the Wayback Machine
- "US Gazetteer files: 2010, 2000, and 1990". United States Census Bureau. 2011-02-12. Retrieved 2011-04-23.
- "2010 Census Interactive Population Search: CA - Millville CDP". U.S. Census Bureau. Archived from the original on July 15, 2014. Retrieved July 12, 2014.
- "U.S. Census website". United States Census Bureau. Retrieved 2008-01-31.
- "Senators". State of California. Retrieved March 10, 2013.
- "Members Assembly". State of California. Retrieved March 2, 2013.
- "California's 1st Congressional District - Representatives & District Map". Civic Impulse, LLC. Retrieved March 1, 2013.
Municipalities and communities of Shasta County, California, United States | ||
|---|---|---|
| Cities | 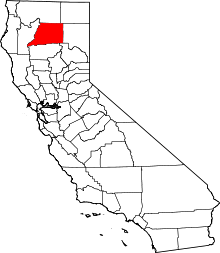 Shasta County map | |
| CDPs | ||
| Unincorporated communities | ||
| Indian reservations | ||
| Ghost towns |
| |
| Footnotes | ‡This populated place also has portions in an adjacent county or counties | |