Kirchleerau
Kirchleerau is a municipality in the district of Zofingen in the canton of Aargau in Switzerland.
Kirchleerau | |
|---|---|
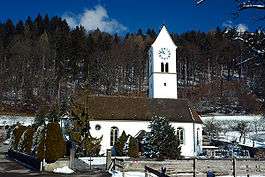 Kirchleerau village church | |
 Coat of arms | |
Location of Kirchleerau 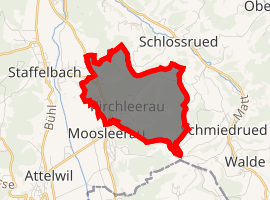
| |
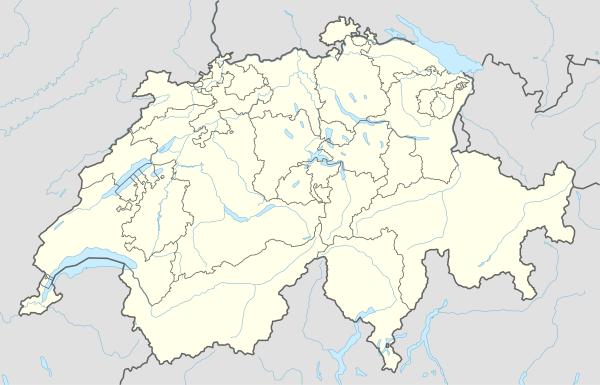 Kirchleerau Kirchleerau | |
| Coordinates: 47°17′N 8°4′E | |
| Country | Switzerland |
| Canton | Aargau |
| District | Zofingen |
| Area | |
| • Total | 4.36 km2 (1.68 sq mi) |
| Elevation | 512 m (1,680 ft) |
| Population (2018-12-31)[2] | |
| • Total | 863 |
| • Density | 200/km2 (510/sq mi) |
| Postal code | 5054 |
| SFOS number | 4275 |
| Surrounded by | Moosleerau, Schlossrued, Schmiedrued, Staffelbach |
| Website | www SFSO statistics |
History
Kirchleerau is first mentioned in 1248 as Lerowe.[3]
Geography
Kirchleerau has an area, as of 2009, of 4.36 square kilometers (1.68 sq mi). Of this area, 1.81 km2 (0.70 sq mi) or 41.5% is used for agricultural purposes, while 2.18 km2 (0.84 sq mi) or 50.0% is forested. Of the rest of the land, 0.37 km2 (0.14 sq mi) or 8.5% is settled (buildings or roads).[4]
Of the built up area, housing and buildings made up 4.4% and transportation infrastructure made up 2.5%. Out of the forested land, all of the forested land area is covered with heavy forests. Of the agricultural land, 21.6% is used for growing crops and 18.1% is pastures, while 1.8% is used for orchards or vine crops.[4]
The municipality is located in the Zofingen district, in an eastern side valley to the Suhre river valley (Suhrental).
Coat of arms
The blazon of the municipal coat of arms is Azure a Church Argent windowed and doored Sable and roofed Gules on a Base Vert. The church (German: Kirche) makes this an example of canting.[5]
Demographics
Kirchleerau has a population (as of December 2018) of 863[6] As of June 2009, 6.4% of the population are foreign nationals.[7] Over the last 10 years (1997–2007) the population has changed at a rate of 1.1%. Most of the population (as of 2000) speaks German(97.3%), with Serbo-Croatian being second most common ( 1.0%) and French being third ( 0.3%).[8]
The age distribution, as of 2008, in Kirchleerau is; 64 children or 8.6% of the population are between 0 and 9 years old and 74 teenagers or 9.9% are between 10 and 19. Of the adult population, 82 people or 11.0% of the population are between 20 and 29 years old. 117 people or 15.7% are between 30 and 39, 130 people or 17.4% are between 40 and 49, and 114 people or 15.3% are between 50 and 59. The senior population distribution is 85 people or 11.4% of the population are between 60 and 69 years old, 49 people or 6.6% are between 70 and 79, there are 28 people or 3.8% who are between 80 and 89,and there are 3 people or 0.4% who are 90 and older.[9]
As of 2000 the average number of residents per living room was 0.5 which is fewer people per room than the cantonal average of 0.57 per room. In this case, a room is defined as space of a housing unit of at least 4 m2 (43 sq ft) as normal bedrooms, dining rooms, living rooms, kitchens and habitable cellars and attics.[10] About 63% of the total households were owner occupied, or in other words did not pay rent (though they may have a mortgage or a rent-to-own agreement).[11]
As of 2000, there were 17 homes with 1 or 2 persons in the household, 121 homes with 3 or 4 persons in the household, and 146 homes with 5 or more persons in the household.[12] As of 2000, there were 296 private households (homes and apartments) in the municipality, and an average of 2.3 persons per household.[8] In 2008 there were 163 single family homes (or 51.4% of the total) out of a total of 317 homes and apartments.[13] There were a total of 0 empty apartments for a 0.0% vacancy rate.[13] As of 2007, the construction rate of new housing units was 4 new units per 1000 residents.[8]
In the 2007 federal election the most popular party was the SVP which received 49.07% of the vote. The next three most popular parties were the FDP (12.87%), the SP (12.75%) and the CVP (7.18%). In the federal election, a total of 283 votes were cast, and the voter turnout was 47.9%.[14]
The historical population is given in the following table:[3][9]
| Historical population | ||
|---|---|---|
| Year | Pop. | ±% |
| 1764 | 236 | — |
| 1850 | 688 | +191.5% |
| 1900 | 478 | −30.5% |
| 1950 | 520 | +8.8% |
| 1990 | 660 | +26.9% |
| 2000 | 701 | +6.2% |
Economy
As of 2007, Kirchleerau had an unemployment rate of 1.61%. As of 2005, there were 67 people employed in the primary economic sector and about 20 businesses involved in this sector. 94 people are employed in the secondary sector and there are 9 businesses in this sector. 442 people are employed in the tertiary sector, with 21 businesses in this sector.[8]
In 2000 there were 414 workers who lived in the municipality. Of these, 313 or about 75.6% of the residents worked outside Kirchleerau while 128 people commuted into the municipality for work. There were a total of 229 jobs (of at least 6 hours per week) in the municipality.[15] Of the working population, 5.9% used public transportation to get to work, and 63.7% used a private car.[8]
Religion
From the 2000 census, 126 or 18.0% were Roman Catholic, while 492 or 70.2% belonged to the Swiss Reformed Church.[12]
Education
The entire Swiss population is generally well educated. In Kirchleerau about 76.8% of the population (between age 25-64) have completed either non-mandatory upper secondary education or additional higher education (either university or a Fachhochschule).[8] Of the school age population (in the 2008/2009 school year), there are 59 students attending primary school in the municipality.[12]
References
- "Arealstatistik Standard - Gemeinden nach 4 Hauptbereichen". Federal Statistical Office. Retrieved 13 January 2019.
- "Ständige Wohnbevölkerung nach Staatsangehörigkeitskategorie Geschlecht und Gemeinde; Provisorische Jahresergebnisse; 2018". Federal Statistical Office. 9 April 2019. Retrieved 11 April 2019.
- Kirchleerau in German, French and Italian in the online Historical Dictionary of Switzerland.
- Swiss Federal Statistical Office-Land Use Statistics 2009 data (in German) accessed 25 March 2010
- Flags of the World.com accessed 31-May-2010
- Swiss Federal Statistical Office - STAT-TAB, online database – Ständige und nichtständige Wohnbevölkerung nach institutionellen Gliederungen, Geburtsort und Staatsangehörigkeit (in German) accessed 23 September 2019
- Statistical Department of Canton Aargau -Bereich 01 -Bevölkerung (in German) accessed 20 January 2010
- Swiss Federal Statistical Office Archived 2016-01-05 at the Wayback Machine accessed 31-May-2010
- Statistical Department of Canton Aargau -Bevölkerungsdaten für den Kanton Aargau und die Gemeinden (Archiv) (in German) accessed 20 January 2010
- Eurostat. "Housing (SA1)". Urban Audit Glossary (PDF). 2007. p. 18. Archived from the original (pdf) on 14 November 2009. Retrieved 12 February 2010.
- Urban Audit Glossary pg 17
- Statistical Department of Canton Aargau - Aargauer Zahlen 2009 (in German) accessed 20 January 2010
- Statistical Department of Canton Aargau (in German) accessed 20 January 2010
- Swiss Federal Statistical Office, Nationalratswahlen 2007: Stärke der Parteien und Wahlbeteiligung, nach Gemeinden/Bezirk/Canton Archived 2015-05-14 at the Wayback Machine (in German) accessed 28 May 2010
- Statistical Department of Canton Aargau-Bereich 11 Verkehr und Nachrichtenwesen (in German) accessed 21 January 2010
| Wikimedia Commons has media related to Kirchleerau. |
Municipalities in Zofingen District, Switzerland | ||
|---|---|---|