Juban, Sorsogon
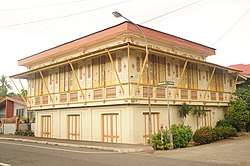
Juban, officially the Municipality of Juban, is a 4th class municipality in the province of Sorsogon, Philippines. According to the 2015 census, it has a population of 32,320 people.[3]
Juban | |
|---|---|
| Municipality of Juban | |
 | |
 Seal | |
 Map of Sorsogon with Juban highlighted | |
OpenStreetMap 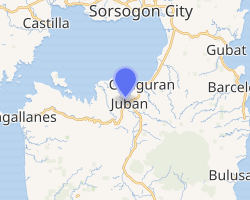
| |
.svg.png) Juban Location within the Philippines | |
| Coordinates: 12°51′N 123°59′E | |
| Country | |
| Region | Bicol Region (Region V) |
| Province | Sorsogon |
| District | 2nd district |
| Founded | 7 April 1799 |
| Barangays | 25 (see Barangays) |
| Government | |
| • Type | Sangguniang Bayan |
| • Mayor | Antonio H. Alindogan |
| • Vice Mayor | Felipe G. Guasa |
| • Congressman | Ma. Bernardita B. Ramos |
| • Electorate | 21,880 voters (2019) |
| Area | |
| • Total | 121.49 km2 (46.91 sq mi) |
| Elevation | 13.2 m (43.3 ft) |
| Population (2015 census)[3] | |
| • Total | 32,320 |
| • Density | 270/km2 (690/sq mi) |
| • Households | 6,636 |
| Economy | |
| • Income class | 4th municipal income class |
| • Poverty incidence | 40.21% (2015)[4] |
| • Revenue (₱) | 92,989,441.52 (2016) |
| Time zone | UTC+8 (PST) |
| ZIP code | 4703 |
| PSGC | |
| IDD : area code | +63 (0)56 |
| Climate type | tropical rainforest climate |
| Native languages | Sorsoganon Tagalog |
Barangays
Juban is politically subdivided into 25 barangays.
- Añog
- Aroroy
- Bacolod
- Binanuahan
- Biriran
- Buraburan
- Calateo
- Calmayon
- Caruhayon
- Catanagan
- Catanusan
- Cogon
- Embarcadero
- Guruyan
- Lajong
- Maalo
- North Poblacion
- South Poblacion
- Puting Sapa
- Rangas
- Sablayan
- Sipaya
- Taboc
- Tinago
- Tughan
Demographics
| Population census of Juban | ||
|---|---|---|
| Year | Pop. | ±% p.a. |
| 1903 | 7,043 | — |
| 1918 | 12,234 | +3.75% |
| 1939 | 11,960 | −0.11% |
| 1948 | 11,967 | +0.01% |
| 1960 | 12,918 | +0.64% |
| 1970 | 16,286 | +2.34% |
| 1975 | 16,809 | +0.64% |
| 1980 | 19,660 | +3.18% |
| 1990 | 20,671 | +0.50% |
| 1995 | 23,803 | +2.68% |
| 2000 | 26,848 | +2.61% |
| 2007 | 28,989 | +1.06% |
| 2010 | 30,335 | +1.67% |
| 2015 | 32,320 | +1.21% |
| Source: Philippine Statistics Authority[3][5][6][7] | ||
Climate
| Climate data for Juban, Sorsogon | |||||||||||||
|---|---|---|---|---|---|---|---|---|---|---|---|---|---|
| Month | Jan | Feb | Mar | Apr | May | Jun | Jul | Aug | Sep | Oct | Nov | Dec | Year |
| Average high °C (°F) | 27 (81) |
28 (82) |
29 (84) |
31 (88) |
31 (88) |
30 (86) |
29 (84) |
29 (84) |
29 (84) |
29 (84) |
29 (84) |
28 (82) |
29 (84) |
| Average low °C (°F) | 22 (72) |
21 (70) |
22 (72) |
23 (73) |
24 (75) |
25 (77) |
25 (77) |
25 (77) |
25 (77) |
24 (75) |
23 (73) |
23 (73) |
24 (74) |
| Average precipitation mm (inches) | 65 (2.6) |
44 (1.7) |
42 (1.7) |
39 (1.5) |
87 (3.4) |
150 (5.9) |
184 (7.2) |
153 (6.0) |
163 (6.4) |
154 (6.1) |
127 (5.0) |
100 (3.9) |
1,308 (51.4) |
| Average rainy days | 13.9 | 9.2 | 11.0 | 12.5 | 19.6 | 24.3 | 26.5 | 25.0 | 25.5 | 24.4 | 19.4 | 15.1 | 226.4 |
| Source: Meteoblue (modeled/calculated data, not measured locally)[8] | |||||||||||||
References
- "Municipality". Quezon City, Philippines: Department of the Interior and Local Government. Retrieved 31 May 2013.
- "Province: Sorsogon". PSGC Interactive. Quezon City, Philippines: Philippine Statistics Authority. Retrieved 12 November 2016.
- Census of Population (2015). "Region V (Bicol Region)". Total Population by Province, City, Municipality and Barangay. PSA. Retrieved 20 June 2016.
- "PSA releases the 2015 Municipal and City Level Poverty Estimates". Quezon City, Philippines. Retrieved 1 January 2020.
- Census of Population and Housing (2010). "Region V (Bicol Region)". Total Population by Province, City, Municipality and Barangay. NSO. Retrieved 29 June 2016.
- Censuses of Population (1903–2007). "Region V (Bicol Region)". Table 1. Population Enumerated in Various Censuses by Province/Highly Urbanized City: 1903 to 2007. NSO.
- "Province of Sorsogon". Municipality Population Data. Local Water Utilities Administration Research Division. Retrieved 17 December 2016.
- "Juban, Sorsogon : Average Temperatures and Rainfall". Meteoblue. Retrieved 29 December 2018.
External links
| Wikimedia Commons has media related to Juban, Sorsogon. |
- Juban Profile at PhilAtlas.com
- Philippine Standard Geographic Code
- Philippine Census Information
- Local Governance Performance Management System
Places adjacent to Juban, Sorsogon | |
|---|---|
Sorsogon City (capital) | |
| Municipalities | |
| Component city | |
This article is issued from Wikipedia. The text is licensed under Creative Commons - Attribution - Sharealike. Additional terms may apply for the media files.