Jipapad, Eastern Samar
Jipapad, officially the Municipality of Jipapad, is a 5th class municipality in the province of Eastern Samar, Philippines. According to the 2015 census, it has a population of 7,885 people.[3]
Jipapad | |
|---|---|
| Municipality of Jipapad | |
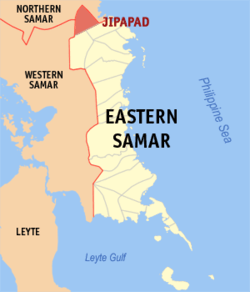 Map of Eastern Samar with Jipapad highlighted | |
| |
.svg.png) Jipapad Location within the Philippines | |
| Coordinates: 12°17′N 125°14′E | |
| Country | |
| Region | Eastern Visayas (Region VIII) |
| Province | Eastern Samar |
| District | Lone District |
| Barangays | 13 (see Barangays) |
| Government | |
| • Type | Sangguniang Bayan |
| • Mayor | Benjamin E. Ver |
| • Vice Mayor | Delia G. Monleon |
| • Congressman | Maria Fe R. Abunda |
| • Municipal Council | Councilors
|
| • Electorate | 6,425 voters (2019) |
| Area | |
| • Total | 234.8 km2 (90.7 sq mi) |
| Elevation | 16.3 m (53.5 ft) |
| Population (2015 census)[3] | |
| • Total | 7,885 |
| • Density | 34/km2 (87/sq mi) |
| • Households | 1,721 |
| Economy | |
| • Income class | 5th municipal income class |
| • Poverty incidence | 49.87% (2015)[4] |
| • Revenue (₱) | 63,765,851.26 (2016) |
| Time zone | UTC+8 (PST) |
| ZIP code | 6804 |
| PSGC | |
| IDD : area code | +63 (0)55 |
| Climate type | tropical rainforest climate |
| Native languages | Waray Tagalog |
| Website | www |
Barangays
Demographics
| Population census of Jipapad | ||
|---|---|---|
| Year | Pop. | ±% p.a. |
| 1918 | 17,013 | — |
| 1939 | 1,347 | −11.38% |
| 1948 | 2,005 | +4.52% |
| 1960 | 2,201 | +0.78% |
| 1970 | 3,769 | +5.52% |
| 1975 | 4,497 | +3.61% |
| 1980 | 4,586 | +0.39% |
| 1990 | 5,207 | +1.28% |
| 1995 | 6,222 | +3.39% |
| 2000 | 6,596 | +1.26% |
| 2007 | 6,882 | +0.59% |
| 2010 | 7,397 | +2.66% |
| 2015 | 7,885 | +1.22% |
| Source: Philippine Statistics Authority[3][5][6][7] | ||
The population of Jipapad in the 2015 census was 7,885 people,[3] with a density of 34 inhabitants per square kilometre or 88 inhabitants per square mile.
Climate
| Climate data for Jipapad, Eastern Samar | |||||||||||||
|---|---|---|---|---|---|---|---|---|---|---|---|---|---|
| Month | Jan | Feb | Mar | Apr | May | Jun | Jul | Aug | Sep | Oct | Nov | Dec | Year |
| Average high °C (°F) | 27 (81) |
27 (81) |
28 (82) |
29 (84) |
30 (86) |
30 (86) |
29 (84) |
29 (84) |
29 (84) |
29 (84) |
28 (82) |
28 (82) |
29 (83) |
| Average low °C (°F) | 22 (72) |
22 (72) |
22 (72) |
23 (73) |
24 (75) |
24 (75) |
24 (75) |
24 (75) |
24 (75) |
24 (75) |
23 (73) |
23 (73) |
23 (74) |
| Average precipitation mm (inches) | 105 (4.1) |
67 (2.6) |
65 (2.6) |
53 (2.1) |
86 (3.4) |
129 (5.1) |
135 (5.3) |
113 (4.4) |
131 (5.2) |
163 (6.4) |
167 (6.6) |
162 (6.4) |
1,376 (54.2) |
| Average rainy days | 17.6 | 13.2 | 15.5 | 14.9 | 19.6 | 24.3 | 26.6 | 25.4 | 24.9 | 25.4 | 22.9 | 20.9 | 251.2 |
| Source: Meteoblue [8] | |||||||||||||
References
- "Municipality". Quezon City, Philippines: Department of the Interior and Local Government. Retrieved 31 May 2013.
- "Province: Eastern Samar". PSGC Interactive. Quezon City, Philippines: Philippine Statistics Authority. Retrieved 12 November 2016.
- Census of Population (2015). "Region VIII (Eastern Visayas)". Total Population by Province, City, Municipality and Barangay. PSA. Retrieved 20 June 2016.
- "PSA releases the 2015 Municipal and City Level Poverty Estimates". Quezon City, Philippines. Retrieved 12 October 2019.
- Census of Population and Housing (2010). "Region VIII (Eastern Visayas)". Total Population by Province, City, Municipality and Barangay. NSO. Retrieved 29 June 2016.
- Censuses of Population (1903–2007). "Region VIII (Eastern Visayas)". Table 1. Population Enumerated in Various Censuses by Province/Highly Urbanized City: 1903 to 2007. NSO.
- "Province of Eastern Samar". Municipality Population Data. Local Water Utilities Administration Research Division. Retrieved 17 December 2016.
- "Jipapad, Eastern Samar : Average Temperatures and Rainfall". Meteoblue. Retrieved 31 December 2018.
External links
- Jipapad Profile at PhilAtlas.com
- Philippine Standard Geographic Code
- Philippine Census Information
- Local Governance Performance Management System
Places adjacent to Jipapad, Eastern Samar | ||||||||||
|---|---|---|---|---|---|---|---|---|---|---|
| ||||||||||
Borongan (capital) | |
| Municipalities | |
| Component city | |
This article is issued from Wikipedia. The text is licensed under Creative Commons - Attribution - Sharealike. Additional terms may apply for the media files.