Internet rush hour
Internet rush hour is the time period when the majority of Internet users are online at the same time. Typically, in the UK the peak hours are between 7 and 11 pm.[1] During this time frame, users commonly experience slowness while browsing or downloading content. The congestion experienced during the rush hour is similar to transportation rush hour, where demand for resources outweighs capacity.
In contrast to the hours cited above from a source dated 2011, a Google Analytics report[2] dated 2017 indicates very strongly that daily web use peaks between 9am and midday, falling off steadily throughout the day with a modest levelling off between 7pm and 10pm, and then collapses to a base at 4am.
Reasons
Growth
Global Internet usage has increased significantly across the world from 12,881,000 hosts in 1998 to 908,585,739 hosts in 2012.[3] Internet use has surged with the introduction of mobile devices and tablet computing. Internet access has also changed during this time frame from 56kbit/s dial-up to high-speed bandwidth access at 100Mbit/s or higher. The increase in Internet users and increase in access bandwidth is a contributing factor to the Internet Rush Hour.
The table below shows the big picture of world internet usage versus the population.
| World Regions | Population (2012 est) | Internet Users (Dec. 31, 2000) | Internet Users Latest Data | Penetration (% Population) | Growth 2000 - 2012 | Users % of Table |
|---|---|---|---|---|---|---|
| Africa | 1,073,380,925 | 45,144,000 | 167,335,676 | 15.66% | 3,606.7% | 7.0% |
| Asia | 3,922,066,987 | 114,304,000 | 1,076,681,059 | 27.5% | 841.9% | 44.8% |
| Europe | 820,918,446 | 105,096,093 | 518,512,109 | 63.2% | 393.4% | 21.5% |
| Middle East | 223,608,203 | 3,284,800 | 90,000,455 | 40.2% | 2,639.9% | 3.7% |
| North America | 348,280,154 | 108,096,800 | 273,785,413 | 78.6% | 153.3% | 11.4% |
| Latin America / Caribbean | 593,688,638 | 18,068,919 | 254,915,745 | 42.9% | 1,310.8% | 10.6% |
| Oceania / Australia | 35,903,569 | 7,620,480 | 24,287,919 | 67.6% | 218.7% | 1.0% |
| WORLD TOTAL | 7,017,846,922 | 360,985,492 | 2,405,518,376 | 34.3% | 566.4% | 100% |
| Source: Internet World Stats.[4] | ||||||
Infrastructure
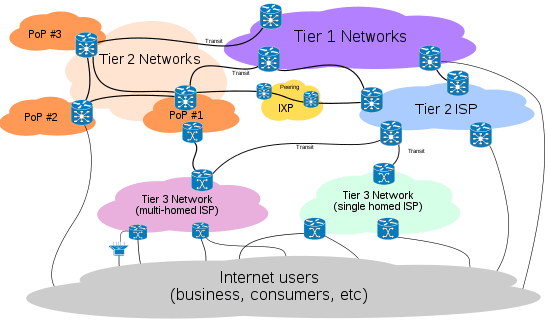
End users connect to the Internet through Internet service providers (ISPs). The Tier 1 ISPs own the infrastructure, which includes routers, switches and fiber optic footprints. The back bone of the Internet is connected through Tier 1 ISPs that peer with other Tier 1 ISPs in a transit-free network. These peering agreements between Tier 1 ISPs have no overt settlements, meaning there is no money exchanged for the right to pass traffic between Tier 1 peers. Tier 2 and Tier 3 ISPs are customers of the Tier 1 ISPs and rely on the Tier 1 ISPs to route their traffic across the Internet. This is a disadvantage for the lower tier ISPs due to the amount of traffic hops and shared common gateways to Tier 1 ISPs.[5] The shared common gateways are choke points that contribute to the Internet Rush Hour. Each Tier 1 ISP has a peering policy that defines how IP Traffic exchanges are created and guidelines for managing peer traffic.
Tier 1 Internet service providers
- AT&T | AS 7018
- DTAG | AS 3320
- XO | AS 2828
- Telecom Italia | AS 6762
- Inteliquent | AS 3257
- Verizon | AS 701
- Sprint | AS 1239
- Telia | AS 1299
- NTT | AS 2914
- Level 3 | AS 1 / 3356 / 3549
- Tata | AS 6453
- Telefónica | AS 12956
- Zayo | AS 6461
Bandwidth throttling
Some ISPs have been criticized for implementing bandwidth throttling to intentionally slow down a user's internet service at various points on the network. The key problem at peak hour is however the peering capacity: it represents the size of the doors between two networks. If everyone wants to go through the door at the same time, it gets jammed. The constant increase in Internet traffic requires regular increases in the size of the peering points and there is a dispute as to who is going to cover the cost of these increases. For instance, Netflix and Google are reported to represent more than 50% of peak hour downstream traffic in the US in a study by Sandvine (figures for October 2013). There is a commercial and legal battle in progress to determine who will pay for the costs induced by peak hour traffic. Three positions exist:
- The users must cover the cost through higher subscription fees because they generate the higher traffic.
- The ISPs must cover the cost because they receive money from the users to access the Internet and it's part of their job to guarantee that the users can access the services.
- The top content providers must cover the cost because they receive money from the user to access their service and they use an unfair share of the Internet infrastructure.
As an example of these fights, Comcast went up against the Federal Communications Commission (FCC) in regard to net neutrality, or keeping their networks open regardless of the content.[6] The federal appeals court ruled that the FCC had no authority to stop Comcast from slowing internet traffic.
Performance
British broadband
A study with British telecom regulators, Ofcom and SamKnows Broadband determined that the average British broadband connection actually achieves less than half its advertised speed.[7] That study determined that the average broadband speed was 3.6Mbit/s versus an advertised speed of 7.2Mbit/s with speed declining 30% during Internet Rush hour.
Netflix
Netflix rated various ISPs in 2011 on their ability to stream content to consumers and determine what type of bandwidth the ISPs provide. Netflix tested HD streams which use about 4800 kilobits per second and averaged what ISPs were able to provide. The top 10 ISPs are rated in the order of performance: Charter, Comcast, Time Warner, Cox, Suddenlink, Cablevision, Cable One, Verizon, AT&T and Bell South.[8]
FCC broadband study
The United States Federal Communications Commission (FCC) measuring broadband program from August 2011, is a study of performance in the United States covering 80% of the residential market. The report measures ISPs promise of performance to advertised bandwidth rates. In 2011, the average ISP delivered 87 percent of advertised rates, increasing to 96 percent performance in 2012.[9] Average broadband speeds increased from 11.1Mbit/s in 2011 to 14.3Mbit/s in 2012. Further increases may be inhibited by outdated modems which prevent ISPs from controlling broadband performance.
References
- Tom Lawrence (2011-11-16). "Evening internet 'rush-hour' affects Broadband users - News - Gadgets & Tech". London: The Independent. Retrieved 2013-03-25.
- "Google Analytics: hour of day & day of week reports". hallaminternet.com. 2017-01-05. Retrieved 2019-08-10.
- "Internet host count history | Internet Systems Consortium". Isc.org. 2012-07-06. Archived from the original on 2012-05-18. Retrieved 2013-03-25.
- "World Internet Users Statistics Usage and World Population Stats". Internetworldstats.com. Retrieved 2013-03-25.
- http://www.us.ntt.net/downloads/papers/IDC_Tier1_ISPs.pdf
- Kang, Cecilia (2010-04-07). "Court rules for Comcast over FCC in 'net neutrality' case". Washingtonpost.com. Retrieved 2013-03-25.
- "British broadband running at half the headline speed | Broadband | News". PC Pro. 2009-01-08. Retrieved 2013-03-25.
- Lee, Amy (2011-01-28). "Netflix Ranks Internet Provider Performance: See Who's Fastest". Huffingtonpost.com. Retrieved 2013-03-25.
- "Measuring Broadband America - July 2012". FCC.gov. Retrieved 2013-03-25.
Internet in the Americas | ||
|---|---|---|
| ||
| Sovereign states |
| .svg.png) |
| ||
Internet in Asia | |
|---|---|
| Sovereign states |
|
| States with limited recognition |
|
| Dependencies and other territories |
|
| |