Global Internet usage
Global Internet usage is the number of people who use the Internet worldwide.
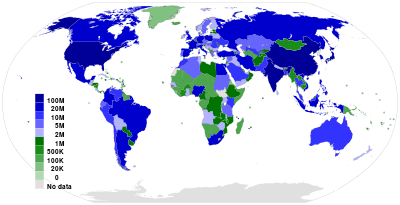
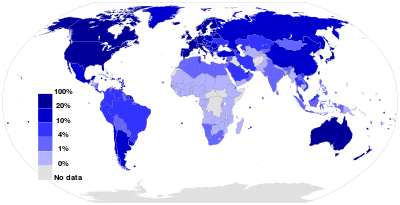
Internet users
In 2015, the International Telecommunication Union estimated about 3.2 billion people, or almost half of the world's population, would be online by the end of the year. Of them, about 2 billion would be from developing countries, including 89 million from least developed countries.[1][2]

|
| ||||||||||||||||||||||||||||||||||||||||||||||||||||||||||||||||||||||
 Source: International Telecommunications Union.[8] |
 Source: International Telecommunications Union.[8] |


Source: Information Geographies at the Oxford Internet Institute.[10]
Broadband usage
|
| |||||||||||||||||||||||||||||||||||||||||||||||||||||||||||||||||||||||||||||||||||||||||||||||||||||||||||||||||||||||||
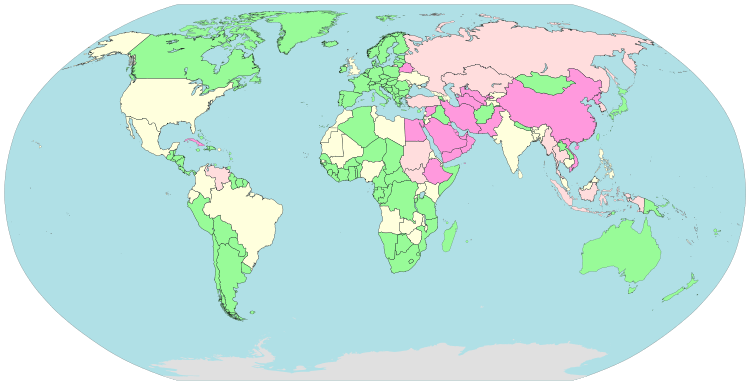
 Fixed broadband Internet subscriptions in 2012 Source: International Telecommunications Union.[13]as a percentage of a country's population |
 Mobile broadband Internet subscriptions in 2012 Source: International Telecommunications Union.[14]as a percentage of a country's population |

Source: Information Geographies at the Oxford Internet Institute.[15]
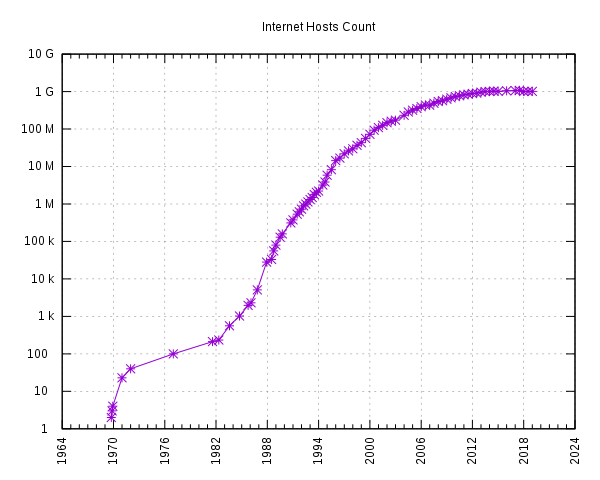
Internet hosts
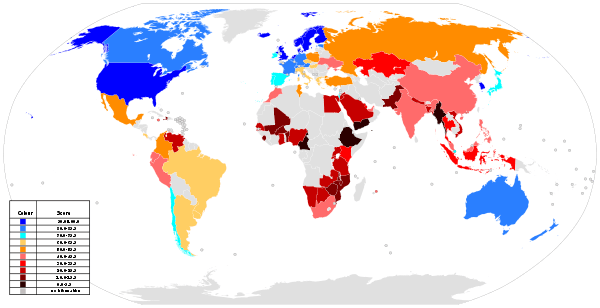
Web index
The Web index is a composite statistic designed and produced by the World Wide Web Foundation. It provides a multi-dimensional measure of the World Wide Web’s contribution to development and human rights globally. It covers 86 countries as of 2014, the latest year for which the index has been compiled.[17][18] It incorporates indicators that assess the areas of universal access, freedom and openness, relevant content, and empowerment, which indicate economic, social, and political impacts of the Web.
IPv4 addresses
The Carna Botnet was a botnet of 420,000 devices created by hackers to measure the extent of the Internet in what the creators called the "Internet Census of 2012".[19][20]

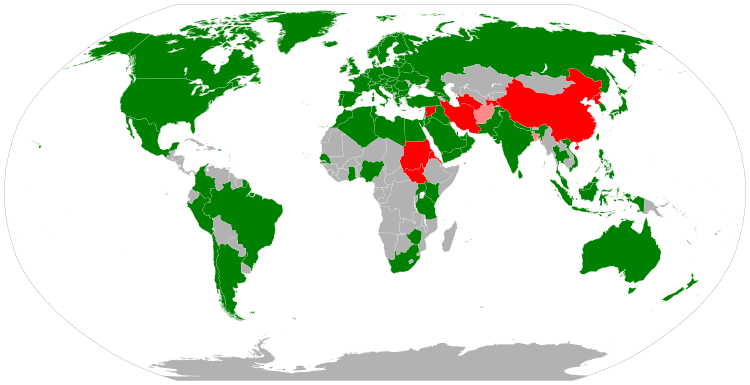
Censorship and surveillance
Sources: Freedom on the Net,[24] OpenNet Initiative,[25][26] Reporters Without Borders.[27][28]
See also
References
- "Internet used by 3.2 billion people in 2015". 26 May 2015 – via bbc.com.
- http://www.itu.int/en/ITU-D/Statistics/Documents/facts/ICTFactsFigures2015.pdf
- "Individuals using the Internet 2005 to 2014", Key ICT indicators for developed and developing countries and the world (totals and penetration rates), International Telecommunication Union (ITU). Retrieve 25 May 2015.
- "Internet users per 100 inhabitants 1997 to 2007", ICT Data and Statistics (IDS), International Telecommunication Union (ITU). Retrieved 25 May 2015. Archived May 17, 2015, at the Wayback Machine
- "Total Midyear Population for the World: 1950-2050"". International Programs Center for Demographic and Economic Studies, U.S. Census Bureau. Archived from the original on 2017-04-17. Retrieved 2020-02-28.
- "Measuring digital development: Facts and figures 2019". Telecommunication Development Bureau, International Telecommunication Union (ITU). Retrieved 2020-02-28.
- "Measuring digital development: Facts and figures 2019". Telecommunication Development Bureau, International Telecommunication Union (ITU). Retrieved 2020-02-28.
- "Percentage of Individuals using the Internet 2000–2012", International Telecommunications Union (Geneva), June 2013. Retrieved 22 June 2013
- "World Telecommunication/ICT Indicators Database". United Nations.
- "Internet Population and Penetration 2011", Information Geographies at the Oxford Internet Institute.
- "Total Midyear Population for the World: 1950-2050"". International Programs Center for Demographic and Economic Studies, U.S. Census Bureau. Archived from the original on 2017-04-17. Retrieved 2020-02-28.
- "Measuring digital development: Facts and figures 2019". Telecommunication Development Bureau, International Telecommunication Union (ITU). Retrieved 2020-02-28.
- "Fixed (wired)-broadband subscriptions per 100 inhabitants 2012", Dynamic Report, ITU ITC EYE, International Telecommunication Union. Retrieved 29 June 2013.
- "Active mobile-broadband subscriptions per 100 inhabitants 2012", Dynamic Report, ITU ITC EYE, International Telecommunication Union. Retrieved 29 June 2013.
- "Broadband affordability", Information Geographies at the Oxford Internet Institute.
- "Internet host count history" Archived 2012-05-18 at the Wayback Machine, Internet Systems Consortium. Retrieved September 2011
- "Web Index 2014 data". World Wide Web Foundation. Retrieved 5 April 2017.
- "Web Index – taking a break in 2015". World Wide Web Foundation. 24 November 2014. Retrieved 5 April 2017.
- Stöcker, Christian; Horchert, Judith (2013-03-22). "Mapping the Internet: A Hacker's Secret Internet Census". Der Spiegel.
- Kleinman, Alexis (2013-03-22). "The Most Detailed, GIF-Based Map of the Internet Was Made By Hacking 420,000 Computers". HuffPost.
- "Internet Census 2012: Port scanning /0 using insecure embedded devices" Archived 2015-10-13 at the Wayback Machine, Carna Botnet, 2012
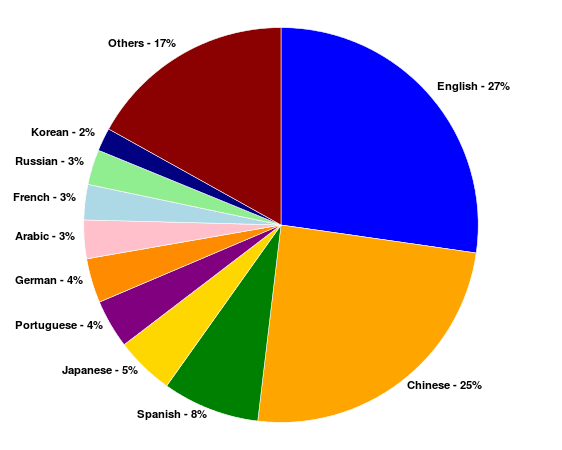
- "Usage of content languages for websites". W3Techs.com. Retrieved 26 April 2013.
- "Number of Internet Users by Language", Internet World Stats, Miniwatts Marketing Group, 31 May 2011. Retrieved 22 April 2012
- "Freedom on the Net 2018" (PDF). Freedom House. November 2018. Retrieved 1 November 2018.
- OpenNet Initiative "Summarized global Internet filtering data spreadsheet", 8 November 2011 and "Country Profiles", the OpenNet Initiative is a collaborative partnership of the Citizen Lab at the Munk School of Global Affairs, University of Toronto; the Berkman Center for Internet & Society at Harvard University; and the SecDev Group, Ottawa
- Due to legal concerns the OpenNet Initiative does not check for filtering of child pornography and because their classifications focus on technical filtering, they do not include other types of censorship.
- "Internet Enemies" Archived 2014-03-12 at the Wayback Machine, Enemies of the Internet 2014: Entities at the heart of censorship and surveillance, Reporters Without Borders (Paris), 11 March 2014. Retrieved 24 June 2014.
- Internet Enemies Archived 2012-03-23 at the Wayback Machine, Reporters Without Borders (Paris), 12 March 2012
External links
- "ICT Data and Statistics", International Telecommunications Union (ITU).
- Internet Live Stats, Real Time Statistics Project.
- Internet World Stats: Usage and Population Statistics, Miniwatts Marketing Group.
- "40 maps that explain the internet", Timothy B. Lee, Vox Media, 2 June 2014.
- "Information Geographies", Oxford Internet Institute.
- "Internet Monitor", a research project of the Berkman Center for Internet & Society at Harvard University to evaluate, describe, and summarize the means, mechanisms, and extent of Internet access, content controls and activity around the world.
Internet in the Americas | ||
|---|---|---|
| ||
| Sovereign states |
| .svg.png) |
| ||
Internet in Asia | |
|---|---|
| Sovereign states |
|
| States with limited recognition |
|
| Dependencies and other territories |
|
| |