Gingerbreadman map
In dynamical systems theory, the Gingerbreadman map is a chaotic two-dimensional map. It is given by the piecewise linear transformation:[1]

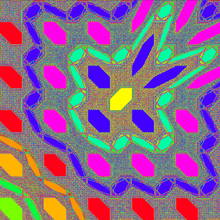
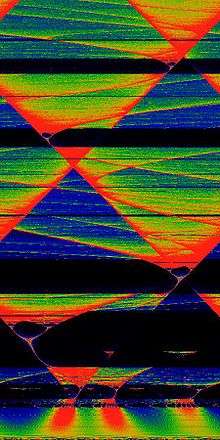
Gingerbreadman map for subset :
the color of each point is related to the relative orbit period.
To view the gingerbread man, you must rotate the image 135 degrees clockwise.

See also
References
- Devaney, Robert L. (1988), "Fractal patterns arising in chaotic dynamical systems", in Peitgen, Heinz-Otto; Saupe, Dietmar (eds.), The Science of Fractal Images, Springer-Verlag, pp. 137–168, doi:10.1007/978-1-4612-3784-6_3. See in particular Fig. 3.3.
External links

This article is issued from Wikipedia. The text is licensed under Creative Commons - Attribution - Sharealike. Additional terms may apply for the media files.