Fujin City
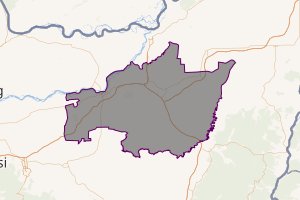
Fujin (simplified Chinese: 富锦; traditional Chinese: 富錦; pinyin: Fùjǐn) is a county-level city in the east of Heilongjiang province, People's Republic of China. It is under the jurisdiction of the prefecture-level city of Jiamusi.
Fujin 富锦市 | |
|---|---|
| |
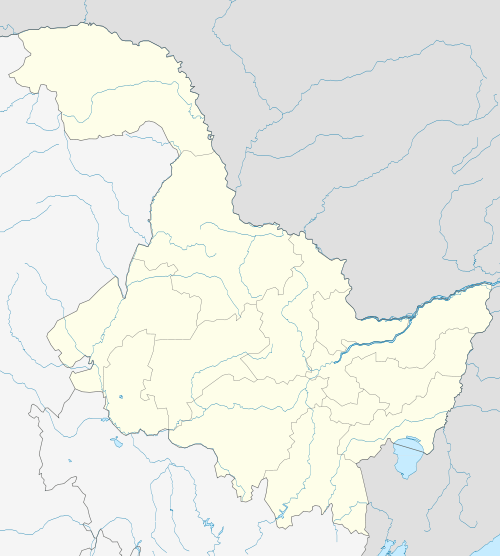 Fujin Location in Heilongjiang | |
| Coordinates: 47°15′N 132°2′E | |
| Country | People's Republic of China |
| Province | Heilongjiang |
| Prefecture-level city | Jiamusi |
| Elevation | 62 m (205 ft) |
| Population (1999) | |
| • Total | 424,491 |
| Time zone | UTC+8 (China Standard) |
| Postal code | 156100 |
| Area code(s) | 0454 |
| Climate | Dwb |
| Website | fujin |
Demographics
The population of the district was 424,491 in 1999.[1]
31163-013: Wind Power Development Project: The scope of the Project comprises (i) construction of wind farms at Dabancheng in the Xinjiang Autonomous Region (30 MW); at Fujin in Heilongjiang Province (24 MW); and at Xiwaizi in Liaoning Province (24 MW); and (ii) technical assistance for Barrier Removal and Institutional Strengthening to promote wind-based power generation in the three provinces. http://adb.org/projects/31163-013/details
Climate
Fujin has a humid continental climate (Köppen Dwa), with long, bitterly cold, but dry winters, and humid, very warm summers. The monthly daily mean temperature in January, the coldest month, is −19.0 °C (−2.2 °F), and July, the warmest month, averages 22.2 °C (72.0 °F), with an average annual temperature +3.37 °C (38.1 °F). Close to three-fifths of the annual precipitation falls from June to August. With monthly percent possible sunshine ranging from 46% in the three summer months to 70% in February, there are 2,408 hours of bright sunshine annually.
| Climate data for Fujin, Heilongjiang (1981–2010 normals) | |||||||||||||
|---|---|---|---|---|---|---|---|---|---|---|---|---|---|
| Month | Jan | Feb | Mar | Apr | May | Jun | Jul | Aug | Sep | Oct | Nov | Dec | Year |
| Record high °C (°F) | 1.7 (35.1) |
9.2 (48.6) |
20.5 (68.9) |
31.7 (89.1) |
34.2 (93.6) |
37.8 (100.0) |
38.9 (102.0) |
36.3 (97.3) |
32.2 (90.0) |
27.8 (82.0) |
16.1 (61.0) |
6.6 (43.9) |
38.9 (102.0) |
| Average high °C (°F) | −14.1 (6.6) |
−8.6 (16.5) |
0.2 (32.4) |
11.6 (52.9) |
19.7 (67.5) |
24.9 (76.8) |
27.0 (80.6) |
25.4 (77.7) |
20.1 (68.2) |
10.9 (51.6) |
−1.9 (28.6) |
−11.8 (10.8) |
8.6 (47.5) |
| Daily mean °C (°F) | −19.0 (−2.2) |
−14.5 (5.9) |
−5.2 (22.6) |
5.8 (42.4) |
13.7 (56.7) |
19.5 (67.1) |
22.2 (72.0) |
20.8 (69.4) |
14.5 (58.1) |
5.5 (41.9) |
−6.6 (20.1) |
−16.3 (2.7) |
3.4 (38.1) |
| Average low °C (°F) | −23.1 (−9.6) |
−19.8 (−3.6) |
−10.6 (12.9) |
0.5 (32.9) |
7.8 (46.0) |
14.2 (57.6) |
17.6 (63.7) |
16.6 (61.9) |
9.5 (49.1) |
0.7 (33.3) |
−10.8 (12.6) |
−20.3 (−4.5) |
−1.5 (29.4) |
| Record low °C (°F) | −37.8 (−36.0) |
−34.1 (−29.4) |
−27.6 (−17.7) |
−12.9 (8.8) |
−3.7 (25.3) |
3.6 (38.5) |
7.5 (45.5) |
6.2 (43.2) |
−3.1 (26.4) |
−15.5 (4.1) |
−27.7 (−17.9) |
−35.2 (−31.4) |
−37.8 (−36.0) |
| Average precipitation mm (inches) | 6.2 (0.24) |
6.6 (0.26) |
14.3 (0.56) |
26.7 (1.05) |
47.0 (1.85) |
77.7 (3.06) |
104.8 (4.13) |
117.5 (4.63) |
56.4 (2.22) |
33.1 (1.30) |
11.6 (0.46) |
10.5 (0.41) |
512.4 (20.17) |
| Average precipitation days (≥ 0.1 mm) | 6.3 | 5.1 | 5.9 | 8.5 | 12.1 | 13.5 | 12.1 | 13.2 | 10.9 | 8.9 | 6.7 | 8.3 | 111.5 |
| Average relative humidity (%) | 70 | 66 | 62 | 59 | 59 | 69 | 77 | 80 | 73 | 64 | 64 | 70 | 68 |
| Mean monthly sunshine hours | 173.4 | 201.5 | 243.3 | 203.1 | 232.4 | 214.2 | 219.6 | 203.3 | 205.3 | 191.0 | 170.2 | 150.4 | 2,407.7 |
| Percent possible sunshine | 63 | 70 | 66 | 50 | 50 | 46 | 46 | 46 | 55 | 57 | 61 | 57 | 54 |
| Source: China Meteorological Administration (precipitation days and sunshine 1971–2000)[2][3] | |||||||||||||
Notes and references
- (in English) National Population Statistics Materials by County and City - 1999 Period, in China County & City Population 1999, Harvard China Historical GIS
- 中国气象数据网 - WeatherBk Data (in Chinese). China Meteorological Administration. Retrieved 2020-04-15.
- 中国地面国际交换站气候标准值月值数据集(1971-2000年). China Meteorological Administration. Archived from the original on 2013-09-21. Retrieved 2010-05-25.
See also
External links
- (in Chinese) Government site - Google translation