Economy of Libya
The economy of Libya depends primarily on revenues from the petroleum sector, which represents over 95% of export earnings and 60% of GDP.[13] These oil revenues and a small population have given Libya one of the highest nominal per capita GDP in Africa.[14][13]
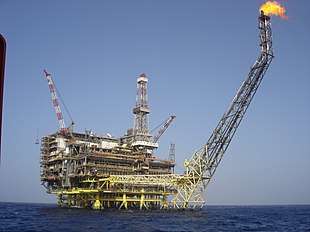 Libya's economy relies heavily on oil. The ENI Oil Bouri DP4 in the Bouri Field is the biggest platform in the Mediterranean sea. | |
| Currency | Libyan dinar (LYD, ل.د) |
|---|---|
| calendar year | |
Trade organisations | OPEC, COMESA, CEN-SAD, AMU |
Country group |
|
| Statistics | |
| Population | |
| GDP | |
| GDP rank | |
GDP growth |
|
GDP per capita | |
GDP per capita rank | |
GDP by sector |
|
| 9.293% (2018)[4] | |
Population below poverty line |
|
| N/A | |
Labour force | |
Labour force by occupation |
|
| Unemployment | 30% (2004 est.)[7] |
Main industries | petroleum, steel, iron, food processing, textiles, cement |
| External | |
| Exports | |
Export goods | crude oil, refined petroleum products, natural gas, chemicals |
Main export partners | |
| Imports | $11.36 billion (2017 est.)[7] |
Import goods | machinery, transport equipment, semi-finished goods, food, consumer products |
Main import partners | |
FDI stock | |
Gross external debt | |
| Public finances | |
| −25.1% (of GDP) (2017 est.)[7] | |
| Revenues | 15.78 billion (2017 est.)[7] |
| Expenses | 23.46 billion (2017 est.)[7] |
| Economic aid | recipient ODA $9 million (2010), $642 million (2011), $87 million (2012)[12] |
Foreign reserves | |
After 2000, Libya recorded favourable growth rates with an estimated 10.6% growth of GDP in 2010. This development was interrupted by the Libyan Civil War, which resulted in contraction of the economy by 62.1% in 2011. After the war the economy rebounded by 104.5% in 2012, but then crashed again following the Second Libyan Civil War.[15] As of 2017, Libya's per capita PPP GDP stands at 60% of its pre-wars level.[15]
Macro-economy trend
Libya had seen a fantastic growth rate, however, these proved unsustainable in the face of global oil recession and international sanctions. Consequently, the GDP per capita shrank by 40% in the 1980s. Successful diversification and integration into the international community helped current GDP per capita to cut further deterioration to just 3.2% in the 1990s.
Libyan GDP per capita was about $40 in the early 1920s and it rose to $1,018 by 1967. In 1947 alone, per capita GDP rose by 42 percent.
The following table shows the main economic indicators in 1980–2017. Inflation below 5% is in green.[16]
| Year | GDP (in Bil. US$ PPP) |
GDP per capita (in US$ PPP) |
GDP growth (real) |
Inflation rate (in Percent) |
Budget balance (in % of GDP) |
|---|---|---|---|---|---|
| 1980 | 83.3 | 27,894 | n/a | ||
| 1981 | n/a | ||||
| 1982 | n/a | ||||
| 1983 | n/a | ||||
| 1984 | n/a | ||||
| 1985 | n/a | ||||
| 1986 | n/a | ||||
| 1987 | n/a | ||||
| 1988 | n/a | ||||
| 1989 | n/a | ||||
| 1990 | |||||
| 1991 | |||||
| 1992 | |||||
| 1993 | |||||
| 1994 | |||||
| 1995 | |||||
| 1996 | |||||
| 1997 | |||||
| 1998 | |||||
| 1999 | |||||
| 2000 | |||||
| 2001 | |||||
| 2002 | |||||
| 2003 | |||||
| 2004 | |||||
| 2005 | |||||
| 2006 | |||||
| 2007 | |||||
| 2008 | |||||
| 2009 | |||||
| 2010 | |||||
| 2011 | |||||
| 2012 | |||||
| 2013 | |||||
| 2014 | |||||
| 2015 | |||||
| 2016 | |||||
| 2017 |
Notes:
1. For purchasing power parity comparisons, the US Dollar is exchanged at 0.77 Libyan Dinars only.
Mean wages were $9.51 per man-hour in 2009 (amounts to a compensation of $1598 for 21 working days of 8 hours).
Oil sector
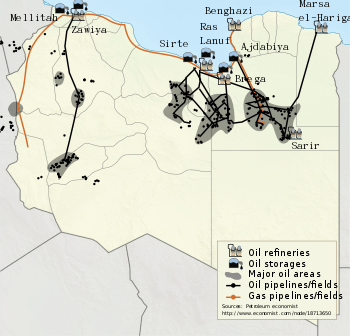
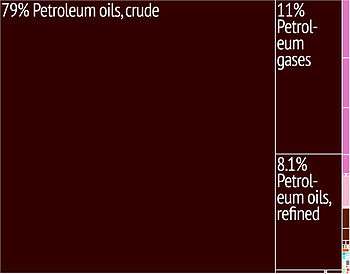
Libya is an OPEC member and holds the largest proven oil reserves in Africa (followed by Nigeria and Algeria), 41.5 Gbbl (6.60×10⁹ m3) as of January 2007, up from 39.1 Gbbl (6.22×10⁹ m3) in 2006. About 80% of Libya's proven oil reserves are located in the Sirte Basin, which is responsible for 90% of the country's oil output.[17] The state-owned National Oil Corporation (NOC) dominates Libya's oil industry, along with smaller subsidiaries, which combined account for around 50% of the country's oil output. Among NOC's subsidiaries, the largest oil producer is the Waha Oil Company (WOC), followed by the Agoco, Zueitina Oil Company (ZOC), and Sirte Oil Company (SOC). Oil resources, which account for approximately 95% of export earnings, 75% of government receipts, and over 50% of GDP. Oil revenues constitute the principal foreign exchange source. Reflecting the heritage of the command economy, three-quarters of employment is in the public sector, and private investment remains small at around 2% of GDP.[18]
---2017---US-EIA---Jo-Di-graphics.jpg)
Falling world oil prices in the early 1980s and economic sanctions caused a serious decline in economic activity, eventually leading to a slow private sector rehabilitation. At 2.6% per year on average, real GDP growth was modest and volatile during the 1990s. Libya's GDP grew in 2001 due to high oil prices, the end of a long cyclical drought, and increased foreign direct investment following the suspension of UN sanctions in 1999. Real GDP growth has been boosted by high oil revenues, reaching 4.6% in 2004 and 3.5% in 2005. Despite efforts to diversify the economy and encourage private sector participation, extensive controls of prices, credit, trade, and foreign exchange constrain growth.
Although UN sanctions were suspended in 1999, foreign investment in the Libyan gas and oil sectors were severely curtailed due to the U.S. Iran and Libya Sanctions Act (ILSA), which capped the amount foreign companies can invest in Libya yearly at $20 million (lowered from $40 million in 2001). As of May 2006, the U.S. has removed Libya from its list of states that sponsor terrorism and has normalised ties and removed sanctions. This clears the road for U.S. oil companies to exploit Libyan oil and is expected to have a positive impact on the Libyan economy.
The NOC hopes to raise oil production from 1.80 million bpd in 2006 to 2 million bpd by 2008. FDI into the oil sector is likely, which is attractive due to its low cost of oil recovery, high oil quality, and proximity to European markets.[19] Most Libyan oil is sold on a term basis, including to the country's Oilinvest marketing network in Europe; to companies like Agip, OMV, Repsol YPF, Tupras, CEPSA, and Total; and small volumes to Asian and South African companies.[20]
| Statistic | Amount |
|---|---|
| Proven Oil Reserves (2007E) | 41.5 Gbbl (6.60×10⁹ m3) |
| Oil Production (2006E) | 1.8 million barrels per day (290×103 m3/d) (95% crude) |
| Oil Consumption (2006E) | 284,000 barrels per day (45,200 m3/d) |
| Net Oil Exports (2006E) | 1.5 million barrels per day (240×103 m3/d) |
| Crude Oil Distillation Capacity (2006E) | 378 kbbl/d (60.1×10³ m3/d) |
| Proven Natural Gas Reserves (2007E) | 52.7×10¹² cu ft (1.49×10¹² m3) |
| Natural Gas Production (2006E) | 3,999×109 cu ft (1.132×10¹¹ m3) |
| Natural Gas consumption (2005E) | 206×109 cu ft (5.8×10⁹ m3) |
Notes:
1. Energy Information Administration (2007)
Field Development and Exploration
In November 2005, Repsol YPF discovered a significant oil deposit of light, sweet crude in the Murzuq Basin. Industry experts believe the discovery to be one of the biggest made in Libya for several years. Repsol YPF is joined by a consortium of partners including OMV, Total and Norsk Hydro. Also located in Murzuq Basin is Eni's Elephant field. In October 1997, a consortium led by British company Lasmo, along with Eni and a group of five South Korean companies, announced that it had discovered large recoverable crude reserves about 800 kilometres (500 mi) south of Tripoli.[21] Lasmo estimated field production would cost around $1 per barrel. Elephant began production in February 2004.
WOC's Waha fields currently produce around 350,000 bbl/d (56,000 m3/d). In 2005, ConocoPhillips and co-venturers reached an agreement with NOC to return to its operations in Libya and extend the Waha concession 25 years. ConocoPhillips operates the Waha fields with a 16.33% share in the project. NOC has the largest share of the Waha concession, and additional partners include Marathon and Amerada Hess.[22]
Refining and Downstream
Libya has five domestic refineries:
| Refinery | Capacity | Operator |
|---|---|---|
| Zawia Refinery | 120,000 | ZOC |
| Ras Lanuf Refinery | 220,000 | Ras Lanuf |
| El-Brega Refinery | 10,000 | SOC |
| Tobruk Refinery | 20,000 | Agoco |
| Sarir Refinery | 10,000 | Agoco |
Notes:
1. Amounts in barrels per day.
Diversification
In 2007, mining and hydrocarbon industries accounted for well over 95 percent of the Libyan economy. Diversification of the economy into manufacturing industries remain a long-term issue.
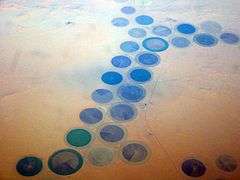
Although agriculture is the second-largest sector in the economy, Libya depends on imports in most foods. Climatic conditions and poor soils severely limit farm output, and domestic food production meets only about 25% of demand. Domestic conditions limit output, while higher incomes and a growing population have caused food consumption to rise. Because of low rainfall levels in Libya, agricultural projects such as the Kufra oasis rely on underground water sources. Libya's primary agricultural water source remains the Great Manmade River (GMMR), but significant resources are being invested in desalinization research to meet growing demand. Libyan agricultural projects and policies are overseen by a General Inspector; there is no Ministry of Agriculture, per se.[23]
Tourism
Labor market
Libya posted a 3.3% rate of population growth during 1960–2003. In 2003, 86% of the population was urban, compared to 45% in 1970. Although no reliable estimates are available, unemployment is reportedly acute: over 50% of the population under the age of 20. Moreover, despite the bias of labor market regulations favoring Libyan workers, the mismatch of the educational system with market demand has produced a large pool of expatriate workers, with typically better-suited education and higher productivity. However, because of shortages for manual labor, Libya has also attracted important numbers of less skilled immigrants. Expatriate workers represent an estimated fifth of the labor force.[24]
Although significant, the proportion of expatriate workers is still below oil producing countries in the Persian Gulf. Foreign workers mainly come from the Maghreb, Egypt, Turkey, India, the Philippines, Malaysia, Thailand, Vietnam, Poland, Chad, Sudan, and Bosnia and Herzegovina.[25][26] They tend to earn relatively high wages, taking either skilled or hard manual jobs. Census data for 2000 show the share of expatriates earning over LD 300 (US$230) per month was 20%, compared to 12% for Libyan nationals. A campaign encouraging conversion of qualified civil servants to entrepreneurs, in the face of public sector over employment and declining productivity, does not seem to be producing the desired results thus far.[18]
External trade and finance

The Government is in the process of preparing a financial sector reform program. Recent legislation setting corporate governance standards for financial institutions makes progress towards better management and greater operational independence of public banks. However, Libyan public banks still lack management structures supported by skills in critical areas like credit, investment, risk management, and information and control systems.
The new banking law reinforces the independence of the Central Bank of Libya (CBL) and offers a legal framework for regulating banking activities, even if some provisions call for improvement. Despite progress brought by the new banking Law that specifies and limits its duties and responsibilities, the CBL remains the owner of the public banks, with the associated potential conflict of interest between ownership and regulation.
Financial sector reform has also progressed with partial interest rate liberalization. Interest rates have been liberalized on deposits, while a lending rate ceiling has been set above the discount rate. The Libyan Stock Exchange, established in 2007, is the first exchange of its kind in the country.
In 2011, Libya Oil Holdings had its €38m stake in Irish exploration firm Circle Oil frozen on foot of a European Union order that's been put in place to put pressure on the Gaddafi regime.[27]
Statistics
Household income or consumption by percentage share:
lowest 11%:
NA%
highest 10%:
NA%
Industrial production growth rate: 2.7% (2009)
Electricity - production: 24 billion kWh (2007 est)
Electricity - production by source:
fossil fuel:
100%
hydro:
0%
nuclear:
0%
other:
0% (1998)
Electricity - consumption: 22.17 billion kWh (2007 est)
Electricity - exports: 104 million kWh (2007)
Electricity - imports: 77 million kWh (2007)
Agriculture - products: wheat, barley, olives, dates, citrus, vegetables, peanuts, soybeans, cattle, corn
International rankings
| Organisation | Survey | Ranking |
|---|---|---|
| The Economist | The World in 2005 - Worldwide quality-of-life index, 2005 | 70 out of 111 |
| Energy Information Administration | Greatest Oil Reserves by Country, 2006 | 9 out of 20 |
| Reporters Without Borders | Press Freedom Index (2007) | 155 out of 169 |
| Transparency International | Corruption Perceptions Index 2007 | 131 out of 180 |
| United Nations Development Programme | Human Development Index 2005 | 58 out of 177 |
Notes
- "World Economic Outlook Database, April 2019". IMF.org. International Monetary Fund. Retrieved 29 September 2019.
- "World Bank Country and Lending Groups". datahelpdesk.worldbank.org. World Bank. Retrieved 29 September 2019.
- "Population, total - Libya". data.worldbank.org. World Bank. Retrieved 15 November 2019.
- "World Economic Outlook Database, October 2019". IMF.org. International Monetary Fund. Retrieved 15 November 2019.
- "Middle East and North Africa Economic Update, October 2019 : Reaching New Heights - Promoting Fair Competition in the Middle East and North Africa p. 5" (PDF). openknowledge.worldbank.org. World Bank. Retrieved 13 October 2019.
- "The World Factbook- Libya". Central Intelligence Agency. Retrieved 5 May 2018.
- "The World Factbook". CIA.gov. Central Intelligence Agency. Retrieved 10 February 2019.
- "Human Development Indices and Indicators: 2018 Statistical update". hdr.undp.org. United Nations Development Programme. Retrieved 15 November 2019.
- "Labor force, total - Libya". data.worldbank.org. World Bank. Retrieved 27 November 2019.
- "Employment to population ratio, 15+, total (%) (national estimate) - Libya". data.worldbank.org. World Bank. Retrieved 27 November 2019.
- "Ease of Doing Business in Libya". Doingbusiness.org. Retrieved 29 November 2017.
- http://www.oecd.org/dac/stats/documentupload/LBY.JPG OECD Statistics
- "Libya". Organization of the Petroleum Exporting Countries. Retrieved 5 May 2018.
- USD 12,062 as of 2010 (IMF estimate); rank 48 worldwide, followed by Equatorial Guinea with USD 11,081 on rank 51.
- "GDP per capita, PPP (constant 2011 international $) | Data". data.worldbank.org. Retrieved 3 September 2018.
- "Report for Selected Countries and Subjects". www.imf.org. Retrieved 6 October 2018.
- Oil and Gas Journal, 2007
- World Bank 2006
- International Crude Oil Market Handbook
- EIA 2007
- "OMV's 1st Oil Find in Libya since Revolution". libya-businessnews.com/. Libya Business News. 22 October 2013. Retrieved 4 September 2015.
- EIA 2007 p.3
- Doing Business in LIBYA: A Country Commercial Guide for U.S. Companies, March, 2006
- Although, in the absence of a labor force survey, estimates are surrounded by considerable uncertainty
- http://www.seenews.com/news/latestnews/bosnia_senergoinvestsees2007profitunchanging_signscontractsinlibya_-151444/ Archived 27 February 2008 at the Wayback Machine Bosnia's Energoinvest Sees 2007 Profit Flat, Signs Contracts in Libya, Algeria
- http://www.arabianbusiness.com/506991-bosnian-firm-clinches-52mn-libya-deal?ln=en Bosnian firm clinches $52mn Libya deal
- Libya Stake in Circle Oil Frozen
References
- Energy Information Administration (2007) Libya: Country Analysis Brief
- World Bank (2006), Libya: Economic Report, Social & Economic Development Group
- P. Mobbs (2002) Mineral Industry of Libya
- T. Ahlbrandt (2001) Sirte Basin Province: Sirte-Zelten Total Petroleum System USGS
- Central Bank Of Libya Economic Bulletin Socialist People's Libyan Arab Jamahiriya
- National Authority for Information and Statistics, Socialist People's Libyan Arab Jamahiriya.
- Pilat D., Innovation and Productivity in Services - State of the Art, Organisation for Economic Co-operation and Development, Directorate for Science, Technology, and Industry, Paris. 2000
- GSPLA. Agriculture achievements in 20 years. Secretariat of Agriculture Land Reclamation and Animal Wealth. 1989
- GSPLA. Agriculture in Libya. Facts and Figure 1970.
- Mohamed Al Genedal. Agriculture in Libya. Arab Book Publishers 1978.
- Ali Rahuma. Cost of barley and wheat production in some state managed agricultural projects. J. Agric. Res. 1989
- Future of food economics in the Arab State. Vol. 4. Statistics. 1979.
- Statistical index 1970. Ministry of Economic and Planning.
See also
- Central Bank of Libya
- List of companies of Libya
- List of banks in Libya
- United Nations Economic Commission for: Africa & Western Asia
External links
| Wikimedia Commons has media related to Economy of Libya. |
