Demographics of Auckland
Auckland is New Zealand's most populous city. In the 2013 census, 1,415,550 persons declared themselves as residents of the Auckland region — an increase of 110,000 people or 8% since the 2006 census. Auckland accounts for about one-third (33.4%) of New Zealand's total population.[1][2] Auckland is known for having a large multicultural mix, with the largest Polynesian population in the world.
While having strong natural population growth, Auckland also has significant external (from overseas) immigration partially offset by internal (within New Zealand) emigration.[3] During the last decade up to 2011, approximately 50 people per day moved to Auckland, requiring an average of 21 new homes, and occupying in excess of one extra hectare of land a day.[4]
Ethnicity
Tāmaki Māori, the group of Māori iwi that are indigenous to Auckland, include Ngāti Pāoa, Ngāi Tai, Te Wai-o-Hua, Ngāti Te Ata and Te Kawerau-a-Maki, and the Ngāti Whatua hapu (sub-tribe) of Ngāti Whātua-o-Ōrākei. Auckland also has a large urban Māori population.[5]
The proportion of Asians and other non-European immigrants has increased during the last decades due to immigration,[6] and the removal of restrictions directly or indirectly based on ethnicity. Immigration to New Zealand is heavily concentrated towards Auckland (partly for job market reasons). This strong focus on Auckland has led the immigration services to award extra points towards immigration visa requirements for people intending to move to other parts of New Zealand.[7]
The following table shows the ethnic profile of Auckland's population, as recorded in the 2001, 2006, and 2013 New Zealand censuses.[8] The substantial percentage drop of 'Europeans' in 2006 was mainly caused by the increasing numbers of people from this group choosing to define themselves as 'New Zealanders', as a result of a media campaign that encouraged people to give the response 'New Zealander' even though this was not one of the groups listed on the census form. In the 2013 census fewer Europeans identify themselves as 'New Zealander', leading to a significant increase of numbers in 'Europeans'.[9]
| Ethnicity | 2001 census | 2006 census | 2013 census | 2018 census | ||||
|---|---|---|---|---|---|---|---|---|
| Number | % | Number | % | Number | % | Number | % | |
| European | 755,967 | 68.5 | 700,158 | 56.5 | 789,306 | 59.3 | 841,386 | 53.5 |
| New Zealand European | 685,965 | 62.2 | 611,898 | 49.4 | 696,963 | 52.3 | ||
| South African | 9,183 | 0.8 | 12,888 | 1.0 | 15,741 | 1.2 | ||
| English | 13,398 | 1.2 | 16,008 | 1.3 | 13,497 | 1.0 | ||
| British | 6,468 | 0.6 | 9,603 | 0.8 | 12,087 | 0.9 | ||
| European (not further defined) | 10,197 | 0.9 | 9,162 | 0.7 | 10,668 | 0.8 | ||
| Dutch | 7,728 | 0.7 | 7,785 | 0.6 | 7,998 | 0.6 | ||
| Australian | 7,200 | 0.7 | 8,637 | 0.7 | 7,065 | 0.5 | ||
| Asian | 151,644 | 13.8 | 234,279 | 18.9 | 307,233 | 23.1 | 442,674 | 28.2 |
| Chinese | 65,952 | 6.0 | 92,889 | 7.5 | 112,290 | 8.4 | ||
| Indian | 40,326 | 3.7 | 69,315 | 5.6 | 97,875 | 7.5 | ||
| Korean | 13,272 | 1.2 | 21,354 | 1.7 | 21,981 | 1.7 | ||
| Filipino | 6,312 | 0.6 | 9,822 | 0.8 | 20,499 | 1.5 | ||
| Fijian Indian | 1,281 | 0.1 | 4,170 | 0.3 | 8,067 | 0.6 | ||
| Japanese | 4,221 | 0.4 | 5,289 | 0.4 | 6,720 | 0.5 | ||
| Pacific peoples | 154,683 | 14.0 | 177,948 | 14.4 | 194,958 | 14.6 | 243,966 | 15.5 |
| Samoan | 76,584 | 6.9 | 87,840 | 7.1 | 95,916 | 7.2 | ||
| Tongan | 32,538 | 3.0 | 40,140 | 3.2 | 46,971 | 3.5 | ||
| Cook Islands Māori | 31,077 | 2.8 | 34,374 | 2.8 | 36,549 | 2.7 | ||
| Niuean | 16,035 | 1.5 | 17,667 | 1.4 | 18,555 | 1.4 | ||
| Fijian | 4,155 | 0.4 | 5,850 | 0.5 | 8,493 | 0.6 | ||
| Māori | 127,704 | 11.6 | 137,304 | 11.1 | 142,767 | 10.7 | 181,194 | 11.5 |
| Middle Eastern/Latin American/African | 13,335 | 1.2 | 18,558 | 1.5 | 24,945 | 1.9 | 35,838 | 2.3 |
| Other | 276 | <0.1 | 100,110 | 8.1 | 15,639 | 1.1 | 16,746 | 1.1 |
| New Zealander | N/A | 99,474 | 8.0 | 14,904 | 1.1 | |||
| Total people stated | 1,102,818 | 1,239,054 | 1,331,427 | 1,517,718 | ||||
| Not elsewhere included | 57,453 | 5.0 | 65,907 | 5.1 | 84,123 | 5.9 | 0 | 0.0 |
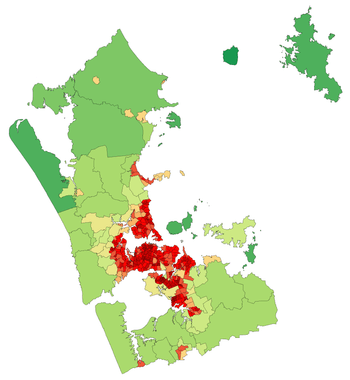
| Local board area | European | Maori | Pacific | Asian | MELAA | Other | ||||||
|---|---|---|---|---|---|---|---|---|---|---|---|---|
| Num. | % | Num. | % | Num. | % | Num. | % | Num. | % | Num. | % | |
| Rodney | 59,013 | 88.9 | 7,551 | 11.4 | 2,340 | 3.5 | 3,756 | 5.7 | 450 | 0.7 | 822 | 1.2 |
| Hibiscus and Bays | 84,057 | 80.8 | 6,735 | 6.5 | 2,205 | 2.1 | 16,626 | 16.0 | 1,551 | 1.5 | 1,206 | 1.2 |
| Upper Harbour | 34,746 | 55.3 | 3,210 | 5.1 | 1,530 | 2.4 | 24,867 | 39.6 | 1,887 | 3.0 | 897 | 1.4 |
| Kaipatiki | 51,633 | 58.5 | 7,680 | 8.7 | 5,379 | 6.1 | 29,034 | 32.9 | 2,718 | 3.1 | 1,149 | 1.3 |
| Devonport-Takapuna | 40,152 | 69.3 | 3,192 | 5.5 | 1,443 | 2.5 | 15,249 | 26.3 | 1,476 | 2.5 | 681 | 1.2 |
| Henderson-Massey | 57,633 | 48.7 | 20,319 | 17.2 | 24,771 | 20.9 | 32,523 | 27.5 | 3,087 | 2.6 | 1,416 | 1.2 |
| Waitākere Ranges | 38,823 | 74.5 | 6,621 | 12.7 | 6,093 | 11.7 | 7,275 | 14.0 | 936 | 1.8 | 642 | 1.2 |
| Great Barrier | 855 | 91.3 | 192 | 20.5 | 24 | 2.6 | 15 | 1.6 | 0 | 0.0 | 18 | 1.9 |
| Waiheke | 8,055 | 88.9 | 1,035 | 11.4 | 342 | 3.8 | 366 | 4.0 | 315 | 3.5 | 108 | 1.2 |
| Waitemata | 49,950 | 60.3 | 5,034 | 6.1 | 4,053 | 4.9 | 26,103 | 31.5 | 3,912 | 4.7 | 828 | 1.0 |
| Whau | 32,040 | 40.4 | 7,845 | 9.9 | 14,817 | 18.7 | 31,959 | 40.3 | 2,286 | 2.9 | 780 | 1.0 |
| Albert-Eden | 58,899 | 59.7 | 7,005 | 7.1 | 7,653 | 7.8 | 31,524 | 32.0 | 2,748 | 2.8 | 990 | 1.0 |
| Puketapapa | 19,356 | 33.6 | 3,462 | 6.0 | 8,775 | 15.2 | 28,266 | 49.1 | 2,163 | 3.8 | 510 | 0.9 |
| Orakei | 61,221 | 72.6 | 4,815 | 5.7 | 2,676 | 3.2 | 19,296 | 22.9 | 2,127 | 2.5 | 825 | 1.0 |
| Maungakiekie-Tamaki | 33,438 | 43.8 | 10,656 | 14.0 | 19,602 | 25.7 | 21,309 | 27.9 | 1,680 | 2.2 | 711 | 0.9 |
| Howick | 64,776 | 46.0 | 8,052 | 5.7 | 8,028 | 5.7 | 65,541 | 46.5 | 3,540 | 2.5 | 2,010 | 1.4 |
| Mangere-Otahuhu | 14,976 | 19.1 | 12,861 | 16.4 | 46,578 | 59.4 | 14,925 | 19.0 | 603 | 0.8 | 444 | 0.6 |
| Otara-Papatoetoe | 14,142 | 16.6 | 13,392 | 15.7 | 39,198 | 46.0 | 29,880 | 35.1 | 882 | 1.0 | 498 | 0.6 |
| Manurewa | 27,942 | 29.2 | 24,846 | 26.0 | 34,707 | 36.3 | 24,345 | 25.4 | 1,962 | 2.1 | 645 | 0.7 |
| Papakura | 28,305 | 49.1 | 15,438 | 26.8 | 9,750 | 16.9 | 13,497 | 23.4 | 918 | 1.6 | 588 | 1.0 |
| Franklin | 61,371 | 82.0 | 11,247 | 15.0 | 4,008 | 5.4 | 6,324 | 8.5 | 585 | 0.8 | 969 | 1.3 |
Country of birth
| Country | 2006 census | 2013 census | 2018 census | |||
|---|---|---|---|---|---|---|
| Number | % | Number | % | Number | % | |
| 777,942 | 63.0 | 805,356 | 60.9 | 904,905 | 58.4 | |
| 54,519 | 4.4 | 65,385 | 4.9 | 96,540 | 6.2 | |
| 30,747 | 2.5 | 43,410 | 3.3 | 71,358 | 4.6 | |
| 72,975 | 5.9 | 74,940 | 5.7 | 68,799 | 4.4 | |
| 28,446 | 2.3 | 39,087 | 3.0 | 44,658 | 2.9 | |
| 35,766 | 2.9 | 35,586 | 2.7 | 38,232 | 2.5 | |
| 24,630 | 2.0 | 30,612 | 2.3 | 36,759 | 2.4 | |
| 9,069 | 0.7 | 18,621 | 1.4 | 30,237 | 2.0 | |
| 20,250 | 1.6 | 19,590 | 1.5 | 21,903 | 1.4 | |
| 20,034 | 1.6 | 19,470 | 1.5 | 21,753 | 1.4 | |
| 17,208 | 1.4 | 18,117 | 1.4 | 20,913 | 1.3 | |
| 8,424 | 0.7 | 9,459 | 0.7 | 11,607 | 0.7 | |
| 5,931 | 0.4 | 7,272 | 0.5 | 8,988 | 0.6 | |
| 4,503 | 0.4 | 5,841 | 0.4 | 8,529 | 0.6 | |
| 10,374 | 0.8 | 9,183 | 0.7 | 8,259 | 0.5 | |
| 5,844 | 0.5 | 5,109 | 0.4 | 8,061 | 0.5 | |
| 8,961 | 0.7 | 7,851 | 0.6 | 7,443 | 0.5 | |
| 7,485 | 0.6 | 6,378 | 0.5 | 7,113 | 0.5 | |
| 4,158 | 0.3 | 4,959 | 0.4 | 6,279 | 0.4 | |
| 3,264 | 0.3 | 3,978 | 0.3 | 5,859 | 0.4 | |
| 3,588 | 0.3 | 4,164 | 0.3 | 5,253 | 0.3 | |
| Other countries | 80,208 | 6.5 | 88,185 | 6.7 | 115,791 | 7.5 |
| Total people stated | 1,234,317 | 1,322,535 | 1,571,718 | |||
| Not elsewhere included | 70,641 | 5.4 | 93,015 | 6.6 | 22,476 | 1.5 |
| Local board area | New Zealand | Australia | Pacific Islands | British Isles | Europe | North America | Asia | Middle East and Africa | Latin America and Other | |||||||||
|---|---|---|---|---|---|---|---|---|---|---|---|---|---|---|---|---|---|---|
| Num. | % | Num. | % | Num. | % | Num. | % | Num. | % | Num. | % | Num. | % | Num. | % | Num. | % | |
| Rodney | 39,678 | 77.8 | 936 | 1.8 | 540 | 1.1 | 5,763 | 11.3 | 1,098 | 2.2 | 549 | 1.1 | 1,272 | 2.5 | 1,092 | 2.1 | 90 | 0.2 |
| Hibiscus and Bays | 53,805 | 63.0 | 1,476 | 1.7 | 624 | 0.7 | 13,443 | 15.7 | 2,574 | 3.0 | 912 | 1.1 | 5,499 | 6.4 | 6,717 | 7.9 | 321 | 0.4 |
| Upper Harbour | 27,525 | 54.1 | 699 | 1.4 | 762 | 1.5 | 4,296 | 8.4 | 1,260 | 2.5 | 438 | 0.9 | 11,562 | 22.7 | 4,140 | 8.1 | 168 | 0.3 |
| Kaipatiki | 45,189 | 58.1 | 1,251 | 1.6 | 2,358 | 3.0 | 5,991 | 7.7 | 2,238 | 2.9 | 648 | 0.8 | 15,936 | 20.5 | 3,711 | 4.8 | 432 | 0.6 |
| Devonport-Takapuna | 32,226 | 60.5 | 1,113 | 2.1 | 522 | 1.0 | 5,919 | 11.1 | 1,728 | 3.2 | 759 | 1.4 | 8,598 | 16.1 | 2,073 | 3.9 | 315 | 0.6 |
| Henderson-Massey | 64,248 | 64.2 | 1,230 | 1.2 | 10,536 | 10.5 | 4,698 | 4.7 | 2,232 | 2.2 | 501 | 0.5 | 13,293 | 13.3 | 2,931 | 2.9 | 399 | 0.4 |
| Waitākere Ranges | 31,902 | 70.6 | 756 | 1.7 | 2,265 | 5.0 | 4,806 | 10.6 | 1,284 | 2.8 | 498 | 1.1 | 2,454 | 5.4 | 1,038 | 2.3 | 186 | 0.4 |
| Great Barrier | 663 | 81.3 | 21 | 2.6 | 3 | 0.4 | 72 | 8.8 | 21 | 2.6 | 18 | 2.2 | 9 | 1.1 | 9 | 1.1 | 0 | 0.0 |
| Waiheke | 5,442 | 70.3 | 213 | 2.8 | 69 | 0.9 | 1,107 | 14.3 | 321 | 4.1 | 195 | 2.5 | 174 | 2.2 | 147 | 1.9 | 75 | 1.0 |
| Waitemata | 37,689 | 53.1 | 1,539 | 2.2 | 1,644 | 2.3 | 5,190 | 7.3 | 2,763 | 3.9 | 1,323 | 1.9 | 17,589 | 24.8 | 2,190 | 3.1 | 1,092 | 1.5 |
| Whau | 54,834 | 54.5 | 1,584 | 1.2 | 3,153 | 11.4 | 5,379 | 4.4 | 1,899 | 1.5 | 966 | 0.5 | 18,618 | 23.5 | 2,085 | 2.9 | 465 | 0.4 |
| Albert-Eden | 54,834 | 61.6 | 1,584 | 1.8 | 3,153 | 3.5 | 5,379 | 6.0 | 1,899 | 2.1 | 966 | 1.1 | 18,618 | 20.9 | 2,085 | 2.3 | 465 | 0.5 |
| Puketapapa | 24,192 | 48.3 | 513 | 1.0 | 5,274 | 10.5 | 1,773 | 3.5 | 645 | 1.3 | 270 | 0.5 | 15,507 | 31.0 | 1,683 | 3.4 | 204 | 0.4 |
| Orakei | 49,224 | 65.4 | 1,815 | 2.4 | 1,230 | 1.6 | 6,621 | 8.8 | 2,679 | 3.6 | 1,083 | 1.4 | 9,633 | 12.8 | 2,526 | 3.4 | 513 | 0.7 |
| Maungakiekie-Tamaki | 38,955 | 60.8 | 798 | 1.2 | 8,211 | 12.8 | 2,496 | 3.9 | 1,263 | 2.0 | 429 | 0.7 | 10,164 | 15.9 | 1,449 | 2.3 | 267 | 0.4 |
| Howick | 60,189 | 49.4 | 1,398 | 1.1 | 4,815 | 4.0 | 8,730 | 7.2 | 2,184 | 1.8 | 723 | 0.6 | 32,928 | 27.0 | 10,488 | 8.6 | 399 | 0.3 |
| Mangere-Otahuhu | 36,519 | 56.8 | 588 | 0.9 | 21,858 | 34.0 | 810 | 1.3 | 237 | 0.4 | 183 | 0.3 | 3,477 | 5.4 | 501 | 0.8 | 84 | 0.1 |
| Otara-Papatoetoe | 36,642 | 53.4 | 567 | 0.8 | 20,577 | 30.0 | 870 | 1.3 | 246 | 0.4 | 165 | 0.2 | 8,598 | 12.5 | 837 | 1.2 | 93 | 0.1 |
| Manurewa | 48,492 | 64.6 | 744 | 1.0 | 13,962 | 18.6 | 2,082 | 2.8 | 429 | 0.6 | 198 | 0.3 | 6,834 | 9.1 | 2,193 | 2.9 | 93 | 0.1 |
| Papakura | 32,337 | 76.5 | 555 | 1.3 | 2,463 | 5.8 | 1,950 | 4.6 | 429 | 1.0 | 174 | 0.4 | 3,162 | 7.5 | 1,107 | 2.6 | 105 | 0.2 |
| Franklin | 48,744 | 79.3 | 981 | 1.6 | 1,083 | 1.8 | 5,502 | 9.0 | 954 | 1.6 | 378 | 0.6 | 2,085 | 3.3 | 1,623 | 2.6 | 84 | 0.1 |
Religion
Major religions in Auckland, 2013 Census
| Religion | 2001 census | 2006 census | 2013 census | |||
|---|---|---|---|---|---|---|
| Number | % | Number | % | Number | % | |
| Christian | 604,713 | 56.98 | 636,405 | 52.96 | 615,936 | 47.56 |
| Catholic | 153,678 | 14.48 | 169,881 | 14.14 | 172,110 | 13.29 |
| Anglican | 147,993 | 13.94 | 141,522 | 11.78 | 117,843 | 9.10 |
| Presbyterian, Congregational and Reformed | 110,490 | 10.41 | 109,539 | 9.12 | 95,892 | 7.40 |
| Christian (not further defined) | 63,180 | 5.95 | 63,714 | 5.30 | 78,480 | 6.06 |
| Methodist | 47,034 | 4.43 | 50,442 | 4.20 | 46,770 | 3.61 |
| Pentecostal | 23,238 | 2.19 | 31,104 | 2.59 | 31,386 | 2.42 |
| Baptist | 18,546 | 1.75 | 21,495 | 1.79 | 21,237 | 1.64 |
| Latter-day Saints | 16,632 | 1.57 | 19,230 | 1.60 | 19,374 | 1.50 |
| Other Christian religions | 32,796 | 3.09 | 37,560 | 3.13 | 39,240 | 3.03 |
| Hindu | 25,788 | 2.43 | 45,327 | 3.77 | 61,458 | 4.75 |
| Buddhist | 22,722 | 2.14 | 29,217 | 2.43 | 32,778 | 2.53 |
| Islam/Muslim | 15,318 | 1.44 | 23,688 | 1.97 | 31,158 | 2.41 |
| Sikh | 3,225 | 0.30 | 6,177 | 0.51 | 11,715 | 0.90 |
| Māori Christian | 14,481 | 1.36 | 14,574 | 1.21 | 11,649 | 0.90 |
| Ratana | 12,585 | 1.19 | 12,438 | 1.04 | 10,122 | 0.78 |
| Ringatu | 1,977 | 0.19 | 2,253 | 0.19 | 1,617 | 0.12 |
| Other Maori Christian religions | 153 | 0.01 | 141 | 0.01 | 114 | 0.01 |
| Spiritualism and New Age religions | 4,854 | 0.46 | 5,907 | 0.49 | 5,238 | 0.40 |
| Judaism/Jewish | 3,132 | 0.30 | 3,315 | 0.28 | 3,099 | 0.24 |
| Other religions | 4,767 | 0.45 | 5,541 | 0.46 | 5,637 | 0.44 |
| Total people with at least one religious affiliation | 692,691 | 65.27 | 763,191 | 63.51 | 772,095 | 59.61 |
| No religion | 308,592 | 29.08 | 390,411 | 32.49 | 489,915 | 37.83 |
| Object to answering | 68,601 | 6.46 | 67,302 | 5.60 | 48,585 | 3.75 |
Future growth

Auckland is expecting substantial population growth via immigration and natural population increases (which contribute to growth at about one-third and two-thirds, respectively),[14] and is set to grow to an estimated 2 million inhabitants by 2050 (a compounded annual growth rate of 1.2% vs the 2013 number above).[15] This substantial increase in population will have a major impact on transport, housing and other infrastructure that is in many cases already considered under pressure. It is also feared by some organisations, such as the Auckland Regional Council, that urban sprawl will result from the growth and, as a result, that it is necessary to address this proactively in planning policy.
A 'Regional Growth Strategy' has been adopted that sees limits on further subdivision and intensification of existing use as its main sustainability measures.[16] This policy is contentious, as it naturally limits the uses of private land, especially the subdivision of urban fringe properties,[17] by setting 'Metropolitan Urban Limits' in planning documents like the District Plan.[18] According to the 2006 Census projections, the medium-variant scenario shows that the population is projected to continue growing, to reach 1.93 million by 2031. The high-variant scenario shows the region's population growing to over two million by 2031.[19]
References
- http://www.aucklandcouncil.govt.nz/EN/planspoliciesprojects/reports/Pages/censusinaucklandhome.aspx
- http://www.stats.govt.nz/browse_for_stats/population/census_counts/2013CensusUsuallyResidentPopulationCounts_MR2013Census.aspx
- "New Zealand's population is drifting north - Population mythbusters". Statistics New Zealand. 22 June 2012. Retrieved 1 August 2015.
- "Auckland Council - History In The Making". Our Auckland. Auckland Council. March 2011. p. 5.
- Taonui, Rāwiri (10 February 2015). "Tāmaki tribes". Te Ara: The Encyclopedia of New Zealand. Ministry for Culture and Heritage. Retrieved 15 September 2016.
- "New Zealand — A Regional Profile — Auckland" (PDF). Statistics New Zealand. 1999. pp. 19–20. Archived from the original (PDF) on 2007-10-25. Retrieved 2007-10-03.
- Residence in New Zealand Archived 2007-06-14 at the Wayback Machine (PDF) (Page 8, from the Immigration New Zealand website. Accessed 2008-01-18.)
- 2013 Census about a place: Auckland region, Cultural Diversity
- 2013 Census QuickStats about national highlights
- "Ethnic group (detailed total response - level 3) by age and sex, for the census usually resident population count, 2006, 2013, and 2018 Censuses (RC, TA, SA2, DHB)". nzdotstat.stats.govt.nz. Retrieved 2020-03-03.
- "Birthplace (detailed), for the census usually resident population count, 2006, 2013, and 2018 Censuses (RC, TA, SA2, DHB)". nzdotstat.stats.govt.nz. Retrieved 2020-03-03.
- "2013 Census QuickStats about culture and identity – data tables". Statistics New Zealand. Archived from the original on 24 May 2014. Retrieved 10 November 2016.
- "Religious affiliation (total responses) by age group and sex, for the census usually resident population count, 2001, 2006, and 2013 Censuses (RC, TA, AU)". Statistics New Zealand. Retrieved 24 January 2018.
- Can We Stop growth? Archived 2007-10-12 at the Wayback Machine (from the ARC website)
- .Executive Summary (PDF) (from the Auckland Regional Growth Strategy document, ARC, November 1999. Retrieved 2007-10-14.)
- From Urban Sprawl to Compact City: an analysis of Auckland's Urban Growth Management Strategies Archived 2007-06-28 at the Wayback Machine — Arbury, Joshua — MA Thesis, University of Auckland, New Zealand.
- Cumming, Geoff (28 April 2007). "Green belt under siege". The New Zealand Herald. Retrieved 27 September 2011.
- Growth Strategy: Glossary and References Archived 2007-06-14 at the Wayback Machine (PDF) (from the Auckland City Council).
- "Archived copy". Archived from the original on 2014-04-13. Retrieved 2014-04-05.CS1 maint: archived copy as title (link)