DOT (graph description language)
DOT is a graph description language. DOT graphs are typically files with the filename extension gv or dot. The extension gv is preferred, to avoid confusion with the extension dot used by versions of Microsoft Word before 2007.[1]
| Filename extensions | .gv |
|---|---|
| Type of format | Graph description language |
| Open format? | Yes |
Various programs can process DOT files. Some, such as dot, neato, twopi, circo, fdp, and sfdp, can read a DOT file and render it in graphical form. Others, such as gvpr, gc, acyclic, ccomps, sccmap, and tred, read DOT files and perform calculations on the represented graph. Finally, others, such as lefty, dotty, and grappa, provide an interactive interface. The GVedit tool combines a text editor with noninteractive image viewer. Most programs are part of the Graphviz package or use it internally.
Syntax
Graph types
Undirected graphs

At its simplest, DOT can be used to describe an undirected graph. An undirected graph shows simple relations between objects, such as friendship between people. The graph keyword is used to begin a new graph, and nodes are described within curly braces. A double-hyphen (--) is used to show relations between the nodes.
 // The graph name and the semicolons are optional
 graph graphname {
     a -- b -- c;
     b -- d;
 }
Directed graphs
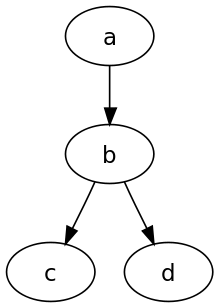
Similar to undirected graphs, DOT can describe directed graphs, such as flowcharts and dependency trees. The syntax is the same as for undirected graphs, except the digraph keyword is used to begin the graph, and an arrow (->) is used to show relationships between nodes.
 digraph graphname {
     a -> b -> c;
     b -> d;
 }
Attributes

Various attributes can be applied to graphs, nodes and edges in DOT files. [2] These attributes can control aspects such as color, shape, and line styles. For nodes and edges, one or more attribute–value pairs are placed in square brackets ([]) after a statement and before the semicolon (which is optional). Graph attributes are specified as direct attribute–value pairs under the graph element, where multiple attributes are separated by a comma or using multiple sets of square brackets, while node attributes are placed after a statement containing only the name of the node, but not the relations between the dots.
 graph graphname {
     // This attribute applies to the graph itself
     size="1,1";
     // The label attribute can be used to change the label of a node
     a [label="Foo"];
     // Here, the node shape is changed.
     b [shape=box];
     // These edges both have different line properties
     a -- b -- c [color=blue];
     b -- d [style=dotted];
     // [style=invis] hides a node.
   }
HTML-like labels are only available on versions of Graphviz that are newer than mid-November 2003, in particular, they are not considered as part of release 1.10.[3]
Comments
Dot supports C and C++ style single line and multiple line comments. In addition, it ignores lines with a number sign symbol (#) as their first character.
 // This is a single line comment.
 /* This is a
    multiple line
    comment. */
 # Lines like this are also ignored.
A simple example

dottyFollowing is an example script that describes the bonding structure of an ethane molecule. This is an undirected graph and contains node attributes as explained above.
 graph ethane {
     C_0 -- H_0 [type=s];
     C_0 -- H_1 [type=s];
     C_0 -- H_2 [type=s];
     C_0 -- C_1 [type=s];
     C_1 -- H_3 [type=s];
     C_1 -- H_4 [type=s];
     C_1 -- H_5 [type=s];
 }
Layout programs
.svg.png)
The DOT language defines a graph, but does not provide facilities for rendering the graph. There are several programs that can be used to render, view, and manipulate graphs in the DOT language:
General
- Graphviz – a collection of libraries and utilities to manipulate and render graphs
JavaScript
- Canviz – a JavaScript library for rendering DOT files[4]
- d3-graphviz – a JavaScript library based on Viz.js and D3.js that renders DOT graphs and supports animated transitions between graphs and interactive graph manipulation[5]
- Vis.js – a JavaScript library that accept DOT as input for network graphs [6].
- Viz.js – a JavaScript port of Graphviz that provides a simple wrapper for using it in the browser.
Java
- Gephi – an interactive visualization and exploration platform for all kinds of networks and complex systems, dynamic and hierarchical graphs
- Grappa – a partial port of Graphviz to Java
- graphviz-java – an open source partial port of Graphviz to Java available from github.com
- ZGRViewer – a DOT viewer[7]
Other
- Beluging – a Python- & Google Cloud Platform-based viewer of DOT and Beluga extensions
- dot2tex – a program to convert files from DOT to PGF/TikZ or PSTricks, both of which are rendered in LaTeX[8]
- OmniGraffle – a digital illustration application for macOS that can import a subset of DOT, producing an editable document (but the result cannot be exported back to DOT)
- Tulip – a software framework in C++ that can import DOT files for analysis[9]
- VizierFX – an Apache Flex graph rendering library in ActionScript[10]
Limitations

It is possible to specify layout details with DOT, although not all tools that implement the DOT language pay attention to the position attributes. Thus, depending on the tools used, users must rely on automated layout algorithms (potentially resulting in unexpected output) or tediously hand-positioned nodes.
For example:
digraph g {
	node [shape=plaintext];
	A1 -> B1;
	A2 -> B2;
	A3 -> B3;

	A1 -> A2 [label=f];
	A2 -> A3 [label=g];
	B2 -> B3 [label="g'"];
	B1 -> B3 [label="(g o f)'" tailport=s headport=s];

	{ rank=same; A1 A2 A3 }
	{ rank=same; B1 B2 B3 }
}

There are two problems in the image titled "An image that seems improperly rendered". The square on the right is not a perfect square and some labels are not next to the related arrow ((g o f)') and some overlap the arrows.
This can be fixed with Inkscape or other SVG editors. In some cases, this can also be fixed by using the pos attribute to specify a position, and the weight attribute to square the graph.
See also
- lisp2dot tool to convert Lisp programming language-like program trees to DOT language. Designed for use with genetic programming.
- Images with Dot source code at Wikimedia Commons
Notes
- "File extension .dot or .gv?". marc.info. Retrieved 2011-03-08.
- "Node, Edge and Graph Attributes". graphviz.org. Retrieved 2017-05-12.
- "Node Shapes: HTML-Like Labels". graphviz.org. Retrieved 2017-05-12.
- "canviz: graphviz on a canvas". Retrieved 2017-06-02.
- "GitHub - magjac/d3-graphviz: Graphviz DOT rendering and animated transitions using D3". github.com. Retrieved 2018-06-06.
- "Import data in DOT language". vis.js. Retrieved 2018-12-22.
- "ZGRViewer". zvtm.sourceforge.net. Retrieved 2017-05-12.
- "dot2tex – A Graphviz to LaTeX converter". dot2tex.readthedocs.io. 2019-11-01.
- "Data Visualization Software – Tulip". tulip.labri.fr. Retrieved 2017-05-12.
- "GitHub - gvhung/vizierfx: Automatically exported from code.google.com/p/vizierfx". github.com. Retrieved 2017-05-12.