Clustering illusion
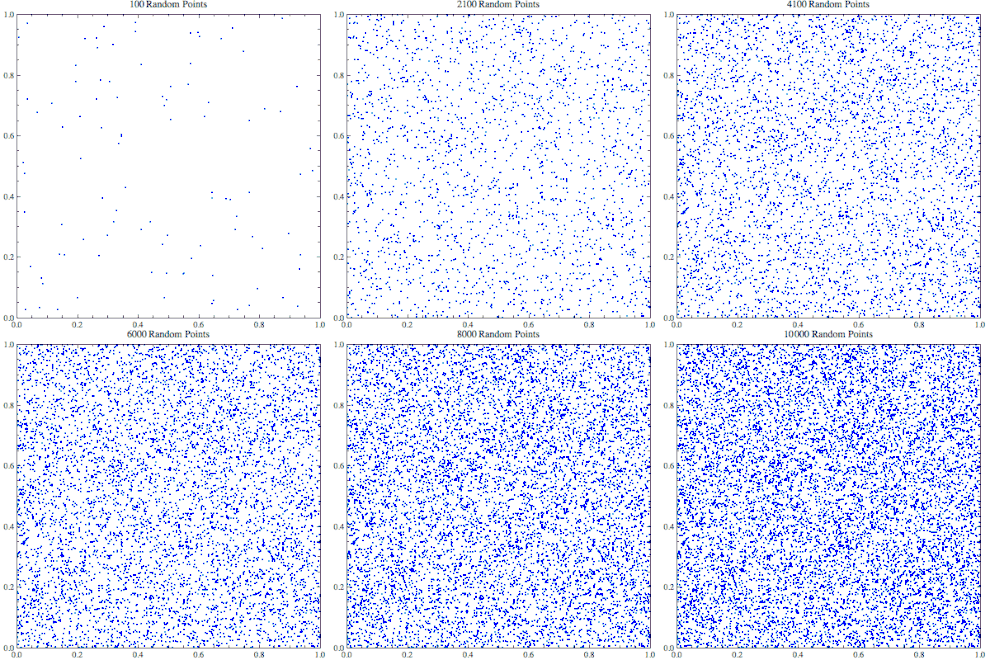
The clustering illusion is the tendency to erroneously consider the inevitable "streaks" or "clusters" arising in small samples from random distributions to be non-random. The illusion is caused by a human tendency to underpredict the amount of variability likely to appear in a small sample of random or semi-random data.[1]

Examples
Thomas Gilovich, an early author on the subject, argued that the effect occurs for different types of random dispersions, including two-dimensional data such as clusters in the locations of impact of World War II V-1 flying bombs on maps of London; or seeing patterns in stock market price fluctuations over time.[1][2] Although Londoners developed specific theories about the pattern of impacts within London, a statistical analysis by R. D. Clarke originally published in 1946 showed that the impacts of V-2 rockets on London were a close fit to a random distribution.[3][4][5][6][7]
Similar biases
Using this cognitive bias in causal reasoning may result in the Texas sharpshooter fallacy. More general forms of erroneous pattern recognition are pareidolia and apophenia. Related biases are the illusion of control which the clustering illusion could contribute to, and insensitivity to sample size in which people don't expect greater variation in smaller samples. A different cognitive bias involving misunderstanding of chance streams is the gambler's fallacy.
Possible causes
Daniel Kahneman and Amos Tversky explained this kind of misprediction as being caused by the representativeness heuristic[2] (which itself they also first proposed).
See also
References
- Gilovich, Thomas (1991). How we know what isn't so: The fallibility of human reason in everyday life. New York: The Free Press. ISBN 978-0-02-911706-4.
- Kahneman, Daniel; Amos Tversky (1972). "Subjective probability: A judgment of representativeness". Cognitive Psychology. 3 (3): 430–454. doi:10.1016/0010-0285(72)90016-3.
- Clarke, R. D. (1946). "An application of the Poisson distribution". Journal of the Institute of Actuaries. 72 (3): 481. doi:10.1017/S0020268100035435.
- Gilovich, 1991 p. 19
- Mori, Kentaro. "Seeing patterns". Retrieved 3 March 2012.
- "Bombing London". Archived from the original on 2012-02-21. Retrieved 3 March 2012.
- Tierney, John (3 October 2008). "See a pattern on Wall Street?" (October 3, 2008). TierneyLab. New York Times. Retrieved 3 March 2012.
External links
| Wikimedia Commons has media related to Clustering illusion. |