Chorochromatic map
A Chorochromatic map (from Greek χώρα [khṓra, “location”] and χρῶμα [khrôma, “color”]), also known as an area-class or qualitative area maps, is a type of thematic map that portray regions of categorical or nominal data using variations in color symbols. Chorochromatic maps are typically used to represent discrete fields, also known as categorical coverages. Chorochromatic maps differ from choropleth maps in that chorochromatic maps are mapped according to data-driven boundaries instead of trying to make the data fit within existing, sometimes arbitrary units such as political boundaries.[1]
Use of chorochromatic maps
Chorochromatic maps are used to depict a wide variety of nominal/discrete fields. Like a quantitative field, a discrete field is a property that varies over space and theoretically possesses a measurable value at any location. However, the value, in this case, is nominal or categorical, and due to the typical presence of Tobler's first law of geography, there are usually regions of homogeneous value. Because of the constant value in the data, discrete values represent features that have definite boundaries in chorochromatic maps, and the data shows the measures of a defined area. Discrete data can only take some values and these ones can be counted but not measured, which make it easy to categorize them into classifications.[2] The chorochromatic technique in cartography implies the drawing of boundaries to establish specific areas where shading or coloring techniques are applied to distinguish unique features.[3]
Examples of discrete fields that are commonly depicted using chorochromatic maps include:[2]
- Biomes
- Climate classification
- Land cover, such as vegetation, water, and human landscape
- Predominant language[4], religion, ethnicity or other cultural trait
- Soil type
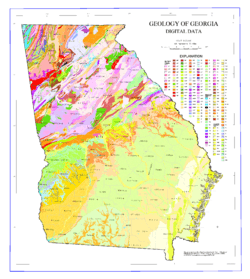
- surface geologic strata
- Land use
- city zoning
Some discrete fields are hierarchical meaning some values are more similar than others (e.g., geologic strata by age, language families), while others consist of entirely independent values. In the hierarchical case, a wise choice of map symbols such as similar colors (e.g. similar shades of red) can help to portray the hierarchy effectively.[2]
The regions depicted on a chorochromatic map are very scale-dependent, as the cartographer or data collector must determine the minimum size of regions to represent, with small regions merged into the surrounding regions. For example, on a county-scale land use map, a single farm house would not be shown amid several square miles of farmland, whereas on a land use map focused on that farmland, the house might be significant to show. On a land use map of an entire country, the farmland itself would probably not be large enough to show. As with all forms of Cartographic generalization, this can lead to uncertainty and misinterpretation if not done wisely.
Simple and compound chorochromatic maps
Chorochromatic maps can be categorized as either simple or compound.[5]
Simple chorochromatic

Simple chorochromatic maps show single features with spatially intermittent frequencies.[5] An example of this would be showing the distribution of a nation's forest reserves. The chosen variable is represented by a single color symbol or pattern without subdividing it further into subgroups.
Compound chorochromatic

Compound chorochromatic maps on the other hand show phenomena in which types and categories can be recognized.[5] Chorochromatic maps can be used to show different types of soil, rocks, vegetation, etc. One example would be a full vegetation map, in which the different kinds of vegetation are all shown on the same map, using different symbols or shading patterns.[2]
Usually, the classification resulting in the identification of the unit types shown on a compound chorochromatic map is qualitative, based on apparently discontinuous features. However, in certain cases (for example, soil and vegetation) the aggregate unit area characteristics form parts of a continuum.[2][5]
Selection of Thematic Map Type
Because most types of thematic maps are designed to portray quantitative data, one could assume that a nominal variable would dictate the creation of a chorochromatic map.[6] However, choropleth maps can be used to portray nominal data that is created by aggregating and summarizing a geographic variable within predetermined districts. The critical difference between each, then, lies in the nature of the geographical unit used in each.
As an example, a Primary Language variable in census data could be aggregated into the predominant spoken language in each county in a country, then visualized in a choropleth map. Conversely, in a chorochromatic map, the regions would be drawn based on detailed geographic data. Thus, a chorochromatic map of predominant language would have irregular boundaries based on where the language regions are located in reality.
Misinterpretation of chorochromatic maps
Chorochromatic maps, like other thematic maps, have the potential to be misinterpreted by their readers. For example, the map reader may assume that the size of a given area is proportional to the number of people in the area with a qualitative characteristic such as language or religious belief. To avoid misleading a map user, a cartographer may choose to add a diagram showing the actual numbers involved and additional explanations in the legend or map layout to help to create a clear understanding of the map.[2][7]
Another danger of chorochromatic maps is that they may suggest defined boundaries between variables where none may exist. Some variables when mapped, particularly language, can suggest to the viewer a rigidity to the borders between features that may or may not exist in reality.[8] When areas of uncertainty are present, cartographers may need to employ other techniques to suggest a degree of uncertainty between each feature.
References
- Kraak, Menno-Jan; Ormeling, Ferjan (2003). Cartography: Visualization of Geospatial Data (2nd ed.). Harlow, England: Prentice Hall. p. 129. ISBN 978-0130888907.
- "Chorochromatic map - GIS Wiki | The GIS Encyclopedia". wiki.gis.com. Retrieved 18 December 2019.

- "Maps and diagrams. By F. J. Monkhouse and H. R. Wilkinson. London (Methuen), 1952. Pp. xvi, 330; 199 Figs. 25s". Quarterly Journal of the Royal Meteorological Society. 80 (345): 488. 1954. Bibcode:1954QJRMS..80Q.488.. doi:10.1002/qj.49708034541. ISSN 1477-870X.
- Carlevaro, Tazio (1992). "Geolinguistics. Journal of the American Society of Geolinguistics". Language Problems and Language Planning. 16 (2): 194–196. doi:10.1075/lplp.16.2.10car. ISSN 0272-2690.
- Adejuwon, O. (2010-09-03). "A Note on the Comparison of Chorochromatic Surfaces". Geographical Analysis. 7 (4): 435–440. doi:10.1111/j.1538-4632.1975.tb01056.x. ISSN 0016-7363.
- Thomas, Isabelle (March 6, 2001). "Thematic cartography today: recalls and perspectives". Cybergeo: European Journal of Geography. 189: 6. S2CID 14647533.
- Kraak, Menno-Jan; Oremling, Ferjan (2010). Cartography: Visualization of Spatial Data (3rd ed.). New York City: Rutledge. p. 140. ISBN 978-1609181932.
- Luebbering, Candice R.; Kolivras, Korine N.; Prisley, Stephen P. (2013-11-01). "The lay of the language: surveying the cartographic characteristics of language maps". Cartography and Geographic Information Science. 40 (5): 383–400. doi:10.1080/15230406.2013.809892. ISSN 1523-0406.