California's 39th congressional district
California's 39th congressional district is a congressional district in the U.S. state of California. The district includes parts of Los Angeles, Orange and San Bernardino counties, and includes Fullerton, La Habra, La Habra Heights, Brea, Buena Park, Anaheim Hills, Placentia, Yorba Linda, Diamond Bar, Chino Hills, Hacienda Heights and Rowland Heights. It is currently represented by Democrat Gil Cisneros.
| California's 39th congressional district | |||
|---|---|---|---|
.tif.png) California's 39th congressional district since January 3, 2013[1] | |||
| Representative |
| ||
| Median income | $89,300[2] | ||
| Ethnicity | |||
| Cook PVI | EVEN[4] | ||
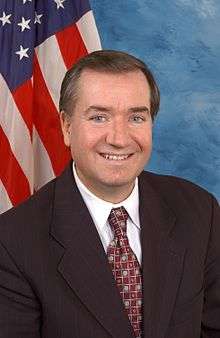
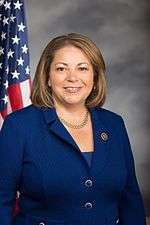
In January 2018, Republican incumbent Ed Royce announced his retirement, creating great uncertainty and interest in the 2018 district election, with concerns about multiple Democrats and Republicans running in the district's jungle primary[5][6]Assemblywoman Young Kim and Democrat Gil Cisneros won first and second place respectively, advancing to the November 6 general election.[7] After the general election, it took several days to gather and tally absentee ballots, but on November 17, Cisneros was projected the winner.[8]
Competitiveness
In statewide races
| Election results from statewide races | ||
|---|---|---|
| Year | Office | Results |
| 1990 | Governor[9] | Wilson 66.2% - 28.2% |
| 1992 | President[10] | Bush 43.8% - 34.1% |
| Senator[11] | Herschensohn 46.3% - 45.1% | |
| Senator (Special)[12] | Seymour 50.3% - 40.6% | |
| 1994 | Governor[13] | Wilson 65.5% - 30.2% |
| Senator[14] | Huffington 57.9% – 33.3% | |
| 1996 | President[15] | Dole 48.3% – 41.4% |
| 1998 | Governor[16] | Lungren 49.9% – 47.5% |
| Senator[17] | Fong 55.2% – 41.1% | |
| 2000 | President[18] | Bush 52.9% - 43.3% |
| Senator[19] | Campbell 46.8% - 46.2% | |
| 2002 | Governor[20] | Davis 54.1% - 38.0% |
| 2003 | Recall[21][22] | |
| Schwarzenegger 45.0 - 36.5% | ||
| 2004 | President[23] | Kerry 58.5% - 40.3% |
| Senator[24] | Boxer 63.7% - 31.3% | |
| 2006 | Governor[25] | Angelides 49.3% - 46.1% |
| Senator[26] | Feinstein 64.1% - 31.0% | |
| 2008 | President[27] | Obama 65.5% - 32.4% |
| 2010 | Governor[28] | Brown 60.3% - 33.6% |
| Senator[29] | Boxer 59.8% - 34.2% | |
| 2012 | President[30] | Romney 50.8% - 47.1% |
| Senator[31] | Emken 50.8% - 49.2% | |
| 2014 | Governor[32] | Kashkari 55.5% – 44.5% |
| 2016 | President[33] | Clinton 51.5% - 42.9% |
| Senator[34] | Harris 54.1% - 45.9% | |
| 2018 | Governor[35] | Cox 50.4% - 49.6% |
| Senator[36] | Feinstein 55.5% - 44.5% | |
List of members representing the district
District created January 3, 1973.


.tif.png)
Election results
|
1972 • 1974 • 1976 • 1978 • 1980 • 1982 • 1984 • 1986 • 1988 • 1990 • 1992 • 1994 • 1996 • 1998 • 2000 • 2002 • 2004 • 2006 • 2008 • 2010 • 2012 • 2014 • 2016 • 2018 |
1972
| Party | Candidate | Votes | % | |
|---|---|---|---|---|
| Republican | Andrew J. Hinshaw | 146,911 | 65.7 | |
| Democratic | John Woodland Black | 76,695 | 43.3 | |
| Total votes | 223,606 | 100.0 | ||
| Republican hold | ||||
1974
| Party | Candidate | Votes | % | |
|---|---|---|---|---|
| Republican | Charles E. Wiggins | 87,995 | 55.2 | |
| Democratic | William E. "Bill" Farris | 64,735 | 40.4 | |
| American Independent | Pat P. Scalera | 6,967 | 4.4 | |
| Total votes | 159,337 | 100.0 | ||
| Republican hold | ||||
1976
| Party | Candidate | Votes | % | |
|---|---|---|---|---|
| Republican | Charles E. Wiggins (Incumbent) | 122,657 | 58.6 | |
| Democratic | William E. "Bill" Farris | 86,745 | 41.4 | |
| Total votes | 209,402 | 100.0 | ||
| Republican hold | ||||
1978
| Party | Candidate | Votes | % | |
|---|---|---|---|---|
| Republican | William E. Dannemeyer | 112,160 | 63.7 | |
| Democratic | William E. Farris | 63,891 | 36.3 | |
| Total votes | 176,051 | 100.0 | ||
| Republican hold | ||||
1980
| Party | Candidate | Votes | % | |
|---|---|---|---|---|
| Republican | William E. Dannemeyer (Incumbent) | 175,228 | 76.3 | |
| Democratic | Leonard L. Lahtinen | 54,504 | 23.7 | |
| Total votes | 229,732 | 100.0 | ||
| Republican hold | ||||
1982
| Party | Candidate | Votes | % | |
|---|---|---|---|---|
| Republican | William E. Dannemeyer (Incumbent) | 129,539 | 72.2 | |
| Democratic | Frank G. Verges | 46,681 | 26.0 | |
| Libertarian | Frank Boeheim | 3,152 | 1.8 | |
| Total votes | 179,372 | 100.0 | ||
| Republican hold | ||||
1984
| Party | Candidate | Votes | % | |
|---|---|---|---|---|
| Republican | William E. Dannemeyer (Incumbent) | 175,788 | 76.2 | |
| Democratic | Robert E. Ward | 54,889 | 23.8 | |
| Total votes | 230,677 | 100.0 | ||
| Republican hold | ||||
1986
| Party | Candidate | Votes | % | |
|---|---|---|---|---|
| Republican | William E. Dannemeyer (Incumbent) | 131,603 | 74.4 | |
| Democratic | David D. Vest | 42,377 | 24.0 | |
| Peace and Freedom | Frank Boeheim | 2,752 | 1.6 | |
| Total votes | 176,732 | 100.0 | ||
| Republican hold | ||||
1988
| Party | Candidate | Votes | % | |
|---|---|---|---|---|
| Republican | William E. Dannemeyer (Incumbent) | 169,360 | 74.0 | |
| Democratic | Don E. Marquis | 52,162 | 22.7 | |
| Libertarian | Lee Connelly | 7,470 | 3.3 | |
| Independent | Write-ins | 367 | 0.0 | |
| Total votes | 229,359 | 100.0 | ||
| Republican hold | ||||
1990
| Party | Candidate | Votes | % | |
|---|---|---|---|---|
| Republican | William E. Dannemeyer (Incumbent) | 113,849 | 65.3 | |
| Democratic | Francis X. "Frank" Hoffman | 53,670 | 30.8 | |
| Peace and Freedom | Maxine Bell Quirk | 6,709 | 3.9 | |
| Total votes | 174,228 | 100.0 | ||
| Republican hold | ||||
1992
| Party | Candidate | Votes | % | |
|---|---|---|---|---|
| Republican | Ed Royce | 122,472 | 57.2 | |
| Democratic | Molly McClanahan | 81,728 | 38.5 | |
| Libertarian | Jack Dean | 9,484 | 4.3 | |
| Total votes | 213,684 | 100.0 | ||
| Republican hold | ||||
1994
| Party | Candidate | Votes | % | |
|---|---|---|---|---|
| Republican | Ed Royce (Incumbent) | 113,641 | 66.4 | |
| Democratic | R. O. "Bob" Davis | 49,696 | 29.0 | |
| Libertarian | Jack Dean | 7,907 | 4.6 | |
| Total votes | 171,244 | 100.0 | ||
| Republican hold | ||||
1996
| Party | Candidate | Votes | % | |
|---|---|---|---|---|
| Republican | Ed Royce (Incumbent) | 120,761 | 62.9 | |
| Democratic | Robert Davis | 61,392 | 31.9 | |
| Libertarian | Jack Dean | 10,137 | 5.2 | |
| Total votes | 192,290 | 100.0 | ||
| Republican hold | ||||
1998
| Party | Candidate | Votes | % | |
|---|---|---|---|---|
| Republican | Ed Royce (Incumbent) | 97,366 | 62.6 | |
| Democratic | A. "Cecy" R. Groom | 52,815 | 34.0 | |
| Libertarian | Jack Dean | 3,347 | 2.2 | |
| Natural Law | Ron Jevning | 1,937 | 1.2 | |
| Total votes | 155,465 | 100.0 | ||
| Republican hold | ||||
2000
| Party | Candidate | Votes | % | |
|---|---|---|---|---|
| Republican | Ed Royce (Incumbent) | 129,294 | 62.8 | |
| Democratic | Gill G. Kanel | 64,938 | 31.5 | |
| Natural Law | Ron Jevning | 6,597 | 3.2 | |
| Libertarian | Keith D. Gann | 5,275 | 2.5 | |
| Total votes | 206,104 | 100.0 | ||
| Republican hold | ||||
2002
| Party | Candidate | Votes | % | |||
|---|---|---|---|---|---|---|
| Democratic | Linda Sánchez | 52,256 | 54.9 | |||
| Republican | Tim Escobar | 38,925 | 40.8 | |||
| Libertarian | Richard G. Newhouse | 4,165 | 4.3 | |||
| Total votes | 95,346 | 100.0 | ||||
| Democratic gain from Republican | ||||||
2004
| Party | Candidate | Votes | % | |
|---|---|---|---|---|
| Democratic | Linda Sánchez (Incumbent) | 100,132 | 60.7 | |
| Republican | Tim Escobar | 64,832 | 39.3 | |
| Total votes | 164,964 | 100.0 | ||
| Democratic hold | ||||
2006
| Party | Candidate | Votes | % | |
|---|---|---|---|---|
| Democratic | Linda Sánchez (Incumbent) | 72,149 | 65.9 | |
| Republican | James L. Andion | 37,384 | 34.1 | |
| Total votes | 109,533 | 100.0 | ||
| Democratic hold | ||||
2008
| Party | Candidate | Votes | % | |
|---|---|---|---|---|
| Democratic | Linda Sánchez (Incumbent) | 125,289 | 69.7 | |
| Republican | Diane A. Lenning | 54,533 | 30.3 | |
| Total votes | 179,822 | 100.0 | ||
| Democratic hold | ||||
2010
| Party | Candidate | Votes | % | |
|---|---|---|---|---|
| Democratic | Linda Sánchez (Incumbent) | 81,590 | 63.3 | |
| Republican | Larry S. Andre | 42,037 | 32.6 | |
| American Independent | John A. Smith | 5,334 | 4.1 | |
| Total votes | 128,961 | 100.0 | ||
| Democratic hold | ||||
2012
| Party | Candidate | Votes | % | |
|---|---|---|---|---|
| Republican | Ed Royce (Incumbent) | 145,607 | 57.8 | |
| Democratic | Jay Chen | 106,360 | 42.2 | |
| Total votes | 251,967 | 100.0 | ||
| Republican hold | ||||
2014
| Party | Candidate | Votes | % | |
|---|---|---|---|---|
| Republican | Ed Royce (Incumbent) | 91,319 | 68.5 | |
| Democratic | Peter O. Anderson | 41,906 | 31.5 | |
| Total votes | 133,225 | 100.0 | ||
| Republican hold | ||||
2016
| Party | Candidate | Votes | % | |
|---|---|---|---|---|
| Republican | Ed Royce (Incumbent) | 150,777 | 57.2 | |
| Democratic | Brett Murdock | 112,679 | 42.8 | |
| Total votes | 263,456 | 100.0 | ||
| Republican hold | ||||
2018
In January 2018, Republican incumbent Ed Royce announced his retirement.[5] Royce's retirement created great uncertainty and interest in this election, due to the possibility of two candidates of the same political party winning California's jungle primary.[6][60]
The primary election resulted in two candidates of different parties, with Republican Assemblywoman Young Kim and Democrat Gil Cisneros coming in first and second place respectively.[7] After the general election, it took several days to gather and tally absentee ballots, but on November 17, Cisneros was the projected winner of the election.[8]
| Party | Candidate | Votes | % | |
|---|---|---|---|---|
| Democratic | Gil Cisneros | 126,002 | 51.6 | |
| Republican | Young Kim | 118,391 | 48.4 | |
| Total votes | 244,393 | 100.0 | ||
| Democratic gain from Republican | ||||
Historical district boundaries
The 39th Congressional District was originally one of five reapportioned to California after the 1970 U.S. Census.
From 1993 to 2003, the 39th Congressional District was a Republican stronghold. In 2003, this territory was mostly redesignated into the neighboring 40th Congressional District and 42nd Congressional District. From 2003 to 2013, the 39th district was represented by Linda Sánchez, who now represents the 38th Congressional District.
References
- US Census
- US Census
- LA Times
- "Partisan Voting Index – Districts of the 115th Congress" (PDF). The Cook Political Report. April 7, 2017. Retrieved April 7, 2017.
- Bowman, Bridget (January 8, 2018). "House Foreign Affairs Chairman Ed Royce Announces Retirement". Roll Call. Washington, DC. Retrieved January 8, 2018.
- Schneider, Elena (June 3, 2018). "This is the weirdest race in the country". Politico. Retrieved July 1, 2018.
- Martin, Jonathan; Arango, Tim (June 6, 2018). "Democrats Find Relief in California House Race Results". The New York Times.
- "Democrat Cisneros nabs GOP House seat in Southern California". AP NEWS. November 18, 2018. Retrieved November 18, 2018.
- Statement of Vote (1990 Governor)
- Statement of Vote (1992 President)
- Statement of Vote (1992 Senate)
- Statement of Vote (1992 Senate)
- Statement of Vote (1994 Governor)
- Statement of Vote (1994 Senate)
- Statement of Vote (1996 President)
- Statement of Vote (1998 Governor) Archived September 29, 2011, at the Wayback Machine
- Statement of Vote (1998 Senate) Archived September 29, 2011, at the Wayback Machine
- Statement of Vote (2000 President)
- Statement of Vote (2000 Senator)
- Statement of Vote (2002 Governor)
- Statement of Vote (2003 Recall Question)
- Statement of Vote (2003 Governor)
- Statement of Vote (2004 President)
- Statement of Vote (2004 Senator)
- Statement of Vote (2006 Governor)
- Statement of Vote (2006 Senator)
- Statement of Vote (2008 President)
- Statement of Vote (2010 Governor)
- Statement of Vote (2010 Senator)
- Statement of Vote (2012 President)
- Statement of Vote (2012 Senator)
- Statement of Vote (2014 Governor)
- Statement of Vote (2016 President)
- Statement of Vote (2016 President)
- Statement of Vote (2018 Governor)
- Statement of Vote (2018 Senator)
- 1972 election results
- 1974 election results
- 1976 election results
- 1978 election results
- 1980 election results
- 1982 election results
- 1984 election results
- 1986 election results
- 1988 election results
- 1990 election results
- 1992 election results
- 1994 election results
- 1996 election results
- 1998 election results
- 2000 election results
- 2002 election results
- 2004 election results
- 2006 election results
- 2008 election results
- 2010 election results
- 2012 election results
- 2014 election results
- 2016 election results
- Blood, Michael R. (May 5, 2018). "California's Orange County could determine Congress control". Sacramento Bee. Archived from the original on May 18, 2018. Retrieved November 18, 2018.
- 2018 election results