Batting average (cricket)
In cricket, a player's batting average is the total number of runs they have scored divided by the number of times they have been out, usually given to two decimal places. Since the number of runs a player scores and how often they get out are primarily measures of their own playing ability, and largely independent of their teammates, batting average is a good metric for an individual player's skill as a batter (although the practice of drawing comparisons between players on this basis is not without criticism[1]). The number is also simple to interpret intuitively. If all the batter's innings were completed (i.e. they were out every innings), this is the average number of runs they score per innings. If they did not complete all their innings (i.e. some innings they finished not out), this number is an estimate of the unknown average number of runs they score per innings.

Each player normally has several batting averages, with a different figure calculated for each type of match they play (First Class, one-day, Test Matches, List A, T20, etc.), and a player's batting averages may be calculated for individual seasons or series, or at particular grounds, or against particular opponents, or across their whole career.
Batting average has been used to gauge cricket players' relative skills since the 18th century.
Values
Most players have career batting averages in the range of 20 to 40. This is also the desirable range for wicket-keepers, though some fall short and make up for it with keeping skill. Until a substantial increase in scores in the 21st century due to improved bats and smaller grounds among other factors, players who sustained an average above 50 through a career were considered exceptional, and before the development of the heavy roller in the 1870s (which allowed for a flatter, safer cricket pitch) an average of 25 was considered very good.[2]
- All-rounders who are more prominent bowlers than batsmen typically average something between 20 and 30.
- 15 and under is typical for specialist bowlers.
- A small number of players have averaged less than 5 for a complete career, though a player with such an average is a liability unless an exceptional bowler as Alf Valentine, B. S. Chandrasekhar or Glenn McGrath were.
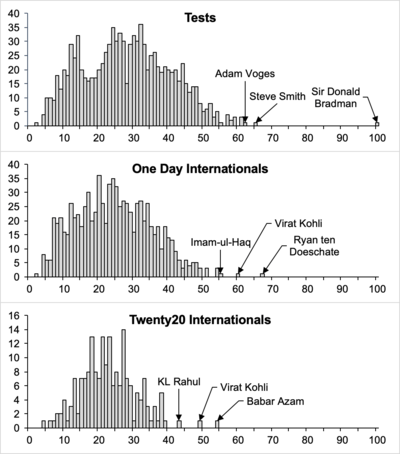
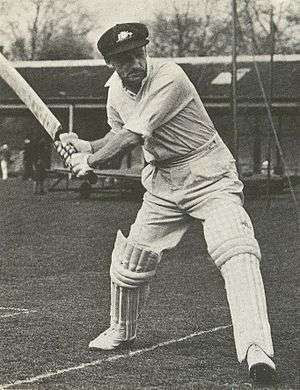
Career records for batting average are usually subject to a minimum qualification of 20 innings played or completed, in order to exclude batsmen who have not played enough games for their skill to be reliably assessed. Under this qualification, the highest Test batting average belongs to Australia's Sir Donald Bradman, with 99.94. Given that a career batting average over 50 is exceptional, and that only five other players have averages over 60, this is an outstanding statistic. The fact that Bradman's average is so far above that of any other cricketer has led several statisticians to argue that, statistically at least, he was the greatest athlete in any sport.[3]
Disregarding this 20 innings qualification, the highest career test batting average is 112, by Andy Ganteaume, a Trinidadian Keeper-batsman, who was dismissed for 112 in his only test innings.[4]
Batting averages in One Day International (ODI) and T20 International (T20I) cricket tend to be lower than in Test cricket because of the need to score runs more quickly. Consequently, batters tend to play riskier strokes and less emphasis is placed on building an innings in order to amass a high individual score. It should also be remembered, especially in relation to the ODI and T20I histograms above, that there were no ODI or T20I matches when Bradman played.
Interpretation
If a batter has been dismissed in every single innings, then this statistic gives exactly the average number of runs they score per innings.
However, for a batter with innings which finished not out, the true mean or average number of runs they score per innings is unknown as it is not known how many runs they would have scored if they could have completed all their not out innings. This statistic is an estimate of the average number of runs they score per innings. If their scores have a geometric distribution, then this statistic is the maximum likelihood estimate of their true unknown average.[5]
Batting averages can be strongly affected by the number of not outs. For example, Phil Tufnell, who was noted for his poor batting,[6] has an apparently respectable ODI average of 15 (from 20 games), despite a highest score of only 5 not out, as he scored an overall total of 15 runs from 10 innings, but was out only once.[7]
A batter who has not been dismissed in any of the innings over which their average is being calculated does not have a batting average, as dividing by zero does not give a result.
Leading male batting averages
Test matches
Highest male career batting averages in Test matches as follows:
| Rank | Batter | Tests | Innings | N.O. | Runs | Highest | Ave | Test Career dates |
|---|---|---|---|---|---|---|---|---|
| 1 | 52 | 80 | 10 | 6,996 | 334 | 99.94 | 1928–48 | |
| 2 | 14 | 23 | 0 | 1,459 | 215 | 63.43 | 2018–present | |
| 3 | 73 | 131 | 16 | 7,227 | 239 | 62.84 | 2010–present | |
| 4 | 20 | 31 | 7 | 1,485 | 269* | 61.87 | 2015–16 | |
| 5 | 23 | 41 | 4 | 2,256 | 274 | 60.97 | 1963–70 | |
| 6 | 22 | 40 | 4 | 2,190 | 270* | 60.83 | 1930–54 | |
| 7 | 54 | 84 | 9 | 4,555 | 194 | 60.73 | 1924–35 | |
| 8 | 20 | 31 | 5 | 1,540 | 243 | 59.23 | 1931–39 | |
| 9 | 82 | 131 | 15 | 6,806 | 256 | 58.67 | 1955–68 | |
| 10 | 48 | 81 | 5 | 4,455 | 207 | 58.61 | 1948–58 |
Source: Cricinfo. Table shows players with at least 20 innings completed. * denotes not out. Last updated: 8 January 2020.
First Class
Highest career batting averages in First-class cricket as follows:
| Rank | Batter | Matches | Innings | N.O. | Runs | Highest | Ave | First Class Career dates |
|---|---|---|---|---|---|---|---|---|
| 1 | 234 | 338 | 43 | 28,067 | 452* | 95.14 | 1927–49 | |
| 2 | 150 | 234 | 46 | 13,470 | 359* | 71.64 | 1929–51 | |
| 3 | 103 | 164 | 22 | 9,921 | 344* | 69.86 | 1927–54 | |
| 4 | 129 | 166 | 16 | 10,120 | 259* | 67.46 | 1984–2001 | |
| 5 | 162 | 235 | 23 | 13,819 | 437 | 65.18 | 1920–34 | |
| 6 | 174 | 245 | 39 | 13,388 | 284 | 64.99 | 1921–34 | |
| 7 | 27 | 50 | 6 | 2,817 | 217 | 64.02 | 2016–present | |
| 8 | 85 | 122 | 18 | 6,563 | 299* | 63.10 | 1987–2002 | |
| 9 | 60 | 89 | 12 | 4,716 | 250 | 61.24 | 1938–50 | |
| 10 | 76 | 120 | 15 | 6,282 | 302* | 59.82 | 2010–present |
Source: Cricinfo. Table shows players with at least 50 innings batted, note this table has no requirement for minimum number of runs scored. * denotes not out. Last updated: 30 November 2019.
One Day Internationals
Highest career batting averages in One Day International cricket as follows:
| Rank | Batter | ODIs | Innings | N.O. | Runs | Highest | Ave | ODI Career dates |
|---|---|---|---|---|---|---|---|---|
| 1 | 33 | 32 | 9 | 1,541 | 119 | 67.00 | 2006–11 | |
| 2 | 248 | 239 | 39 | 11,867 | 183 | 59.33 | 2008–present | |
| 3 | 74 | 72 | 10 | 3,359 | 125* | 54.17 | 2015–present | |
| 4 | 37 | 37 | 5 | 1,723 | 151 | 53.84 | 2017–present | |
| 5 | 232 | 196 | 67 | 6,912 | 108* | 53.58 | 1994–2004 | |
| 6 | 228 | 218 | 39 | 9,577 | 176 | 53.50 | 2005–18 | |
| 7 | 76 | 71 | 10 | 3,166 | 170 | 51.90 | 2016–present | |
| 8 | 68 | 65 | 10 | 2,819 | 137 | 51.25 | 2009–13 | |
| 9 | 146 | 137 | 21 | 5,922 | 133* | 51.05 | 2013–present | |
| 10 | 350 | 297 | 84 | 10,773 | 183* | 50.57 | 2004–present |
Source: Cricinfo. Table shows players with at least 20 innings completed. * denotes not out. Last updated: 22 February 2020.
T20 Internationals
| Rank | Batter | T20Is | Innings | N.O. | Runs | Highest | Ave | T20I Career dates |
|---|---|---|---|---|---|---|---|---|
| 1 | 82 | 76 | 21 | 2,794 | 94* | 50.80 | 2010–present | |
| 2 | 38 | 38 | 9 | 1,471 | 97* | 50.72 | 2016–present | |
| 3 | 38 | 32 | 17 | 707 | 79* | 47.13 | 2015–present | |
| 4 | 42 | 38 | 6 | 1,461 | 111* | 45.65 | 2015–present | |
| 5 | 22 | 22 | 10 | 533 | 59 | 44.41 | 2008–19 | |
| 6 | 81 | 75 | 25 | 1,934 | 96* | 38.68 | 2007–19 | |
| 7 | 59 | 59 | 9 | 1,920 | 172 | 38.40 | 2011–present | |
| 8 | 38 | 30 | 11 | 721 | 60* | 37.94 | 2005–12 | |
| 9 | 37 | 36 | 5 | 1,176 | 79 | 37.93 | 2005–13 | |
| 10 | 98 | 85 | 42 | 1,617 | 56 | 37.60 | 2006–present |
Source: Cricinfo. Table shows players with at least 20 innings completed. * denotes not out. Last updated: 22 February 2020.
Alternatives
Alternative measures of batting effectiveness have been developed, including:
Strike rate
Strike rate measures a different concept to batting average – how quickly the batsman scores (i.e. average number of runs from 100 balls) – so it does not supplant the role of batting average. It is used particularly in limited overs matches, where the speed at which a batter scores is more important than it is in first-class cricket.
Player rankings
A system of player rankings was developed to produce a better indication of players' current standings than is provided by comparing their averages.
References
- Date, Kartikeya (29 May 2014). "The calculus of the batting average". ESPN Cricinfo. Retrieved 10 March 2020.
- Rae, Simon (1998). W.G. Grace: A Life. London: Faber and Faber. p. 26. ISBN 0571178553.
- "Sir Donald Bradman". Players and Officials. Cricinfo.com. Retrieved 27 April 2006.
- "Andy Ganteaume | West Indies Cricket | Cricket Players and Officials | ESPNcricinfo". statsguru. Cricinfo.com. Retrieved 25 July 2018.
- Das, S. (2011). "On Generalized Geometric Distributions: Application to Modeling Scores in Cricket and Improved Estimation of Batting Average in Light of Notout Innings". Social Science Research Network. SSRN 2117199.
- "The Jack of all rabbits".
- "Phil Tufnell". Cricinfo.