2018 Salvadoran legislative election
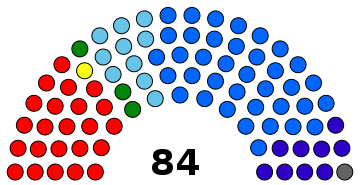
Legislative elections were held in El Salvador on 4 March 2018 to choose 84 members of the Legislative Assembly and 262 mayors. The elections were carried out by the Supreme Electoral Tribunal.
| |||||||||||||||||||||||||||||||||||||||||||||||||||||
This lists parties that won seats. See the complete results below. | |||||||||||||||||||||||||||||||||||||||||||||||||||||
| |||||||||||||||||||||||||||||||||||||||||||||||||||||
Electoral system
The 84 members of the Legislative Assembly are elected by open list proportional representation from 14 multi-member constituencies based on the departments, with seats allocated using the largest remainder method.[1]
Results
 | |||||
| Party | Votes | % | Seats | +/– | |
|---|---|---|---|---|---|
| Nationalist Republican Alliance | 886,365 | 41.72 | 35 | +3 | |
| ARENA-PCN | 35,286 | 1.69 | 2 | ||
| Farabundo Martí National Liberation Front | 521,257 | 24.54 | 18 | -13 | |
| FMLN-CD | 24,405 | 1.15 | 3 | ||
| FMLN-CD-PSD | 12,437 | 0.59 | 1 | ||
| FMLN-PSD | 10,609 | 0.50 | 1 | ||
| Grand Alliance for National Unity | 243,268 | 11.45 | 10 | -1 | |
| National Coalition Party | 230,862 | 10.87 | 9 | +3 | |
| Christian Democratic Party | 65,994 | 3.11 | 2 | +1 | |
| PDC-PCN | 23,455 | 1.10 | 1 | ||
| Salvadoran Patriotic Brotherhood | 20,026 | 0.94 | 0 | 0 | |
| Democratic Change | 19,869 | 0.94 | 1 | +1 | |
| Social Democratic Party | 15,610 | 0.73 | 0 | 0 | |
| Independents | 14,546 | 0.68 | 1 | +1 | |
| Invalid/blank votes | 194,225 | – | – | – | |
| Total | 2,318,754 | 100 | 84 | 0 | |
| Registered voters/Turnout votes | 5,186,042 | 45.73 | – | – | |
| Source: TSE, El Salvador | |||||
By department
| Department | ARENA | FMLN | GANA | PCN | PDC | FPS | CD | PSD | Ind | |||||||||||||||
|---|---|---|---|---|---|---|---|---|---|---|---|---|---|---|---|---|---|---|---|---|---|---|---|---|
| % | S | % | S | % | S | % | S | % | S | % | S | % | S | % | S | % | S | |||||||
| Ahuachapán | 36.41 | 2 | 25.24 | 1 | 7.07 | 0 | 27.46 | 1 | 1.71 | 0 | 2.08 | 0 | - | - | - | - | - | - | ||||||
| Cabañas | 39.45 | 2 | 16.61 | 0 | 20.01 | 1 | 23.39 | 1 | - | - | 0.53 | 0 | - | - | - | - | - | - | ||||||
| Chalatenango | 29.96 | 1 | 25.91 | 1 | 12.29 | 0 | 30.19 | 1 | 0.77 | 0 | 0.18 | 0 | 0.52 | 0 | 0.15 | 0 | - | - | ||||||
| Cuscatlán | 37.89 | 1 | 27.57 | 1 | 2.93 | 0 | 30.38 | 1 | - | - | 0.81 | 0 | - | - | 0.66 | 0 | - | - | ||||||
| La Libertad | 53.71 | 5 | 25.57 | 3 | 10.09 | 1 | 6.20 | 1 | 2.35 | - | 0.98 | 0 | - | - | 1.05 | 0 | - | - | ||||||
| La Paz | 44.15 | 2 | 26.87 | 1 | 18.23 | 1 | 7.56 | 0 | 1.66 | 0 | 0.43 | 0 | - | - | 1.06 | 0 | - | - | ||||||
| La Unión | 47.35 | 2 | 26.09 | 1 | 12.11 | 0 | 7.58 | 0 | 6.26 | 0 | - | - | - | - | 0.58 | 0 | - | - | ||||||
| Morazán | 26.61 | 1 | 31.60 | 1 | 18.25 | 0 | 23.52 | 1 | - | - | - | - | - | - | - | - | - | - | ||||||
| San Miguel | 32.33 | 2 | 29.02 | 2 | 17.90 | 1 | 1.15 | 0 | 18.04 | 1 | 0.56 | 0 | 0.72 | 0 | 0.25 | 0 | - | - | ||||||
| San Salvador | 50.26 | 12 | 26.09 | 6 | 6.29 | 2 | 5.43 | 1 | 3.88 | 1 | 1.17 | 0 | 2.59 | 1 | 1.41 | 0 | 2.82 | 1 | ||||||
| Santa Ana | 38.08 | 3 | 19.10 | 1 | 13.57 | 1 | 16.46 | 1 | 9.99 | 1 | 1.98 | 0 | 0.79 | 0 | 0.18 | 0 | - | - | ||||||
| San Vicente | 48.62 | 1 | 29.54 | 1 | 17.95 | 0 | 36.56 | 1 | - | - | 0.61 | 0 | - | - | 0.52 | 0 | - | - | ||||||
| Sonsonate | 42.25 | 2 | 25.90 | 2 | 11.83 | 1 | 12.82 | 1 | 3.88 | 0 | 0.46 | 0 | 2.06 | 0 | 0.76 | 0 | - | - | ||||||
| Usulután | 39.41 | 2 | 38.44 | 2 | 15.28 | 1 | 5.14 | 0 | - | - | 1.15 | 0 | - | - | 0.56 | 0 | - | - | ||||||
| Total | 41.72 | 38 | 24.54 | 23 | 11.45 | 10 | 10.87 | 9 | 3.11 | 3 | 0.94 | 0 | 0.94 | 1 | 0.73 | 0 | 0.68 | 1 | ||||||
| Source: TSE | ||||||||||||||||||||||||
References
- El Salvador Election Passport
| Presidential elections | |
|---|---|
| Parliamentary elections | |
| Local elections |
|
See also: Elections in the Federal Republic of Central America | |
This article is issued from Wikipedia. The text is licensed under Creative Commons - Attribution - Sharealike. Additional terms may apply for the media files.